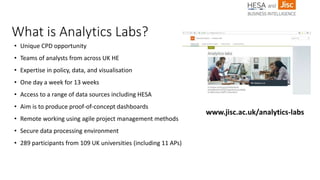
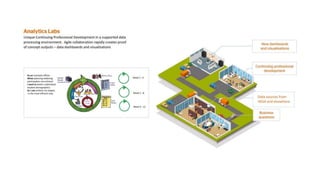
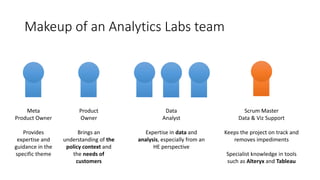
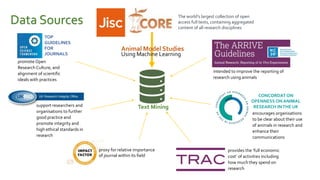
Successfully reported this slideshow.
Your SlideShare is downloading. ×

Reproducibility Analytics Lab

Ad
Ad
Ad
Ad
Ad
Ad
Ad
Ad
Ad
Ad
Ad

Check these out next

1 of 25 Ad

Reproducibility Analytics Lab

Download to read offline

Jisc Analytics Labs is an approach to the development of decision-making tools underpinned by data. This presentation will briefly outline this approach and then focus on the results of the reproducibility lab which used data from articles on animal-based research to assess the degree to which factors affecting research reproducibility are reported

Jisc Analytics Labs is an approach to the development of decision-making tools underpinned by data. This presentation will briefly outline this approach and then focus on the results of the reproducibility lab which used data from articles on animal-based research to assess the degree to which factors affecting research reproducibility are reported

Advertisement
Advertisement

More Related Content

Similar to Reproducibility Analytics Lab (20)

Advertisement

Recently uploaded (20)

Reproducibility Analytics Lab

  1. 1. What is Analytics Labs?
  2. 2. We have worked with partners to create a business intelligence shared service for UK education Runner up in the 2018 National Technology Awards http://nationaltechnologyawards.co.uk/
  3. 3. • Unique CPD opportunity • Teams of analysts from across UK HE • Expertise in policy, data, and visualisation • One day a week for 13 weeks • Access to a range of data sources including HESA • Aim is to produce proof-of-concept dashboards • Remote working using agile project management methods • Secure data processing environment • 289 participants from 109 UK universities (including 11 APs) What is Analytics Labs? www.jisc.ac.uk/analytics-labs
  4. 4. Analytics Labs – Working in an Agile way – Activity, Team Roles and Approach
  5. 5. Makeup of an Analytics Labs team Product Owner Brings an understanding of the policy context and the needs of customers Data Analyst Expertise in data and analysis, especially from an HE perspective Scrum Master Data & Viz Support Keeps the project on track and removes impediments Specialist knowledge in tools such as Alteryx and Tableau Meta Product Owner Provides expertise and guidance in the specific theme
  6. 6. Lab – the environment and tools
  7. 7. Plus Prep, Power BI, PowerPoint, Word, Python, R, Pentaho, Firefox, Chrome, Sublime Text Secure data processing environment with team and shared data prep areas GDPR User Stories, Sprint Goals, Data Sources Backlog, In Progress, Blocked, Done Lab environment and tools used
  8. 8. The Analytics Labs curriculum focuses on 2 of our 5 competencies: • Participating in agile development • Visualising data • Transforming data • Digital collaboration • Understanding policy and the data landscape Curriculum
  9. 9. Team:Conquest ResearchAnalytics Theme: Evolve Downstream effects of research funding Theme: Reproducibility Bias in experimental research
  10. 10. REPRODUCIBILITY
  11. 11. Reproducibility and transparency of published preclinical research involving animal models of human disease is alarmingly low
  12. 12. Aim Understand where improvements might be made Provide a tool to allow service users to JOURNALFUNDERINSTITUTION Evaluate the current state of published preclinical research and explore what initiatives by the scientific community might have an impact on this 1. Benchmark to other users 2. See where targets for improvement might be set 3.Track this progress Focused on from the perspective of
  13. 13. How do we measure reproducibility? Threats to reproducibility are thought to include Blinded assessment of outcome in these animals Compliance with animal welfare regulations Performance of a sample size calculation Potential conflicts of interest Random allocation of animals to group Lack of scientific rigour Low statistical power Questionable research integrity Evaluated the reporting of 5 key quality measures
  14. 14. The world’s largest collection of open access full texts, containing aggregated content of all research disciplines CONCORDAT ON OPENNESS ON ANIMAL RESEARCH INTHE UK TOP GUIDELINES FOR JOURNALS proxy for relative importance of journal within its field support researchers and organisations to further good practice and promote integrity and high ethical standards in research Animal Model Studies Text Mining Using Machine Learning Data Sources promote Open Research Culture, and alignment of scientific ideals with practices provides the ‘full economic cost’ of activities including how much they spend on research intended to improve the reporting of research using animals encourages organisations to be clear about their use of animals in research and enhance their communications
  15. 15. Data Source
  16. 16. More information on Machine learning carried out by the Edinburgh team: This is an algorithm that was developed by James Thomas at UCL and works by starting with a dataset of studies and classing a subset of these manually, then feeding it to the machine so it can use it as a training set in order to “learn” by identifying patterns between the data and your manual decisions (i.e. whether a study should be included because it reports on an animal model of human disease, or it should be excluded from the dataset because it doesn’t report anything of relevance). The more you class manually and feed into the algorithm the more the machine will be able to detect patterns and its performance of being able to do what you are doing as a human, should go up. Obviously this method is not 100% as there is a lot of noise in there, but it can be a very good tool especially when you have thousands of papers to screen, which would otherwise take months and even years in some cases to be performed by a user (made even worse by the fact that the gold standard is for two independent people to screen and then a third to screen disagreements), so this method not only saves time but also is a good method to use when resources are limited. More technical information about the algorithm: The algorithm uses a bag-of-words model for feature selection and support vector machine with stochastic gradient descent for text classification to filter out animal publications. More on this: https://www.biorxiv.org/content/10.1101/280131v1 Performance of machine learning algorithm for selecting our animal studies: Sensitivity 95.5%, Specificity 83.5% and Accuracy 84.7%
  17. 17. More information on Text Mining used by Edinburgh based team: “Text mining is a method used to explore and analyse large amounts of unstructured text to identify concepts/patterns/keywords/phrases in the data. The team used regular expressions, which are essentially a string of rules that tells the computer what conditions of word combinations to use when searching a piece of text. It’s fairly simple in the sense I tell the computer to find me the expression “animals randomly allocated to group” and if it does, class this as the publication having reported random allocation of animals to group. It’s slightly more sophisticated in the sense that when this statement is preceded by “not” for example, the computer should not class this as a match. Unfortunately these are still a work in progress and like the machine learning are not 100%, but again reading these publications manually and classing them like this is an incredibly time-consuming process therefore automating this can be very useful and the fact that it’s not 100% doesn’t affect the overall conclusions that much. In fact, we have found that in some cases the computer identifies publications that should be classed as TRUE, but the human has falsely classified them as FALSE and therefore there is error in both directions.”
  18. 18. Tableau Visualisations and potential dashboards
  19. 19. Note: findings for illustrative purposes only due to small and example prototype research areas explored
  20. 20. Note: findings for illustrative purposes only due to small and example prototype research areas explored
  21. 21. Note: findings for illustrative purposes only due to small and example prototype research areas explored
  22. 22. Note: findings for illustrative purposes only due to small and example prototype research areas explored
  23. 23. Journal Anonymised .. . . . . . . Note: findings for illustrative purposes only due to small and example prototype research areas explored
  24. 24. Note: findings for illustrative purposes only due to small and example prototype research areas explored

Editor's Notes

  • What is Analytics labs
  • Who have Jisc worked with
  • What is labs and what are our aims?
  • In a nutshell Analytics Labs provides a CPD opportunity - Teams work on commonly felt problem spaces, explore the wider national data landscape, acquire HESA and non-HESA data and cleanse, link and transform it creating new proof of concept dashboards.
  • How do we run these analytics labs?
  • Makeup of a team
  • Secure processing environment
  • Secure data processing environment

    Within the secure environment we have a number of cutting edge data manipulation tools for team members to use. These do change but as at May 2019 we included Tableau Desktop and Server, Excel, Alteryx, Pentaho, R, Microsoft Power BI and several others.
  • Curriculum

    Analytics Labs curriculum - developed in response to participant feedback. It’s designed to help you get up to speed with Alteryx and Tableau quickly, by signposting some of the many resources which are available online.
  • Feb – May 2019 – Research analytics lab

    Two key themes 1. Downstream effects of research funding
    2. Reproducibility
  • Team
  • In recent years it has become increasingly clear that that the reproducibility and transparency of published preclinical research involving animal models of human disease is alarmingly low

    Unfortunately, it’s been showed time and time again, especially in more recent years, that research has some major reproducibility issues.
    We focused on animal models of human disease because research shows that reproducibility in this domain is especially low. In terms of transparency research has shown (i.e. systematic reviews) that researchers don’t report enough of their experiments to make them reproducible by other researchers.
    This contributes to what has now been recognised by the media as the “reproducibility crisis”, which plays a role in the translational failure we have between animal models of human disease and the clinic - where drugs tested in animals often then don’t work when they are taken forward to human studies and therefore arguably waste money and resources.

  • Teams aim was to understand where improvements might be made.

    To do this, we can evaluate the current state of published preclinical research and explore what initiatives by the scientific community might have an impact on this at the level of institution, funder and journal.
    The team wanted to design a tool that could be used by these service users to allow them to benchmark themselves with their competitors, see where they might set targets for improvement and ultimately be able to track their progress and any change in relation to changes in practise over time.
  • Threats to reproducibility are thought to include a lack of scientific rigour, low statistical power and questionable research integrity among other things.

    We can attempt to measure these threats to reproducibility by looking at published research papers themselves and assess the reporting of concepts that are intended to reduce these threats in either the design, performance or reporting of research studies.

    The 5 measures we focused on were:
    Random allocation of animals to group: where researchers describe whether or not treatment was randomly allocated to animal subjects so that each subject has an equal likelihood of receiving the intervention. This introduces a selection bias into the experiment if not done.
    Blinded assessment of outcome: Relates to whether or not the investigator involved with performing the experiment, collecting data, and/or assessing the outcome of the experiment was unaware of which subjects received the treatment and which did not. This introduces a detection bias into the experiment if not done.
    Sample size calculation: Describes how the total number of animals used in the study was determined so that we can make sure study that has been performed is adequately powered and is powerful enough to detect a true biological effect.
    Compliance with Animal Welfare Regulations: Describes whether or not the research investigators complied with animal welfare regulations.
    Reporting of any conflicts of interest: Describes if the investigator(s) disclosed whether or not he/she has a financial conflict of interest, for example.
    *Useful paper if you want more explanation on these and why they are important: https://www.ncbi.nlm.nih.gov/pmc/articles/PMC3764080/
  • For our project we started off with the CORE dataset as the main source of our data, a JISC library that is described as the world’s largest collection of open access full-texts, containing an aggregated content of published research articles from a wide range of disciplines.
    1 - Using the CORE-API we extracted 3 years of data to include publications from the years 2016, 2017 and 2018.
    2 - We filled in any missing fields where possible by linking articles to CrossRef. We then used machine learning on these to narrow down the studies to animal model studies specifically.This provided the backbone to our dataset and we subbed this with various other bits of information.
    3 - As we were interested in reproducibility we brought in information about journals, institutions and funders on a number of initiatives that promote open and transparent research culture and encourage robust performance and reporting of science involving animal models of human disease.
    These included things like:
    TOP Guidelines for journals - that promote Open Research Culture
    UKRIO - that support high ethical standards in research
    ARRIVE guidelines - that encourage improved reporting of animal research
    CONCORDAT - who encourage good communication about research
    Alongside other information like: Journal impact factor which is a proxy measure of how prestigious a journal is in its field and information about the TRAC groups for institutions which is an indicator of how much institutions spend on research out of their total funding.
    We also really wanted to look at things like training offered by institutions for example, but these data were difficult to find and therefore fell outside of the scope of this project.

  • Data loss
  • Team Tableau Outputs
  • Overview
    5 key performance factors
    Sample size
    Blinding
    Compliance with regulations
    Conflict of interest
    Randomness

    Modifiers
    TRAC group
    Policies and endorsements
  • Provider comparison tool (benchmarking)
  • What policies and endorsements are associated with improvements in the research we fund
  • Overall impact factor (all measures combined into a single measure)

    By Journal

×