1. Military Interstate Dispute Spatial Relationships
Cold War Space-Time Cluster Analysis
Tyler Gill, University of Missouri, Department of Geography
Background
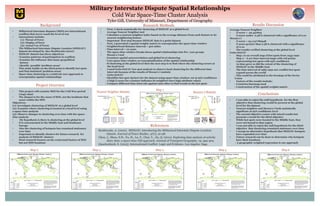
Average Nearest Neighbor
• Z-score = -52.451803
• Z-score under -2.58 is clustered with a significates of 0.01
Moran’s I
• Z-score = 23.1137789948
• Z-score greater than 2.58 is clustered with a significates
of 0.01
• The results verified clustering at the global level
Getis-Ord Gi*
• Map 1 is an overall map of hot spots from 1945-1992
• Map 2 – 6 are time interval maps with red points
representing hot spots with 95% confidence
• As time grew so did the extent of the clustering of
MIDLOC in the Middle East
• The time interval of 1985-1992 saw conflict hot spots
expand across the world
- This could be attributed to the breakup of the Soviet
Union
• Factors of the results include:
- Countries basemap used
- Construction of the spatial weights matrix
Project Overview
• This project will examine MID for the Cold War period
(1945-1992)
• The dataset is for the onset of MID, not the incidents that
occur within the MID
Objectives:
(1): Investigate clustering of MIDLOC at a global level
(2): Examine where clustering is located at a local level using
a space-time analysis
(3): Observe changes in clustering over time with the space-
time analysis
• My hypothesis is there is clustering at the global level
• It is concentrated in the Middle East and Southeast
Europe
• Also the clustering of hotspots has remained stationary
over time
• Important to identify clusters for future research for
analysis of MIDLOC clusters
• Most research focuses on the contextual factors of MID
but not MID locations
• First, I check statistically for clustering of MIDLOC at a global level
• Average Nearest Neighbor tool
- Calculates a nearest neighbor index based on the average distance from each feature to its
nearest neighboring feature
- Important first step because MIDLOC data is a point dataset
• Next, I generated a spatial weights matrix to conceptualize the space-time window
- Neighborhood distance interval = 400 miles
- Time interval = 10 years
• The space-time window breaks down spatial relationships into five year groups
• Moran’s I tool
- Examines spatial autocorrelation and global level clustering
- Uses space-time window as conceptualization of the spatial relationship
- If clustering at the global level then the next step is to find where the clustering occurs at
the local level
• I used Getis-Ord Gi* hot spot analysis to observe local clustering for the different time
intervals because of the results of Moran’s I statistic
• Getis-Ord Gi*
- Identifies hot spot clusters for the dataset using space-time window; set at 95% confidence
- A high Z-score for a feature indicates its neighbors have high attribute values
- Compare different time-intervals against each other to find trends in the hot spots
• Militarized interstate disputes (MID) are international
conflicts that never reach the level of war
• Interactions include:
(1): Threat of Force
(2): Display of force
(3): Actual Use of Force
• The Militarized Interstate Dispute Location (MIDLOC)
dataset developed by Alex Braithwaite (2010)
• MIDLOC dataset has three objectives
- Examine patterns of participation in conflicts
- Examine the influence that many geopolitical
factors
- Identify possible ‘problem-areas’
• This study builds on the third point to identify hot spots
and find statistical ‘problem-areas’
• Space-time clustering is a relatively new approach to
conceptualize spatial relationships
• I was able to reject the null hypothesis for the first
objective that clustering would be present at the global
level for the dataset
• Nearest neighbor and Moran’s I both statistically
significate at 99% confidence level
• The second objective comes with mixed results but
presents a trend for the third objective
• While hot spots were located in the Middle East, they
were not bound to that region
• I was not able to reject the null hypothesis for the third
objective that clustering remained stationary over time
• I accept an alternative hypothesis that MIDLOC hotspots
have expanded over time
• Future research can be done to determine why hotspots
have their locations
- A geographic weighted regression is one approach
Research Methods Results Discussion
Braithwaite, A. (2010). MIDLOC: Introducing the Militarized Interstate Dispute Location
dataset. Journal of Peace Studies. 47(1), 91-98.
Chen, J., Shaw, S.H., Yu, H., Lu, F., Chai, Y., Jia, Q. (2011). Exploring data analysis of activity
diary data: a space-time GIS approach. Journal of Transport Geography. 19, 394-404.
Quackenbush, S. (2015). International Conflict: Logic and Evidence. Los Angeles: Sage.
References
Conclusions
Map 2 Map 3 Map 4 Map 5 Map 6
Nearest Neighbor Statistic Moran’s I Statistic
Map 1