

Recommended
Recommended
More Related Content
More from Tom Cryer
More from Tom Cryer (20)
Recently uploaded
Recently uploaded (20)
Home Price Release
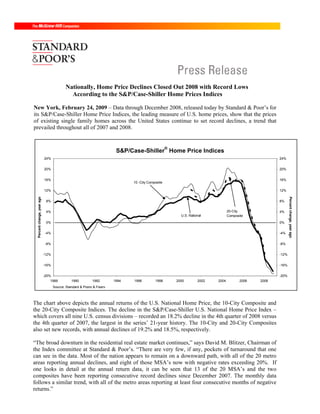
- 1. Nationally, Home Price Declines Closed Out 2008 with Record Lows According to the S&P/Case-Shiller Home Prices Indices New York, February 24, 2009 – Data through December 2008, released today by Standard & Poor’s for its S&P/Case-Shiller Home Price Indices, the leading measure of U.S. home prices, show that the prices of existing single family homes across the United States continue to set record declines, a trend that prevailed throughout all of 2007 and 2008. ® S&P/Case-Shiller Home Price Indices 24% 24% 20% 20% 16% 16% 10 -City Composite 12% 12% Percent change, year ago Percent change, year ago 8% 8% 20-City 4% 4% U.S. National Composite 0% 0% -4% -4% -8% -8% -12% -12% -16% -16% -20% -20% 1988 1990 1992 1994 1996 1998 2000 2002 2004 2006 2008 Source: Standard & Poors & Fiserv The chart above depicts the annual returns of the U.S. National Home Price, the 10-City Composite and the 20-City Composite Indices. The decline in the S&P/Case-Shiller U.S. National Home Price Index – which covers all nine U.S. census divisions – recorded an 18.2% decline in the 4th quarter of 2008 versus the 4th quarter of 2007, the largest in the series’ 21-year history. The 10-City and 20-City Composites also set new records, with annual declines of 19.2% and 18.5%, respectively. “The broad downturn in the residential real estate market continues,” says David M. Blitzer, Chairman of the Index committee at Standard & Poor’s. “There are very few, if any, pockets of turnaround that one can see in the data. Most of the nation appears to remain on a downward path, with all of the 20 metro areas reporting annual declines, and eight of those MSA’s now with negative rates exceeding 20%. If one looks in detail at the annual return data, it can be seen that 13 of the 20 MSA’s and the two composites have been reporting consecutive record declines since December 2007. The monthly data follows a similar trend, with all of the metro areas reporting at least four consecutive months of negative returns.”
- 2. S&P/Case-Shiller U.S. National Home Price Index 200 20% US National, index level (left) US National, %chya (right) 15% 180 10% 160 Nationally, home prices are back 5% to their late-2003 levels 140 0% 120 -5% 100 -10% 80 -15% Record low decline of 18.2% in 2008Q4 60 -20% 1988 1990 1992 1994 1996 1998 2000 2002 2004 2006 2008 The chart above shows the index levels for the U.S. National Home Price, as well as its annual returns. As of December 2008, average home prices across the United States are at similar levels to what they were in the third quarter of 2003. From the peak in the second quarter of 2006, average home prices are down 26.7%. All 20 metro areas are reporting negative monthly and annual rates of change in average home prices. Boston, Denver, Los Angeles, San Diego and Washington D.C. are reporting a relative improvement in year-over-year returns, in terms of lesser rates of decline than last month’s values. Detroit showed a marginal improvement in monthly returns, but was worse off in its annual rate. Minneapolis, Las Vegas and Phoenix all reported monthly declines in excess of 4.5% in December. The seven worst performing cities in terms of year-over-year declines continue to be from the Sunbelt, reporting negative returns in excess of 20%. Phoenix was down 34.0%, Las Vegas reported -33.0% and San Francisco fell 31.2%. Denver, Dallas, Cleveland and Boston faired the best in terms of annual declines down 4.0%, 4.3%, 6.1% and 7.0%, respectively. Looking at the data from peak-thru-December 2008, Dallas is down a relatively mild 8.6% from its peak in June 2007, while Phoenix is down 45.5% from its peak in June of 2006. The rates of decline from the individual heights of each market are evidence of how much each market has taken back in terms of the gains earned in the past 10-15 years. Eighteen of the 20 metro areas are in double digit declines from their peaks, with half of the MSA’s posting declines of greater than 20% and four of those (Las Vegas, Miami, Phoenix and San Francisco) in excess of 40%. The table on the next page summarizes the results for December 2008. The S&P/Case-Shiller Home Price Indices are revised for the 24 prior months, based on the receipt of additional source data. More than 21 years of history for these data series is available, and can be accessed in full by going to www.homeprice.standardandpoors.com
- 3. 2008 Q4 2008 Q4/2008 Q3 2008 Q3/2008 Q2 Level Change (%) Change (%) 1-Year Change (%) U.S. National Index 139.14 -7.2% -3.5% -18.2% December 2008 December/November November/October Metropolitan Area Level Change (%) Change (%) 1-Year Change (%) Atlanta 113.87 -2.3% -2.7% -12.1% Boston 153.05 -1.3% -2.6% -7.0% Charlotte 122.41 -2.5% -1.9% -7.2% Chicago 137.16 -3.0% -2.8% -14.3% Cleveland 105.21 -2.1% -1.2% -6.1% Dallas 115.63 -2.3% -1.9% -4.3% Denver 125.74 -1.5% -1.1% -4.0% Detroit 80.93 -3.0% -3.1% -21.7% Las Vegas 131.40 -4.8% -3.3% -33.0% Los Angeles 171.46 -2.5% -2.2% -26.4% Miami 165.01 -2.7% -2.2% -28.8% Minneapolis 127.00 -4.6% -2.2% -18.4% New York 183.50 -1.7% -1.6% -9.2% Phoenix 123.93 -5.1% -3.4% -34.0% Portland 158.50 -2.5% -2.3% -13.1% San Diego 152.16 -2.1% -2.3% -24.8% San Francisco 130.12 -3.8% -3.0% -31.2% Seattle 160.19 -3.6% -2.5% -13.4% Tampa 156.04 -3.0% -2.8% -22.0% Washington 176.34 -2.2% -2.5% -19.2% Composite-10 162.17 -2.3% -2.2% -19.2% Composite-20 150.66 -2.5% -2.3% -18.5% Source: Standard & Poor's and Fiserv Data through December 2008 The S&P/Case-Shiller Home Price Indices are published on the last Tuesday of each month at 9:00 am ET. They are constructed to accurately track the price path of typical single-family homes located in each metropolitan area provided. Each index combines matched price pairs for thousands of individual houses from the available universe of arms-length sales data. The S&P/Case-Shiller National U.S. Home Price Index tracks the value of single-family housing within the United States. The index is a composite of single-family home price indices for the nine U.S. Census divisions and is calculated quarterly. The S&P/Case-Shiller Composite of 10 Home Price Index is a value-weighted average of the 10 original metro area indices. The S&P/Case-Shiller Composite of 20 Home Price Index is a value-weighted average of the 20 metro area indices. The indices have a base value of 100 in January 2000; thus, for example, a current index value of 150 translates to a 50% appreciation rate since January 2000 for a typical home located within the subject market. These indices are generated and published under agreements between Standard & Poor’s and Fiserv, Inc. The S&P/Case-Shiller Home Price Indices are produced by Fiserv, Inc. In addition to the S&P/Case- Shiller Home Price Indices, Fiserv also offers home price index sets covering thousands of zip codes, counties, metro areas, and state markets. The indices, published by Standard & Poor's, represent just a small subset of the broader data available through Fiserv. About Standard & Poor’s Index Services Standard & Poor's Index Services, the world’s leading index provider, maintains a wide variety of investable and benchmark indices to meet an array of investor needs. Its family of indices includes the S&P 500, an index with $1.5 trillion invested and $4.85 trillion benchmarked, and the S&P Global 1200, a composite index comprised of seven regional and country headline indices. For more information, please visit www.standardandpoors.com/indices. About Standard & Poor’s Standard & Poor's, a subsidiary of The McGraw-Hill Companies (NYSE:MHP), is the world's foremost provider of independent credit ratings, indices, risk evaluation, investment research and data. With approximately 10,000 employees, including wholly owned affiliates, located in 23 countries and markets, Standard & Poor's is an essential part of the world's financial infrastructure and has played a leading role for more than 140 years in providing investors with the independent benchmarks they need to feel more confident about their investment and financial decisions. For more information, visit http://www.standardandpoors.com.
- 4. For more information contact: David Blitzer David Guarino Chairman of the Index Committee Communications Standard & Poor’s Standard & Poor’s 212 438 3907 1 212 438 1471 david_blitzer@standardandpoors.com dave_guarino@standardandpoors.com