The daily analysis report from TP Global FX provides summaries of Asian market news and technical analysis of major currency pairs. Key headlines include Shanghai implementing a lockdown to curb COVID cases and the Bank of Japan offering unlimited purchases of 10-year government bonds. Technical analysis indicates down trends for EUR/USD, GBP/USD, USD/CAD and gold, while AUD/USD and USD/JPY show up trends. Support and resistance levels are identified for potential buy and sell trade ideas on each currency pair.


![BUY SELL
R
E
P
O
R
T
F
R
O
M
:
T
P
G
LO
B
A
L
F
X
Technical Summary
Trend Down Trend
Moving Average (Period=75) Below MA
H 1
RSI (Period=26) Below RSI LEVEL 50
FIBO Levels PIVOT
R1 S1
1958
R2 S2
1962
R3 S3
1968
R4
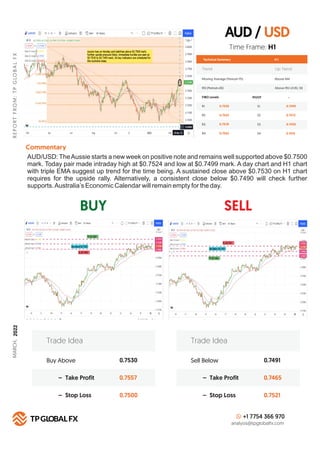
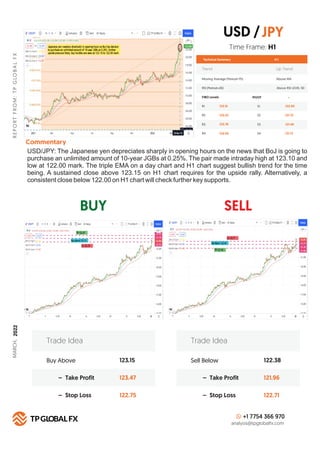
Commentary
S4
1974
Buy Above 1952
1958
1946
– Take Profit
– Stop Loss
Trade Idea
Sell Below 1937
1930
1942
– Take Profit
– Stop Loss
Trade Idea
+1 7754 366 970
analysis@tpglobalfx.com
-
Time Frame: H1
XAU/USD (GOLD): Gold weakens on earlyAsian hours and slips back below $1,950 mark. Today pair
made intraday high at $1,958 and low at $1,942 mark. A triple EMA on a day chart is up and H1 chart
suggests bearish trend for the time being.Asustained close above $1,958 on H1 chart requires for the
upside rally. Alternatively, a consistent close below $1,937 will check further supports. U.S. trade
balance data will release at 1230 GMT.
XAU [GOLD]
USD
/
1937
1932
1926
1921
MARCH,
2022](https://image.slidesharecdn.com/daily-analysis-report-march-28-2022-220329050504/85/DAILY-ANALYSIS-REPORT-MARCH-28-2022-8-320.jpg)