꧁ ୨ Call Girls In Radisson Blu Plaza Delhi Airport, New Delhi ❀7042364481❀ Es...
final_report_on_market_survey_on_percept (1).docx
1. 1
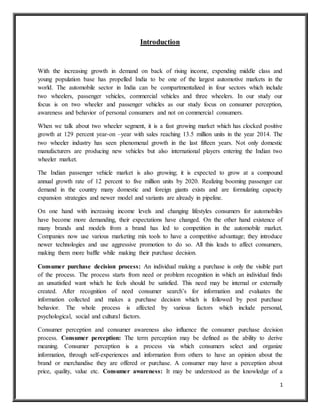
Introduction
With the increasing growth in demand on back of rising income, expending middle class and
young population base has propelled India to be one of the largest automotive markets in the
world. The automobile sector in India can be compartmentalized in four sectors which include
two wheelers, passenger vehicles, commercial vehicles and three wheelers. In our study our
focus is on two wheeler and passenger vehicles as our study focus on consumer perception,
awareness and behavior of personal consumers and not on commercial consumers.
When we talk about two wheeler segment, it is a fast growing market which has clocked positive
growth at 129 percent year-on –year with sales reaching 13.5 million units in the year 2014. The
two wheeler industry has seen phenomenal growth in the last fifteen years. Not only domestic
manufacturers are producing new vehicles but also international players entering the Indian two
wheeler market.
The Indian passenger vehicle market is also growing; it is expected to grow at a compound
annual growth rate of 12 percent to five million units by 2020. Realizing booming passenger car
demand in the country many domestic and foreign giants exists and are formulating capacity
expansion strategies and newer model and variants are already in pipeline.
On one hand with increasing income levels and changing lifestyles consumers for automobiles
have become more demanding, their expectations have changed. On the other hand existence of
many brands and models from a brand has led to competition in the automobile market.
Companies now use various marketing mix tools to have a competitive advantage; they introduce
newer technologies and use aggressive promotion to do so. All this leads to affect consumers,
making them more baffle while making their purchase decision.
Consumer purchase decision process: An individual making a purchase is only the visible part
of the process. The process starts from need or problem recognition in which an individual finds
an unsatisfied want which he feels should be satisfied. This need may be internal or externally
created. After recognition of need consumer search’s for information and evaluates the
information collected and makes a purchase decision which is followed by post purchase
behavior. The whole process is affected by various factors which include personal,
psychological, social and cultural factors.
Consumer perception and consumer awareness also influence the consumer purchase decision
process. Consumer perception: The term perception may be defined as the ability to derive
meaning. Consumer perception is a process via which consumers select and organize
information, through self-experiences and information from others to have an opinion about the
brand or merchandise they are offered or purchase. A consumer may have a perception about
price, quality, value etc. Consumer awareness: It may be understood as the knowledge of a
2. 2
consumer about available products and services being marketed or sold. It allows the buyer to get
the most from what he buys.
It is evident from literature that consumer adds products to his/her choice basket about which he
is aware of and has a positive perception. When an individual make a purchase he/she
recolonizes an unsatisfied want which may be his own psychological want or a want created by
external factors. Then he/she searches for information which he may collect from various
sources. This is where consumer awareness comes into picture. His/her awareness provides the
information. The evaluation of alternatives is influenced by perception. Then the purchase is
made followed by post purchase behavior. All these lead to behavior of the consumer.
The whole process remains the same in case of automobile. When an individual recognizes a
need for a vehicle he collects information evaluates it and make the purchase. In India as
discussed above automobile sector is a vast market. Where there is a great demand for vehicles
and many firms catering the demand. It is necessary to understand consumer awareness and
consumer perception and the influence of consumer awareness and perception on purchase
decision process.
This study is being conducted to understand factors leading to consumer awareness and
perception and to establish a relationship of these factors on their buying behavior.
3. 3
Objective
The primary objective of the survey conducted on the automobile sector was to examine the
factors related to consumers while purchasing or pre purchasing an automobile.
The factors leading to consumer perception, consumer awareness and consumer behavior were
critically observed and examined to establish a relationship in their buying behavior. How ideally
a consumer thinks is he aware of the latest technological innovations happening around in the
automobile sector? What is his perception related to the various segments of automobiles
available? What are the considerations that come across while purchasing.
The study was undertaken with the following objectives:
1. To understand and define the factors influencing the purchase decision of an
individual for an automobile.
2. To identify factors influencing consumer awareness and study the influence of
demographic variables on these factors.
3. To identify factors influencing consumer perception about a particular brand of
automobile.
4. To find out brand preferences of individuals in the automobile sector.
5. To identify the factors influencing change of automobile by individuals and study
the influence of demographic variables on these factors.
4. 4
Review of Literature
Paper 1
Alicia Barrosco, Gerard Llobet
Advertising and Consumer Awareness of New, Differentiated Products
Journal of Marketing Research Vol. XXIX Dec.2012 p.p. 773-792
Objective
The main objective of this paper is to find out the effect of advertising expenditures incurred by
organizations on awareness among consumer about their products. It also tries to find out how
awareness among consumer leads to increase present and future sales, as consumers include
products in their choices, about which they are aware.
Methodology
It is an empirical approach. A survey was conducted and data was collected about Spanish
automobile market.
Context
Country- Spain
This study describes a model of consumer purchasing behavior with relation to his/her awareness
about the products, which is affected by advertising done by firms. This study is conducted using
data from Spanish automobile market.
Findings
i. Advertising has a direct relationship on consumer awareness and sales of the product.
ii. Consumers are more aware about products which they see regular adds and add it to
their choices.
iii. There is a positive effect on firm’s sales as a result of advertising expenditure incurred
by firm.
iv. There is a negative effect on firm’s sales as a result of competitors advertising and
introduction of newer products in the market.
5. 5
Paper 2
Manish Jha, Rajeev Sirohi, SumanMadaan, ShilpiArora
The Impact of Advertisement on Consumer Buying Behaviour in Two Wheeler Segment
Journal of Marketing and Communication Vol. VII 2011
Objective
The objective of this study is to find the impact of advertisement as a promotional tool. Analyze
the consumer decision making process and also to find out the motivating factors for consumer
in purchasing two wheelers.
Methodology
This study is an empirical approach. It is based on both primary and secondary data. The main
sources of secondary data are newspapers, magazines, journals and published reports of the
industry. Primary data was collected through questionnaire designed to gather data relevant.
Context
Country- India
The study was conducted to find out the relation between advertising and consumer buying
behavior in two wheeler industry in India. Survey was conducted in Panipat district.
Findings
i. Advertising plays a major role in communicating to the consumer information and
specifications about the product.
ii. The most preferred media for advertising is television followed by print media in case of
India.
iii. People are mostly motivated by user lifestyle, peer group and status factors to buy two
wheelers.
Paper 3
DorianaDumitrelaMorar, Claudia Maria
An Empirical Investigation upon the Values Appreciated by Consumers Regarding the
Automotive Industry
International Conference on “Marketing- from Information to Decision” VII Edition 2014 p.p.
170-184
6. 6
Objective
The objective of this study is to find out what are the values within the automotive industry that
the car users, payers and buyers look for. It also tries to understand what value is and deeply
understand its nature, the importance of developing a higher value by the business than their
competitors and the primary role played by researching consumer behavior. There are very
important elements that lead to value creating strategies so it is to determine these elements.
Methodology
This is an empirical research. Questionnaire was used as a instrument to collect information
through face to face survey.
Context
Country- Romania
The survey was conducted in Romania among car consumer to find out what are the values that
these consumers look for.
Findings
i. For the users, the concept of performance of cars implies a sum of aspects. The car class,
safety, equipment, consumption are primarily related to performance.
ii. Car class, safety, equipment, consumption are aspect considered vital for performance.
iii. The consumers' income influences the supplementary equipment they desire for their car.
Paper 4
GunjanMalhotra, Abhishek Nandi, Amitava Mukherjee
An Empirical Research on Consumer Behaviourtowards Small Car Segment in Indian Market
Business Perspective and Research 2012 p.p. 37-47
Objective
The paper studies to find a link between consumer perception and their expectation towards
automobiles in India. The study tries to understand consumers perception towards various
automobile features and their preference towards a particular brand of small car.
Methodology
7. 7
It is an empirical research. A survey based on questionnaire was conducted. The questionnaire
contained questions on consumer’s choice of cars, consumer perception on the various
features/attributes which influence the respondents to choose a particular brand.
Context
Country- India
The study finds a relationship between consumer perception and their expectations. The study
was conducted in Delhi (countries capital) and nearby cities.
Findings
i. The parameters which affect consumer purchase decision of small car include price,
fuel efficiency, exterior looks, public perception, brand, after sales, environment
friendly, technology, safety features, models and colors, maintenance cost, leg space,
engine capacity, seating capacity, ground clearance, audio system, sturdiness of
vehicle, promotional schemes available, warranty and promise of service and interior
design.
ii. The parameters listed above also have a strong impact on consumer perception and
their choice of a particular brand.
iii. These parameters which affect consumer purchase decision of cars can be broadly
classified as aesthetic of the car, the overall cost to consumers, space, trust and
reliability of the brand.
Paper 5
James Wetzel, George Hoffer
Consumer Demand for Automobiles: A Disaggregated Market Approach
Journal of Consumer Research Vol. IX 1989 p.p. 195-199
Objective
The objective of the study is to develop a model to estimate consumer demand equations for
several categorize of automobiles. It tries to find out the extent to which changing motor fuel
prices have contributed to the change in demand of sizes and classes of automobiles. It also tries
to know consumer preference for imported cars.
Methodology
8. 8
This is a conceptual approach. It has developed a model on the basis of literature on theory of
consumer choice and theory of firms. It has developed equations keeping in mind the objectives
of consumer as well as firms. It uses coefficient regressions to interpret the results.
Context
Country- The United States of America
The study is about a equation model which uses various demand and supply functions to have a
solution to the problems of consumers on one hand and problems of firms on the other hand.
Findings
i. The quantity demanded for a specific automobile is a function of price, level of national
economic activities, price of substitutes and compliments. In addition relative styling or
technological changes can be expected to affect demand.
ii. Supply of the automobile is a function of price, vector prices of corresponding to inputs
and level of technology.
iii. It is reflected that high income group consumers have a demand based more on
technological and styling aspects. They have a demand for imported automobiles.
Whereas medium and low income group consumer demand is based more on price and
price of compliments.
Paper 6
SomAdityaJuyal, M P Singh
Role of Females in Family Buying Decision Making
The Journal of Business Perspective Vol. XIII 2009 p.p. 15-23
Objective
The objective of the study is to uncover the general patterns of family decision-making involving
females and their buying role orientation for consumer durables, and to investigate the variables
which affect female role orientation. It tries to find out the effect of female role orientation and
role structure in family decision making.
Methodology
It is an empirical approach. It is uses a structured questionnaire to collect primary data relevant.
Face to face interview were conducted among three hundred females on five purchasing
9. 9
decisions to find out the female role orientation and role structure in family purchase decision
making of consumer durables.
Context
Country- India
The study tries to judge factors which effect the orientation of females consumers and their
effect on family purchase decisions. Survey was conducted among females in Dehradun district
Uttrakhand.
Findings
i. Demographic factors such as family size, education level, age, occupation and income
levels of family have a significant impact on their purchase decision making.
ii. Females have a significant and dominating role in decisions relating to model, color and
designing of consumer durables whereas males have a dominant role in decision related
to brand choice, timing of purchase and selection of dealers.
iii. Females have different role for durables for self-usage and usage by the family. They
take more participation in purchase decisions of durables for self-usage and less in
purchase decision of durables for family usage.
Paper 7
TahmidNayeem, RizaCasidy
The Role of External Influences in High Involvement Purchase Behavior
Marketing Intelligence and Planning, Vol. XXXI p.p. 732-745
Objective
The objective of the study is to examine the differences between consumer decision making style
s in terms of the importance of information sources, in terms of important given to external
influences such as importance of dealers, importance of friends/family members, number of cars
test driven.
Methodology
This is the empirical study, the data were collected from 209 respondents using self-
administered questionnaires.
Context
10. 10
Country- Australia.
This paper deals in the consumer decision making style and aggregate of all external factors
responsible to influence consumer to buy an automobile.
Findings
i. This type of buyers tends to spend less time with cars dealers to avoid the overload of the
information.
ii. The confused buyers give less preference to family or friends in making decision
regarding buying an automobile.
iii. The buyers who are least confused by over choice tends to spend less time in researching
because they want to simplify their decision making and avoid possible confusion that
arise when they spend more time to research on cars.
iv. The logical buyers are confused by the overload of the information given by the dealers.
Paper 8
Guru PrakashPrabhakar
An Insight into an Italian Automotive Company’s Experience in India
Management Decision Vol.48 2010 pp. 1010-1022
Objective
India is emerging as an economic power over recent years. So an Italian automotive company
wants to know the growing market for automobiles in India and how business are founded and
structured in India.
Methodology
Researcher used empirical methodology. Data has been collected from 62 nation worldwide.
Context
Country- India.
This paper mainly talks about the key leader behaviors that are vital to the business.
Findings
i. Italian automotive company ‘fiat’ is trying to adapt with the changing dynamics of the
Indian automobile industry
11. 11
ii. India ids find to be a country where entry barrier is low so Italian automotive company
easily enter into the Indian market.
iii. Population is growing with growing economy and purchasing power is also increasing
that attaract the Italian automotive company.
iv. Pricing is going to play an important role due to emergence of a huge middle class
population in India.
Paper 9
ArpitaMukharjee, DivyaSatija, M.goyal.
Are Indian Consumer are Brand Conscious Insight for Global Retailers.
Asia Pacific Journal of Marketing and Logistics Vol. XXIV pp. 482-499
Objective
The objective of this paper is to asses brand awareness of Indian consumers and it can be check
on the basis of their brand knowledge and perception about foreign brands.
Methodology
This is the empirical study the survey of 300 Indian consumers was conducted and then the data
was analyzed.
Context
Country- India.
Study has been done in certain part of India to know about their awareness about various brands
available.
Findings
i. Knowledge and use of foreign brands is low among Indian consumers.
ii. Indian consumers are very much price sensitive.
iii. Indian consumers would like more foreign brands enter the Indian market.
iv. Indian consumers are heterogeneous. Their preference for branded vis-à-vis none branded
products vary across product categories.
Paper 10
Juyongkim, Myung Suk kim.
Analysis of Automobile Repeat Purchase Behavior on CRM.
12. 12
Industrial Management and Data System, Vol. 114 pp. 994-1006
Objective
The objective of this paper is to select an efficient service programmed for customer. Analysis of
repeat purchase behavior and extract relevant things that is use of dealers.
Methodology
This is the empirical study.one thousand consumers were randomly selected among buyers who
has purchased at least one passenger car.
Context
Country- Korea.
This study shows the effect of customer relation management on purchase behavior of consumer.
Findings
i. Age, Change in vehicle type and marketing promotions affect repeat purchase.
ii. Repair services are proved to be efficient marketing trends.
iii. Blue services and online access are not effective for everyone.
iv. Tendency to purchase same type of things that a consumer has already used.
Paper 11
Kent B Monore
Price and Customer Perception of Value
Reflections and Advances in Business Marketing and Purchasing. Vol.19 p.p. 129-152.
Objective
This paper is throwing light upon the effect of price on consumer behavior regarding the
consumer’s perception about a product if its price is high or changes. Price is turnout to be a
indicator for product quality and customer perception of quality, benefits and value affects how
they will respond to purchase situation.
Methodology
Empirical study is done with survey conducted on 900 respondents and data was analyzed using
descriptive statistics, exploratory factor analysis.
Context
13. 13
Country- Australia.
This paper also discusses about the perceived gains arising from price-quality judgment and its
comparison from the perceived sacrifice required acquiring the product.
Findings
i. The way the sale is advertised will influence buyer’s judgment about the value that has
been offered.
ii. Availability of information, people tend to put more weight on the information that is
most readily available.
iii. The order of price presentation anchors buyer’s judgments as do the low and high prices
in a product line.
iv. Buyer’s use price as a indicator of quality.
v. It is found that the expenses on electric utilities were highly begrudged.
vi. When a buyer use price as an indicator of cost or sacrifice, an increase in price would
have effect on reducing their perceived value.
Paper 12
J Gavan, Vicki Fitzsimons, G Morwitz
The Effect of Measuring Intent on Brand-Level Purchase Behavior
Journal of Consumer Research Vol. 231996
Objective
This paper aims at studying the effect of measuring intent on brand-level purchase behavior.
Methodology
This is an empirical approach. The data come from eight waves of mail surveys sent to a large
consumer mail panel provided by sponsors of this research.
Context
Country- The United States of America
This paper’s objective in the current research is to further explore the mere-measurement effect
by examining the effect of measuring purchase intentions on which brands consumers purchase.
Findings
i. The consumer’s position in the consumer choice process is one critical factor.
14. 14
ii. When deciding which alternatives to consider, the accessibility of a brand name may
have an effect similar to that of the accessibility of an attitude toward the brand.
iii. Consumers who are at late stages in the decision making process are likely to have
already formed attitudes and purchase intentions.
iv. The results also suggest the need to develop methods to reduce such intent-measurement
effects. Future research should develop taxonomies for determining what market
structure conditions, consumer characteristics, and measurement tasks lead to increases or
decreases of sales at both the product category and brand levels.
Paper 13
Saikat Banerjee
Study on Consumer Buying Behavior during Purchase of a Second Car
Journal of Marketing & Communication Vol. VI 2010
Objective
This paper aims at the primary objective of study on Consumer Buying Behavior during
Purchase of a Second Car.
Methodology
To analyze the result, Gonzalez’s et al (2002) approach is used in analyzing the factors Factor
analysis identifies a relatively small number of factors that represent relationships In the analysis,
the Varimax rotation with Kizer normalization is used for orthogonal rotation of the loadings so
that the variance of the squared loading in each column is maximized and in turn,
Context
Country- India
This paper tries to know the perception that influences the consumer’s mind and these
information can be used by the marketers to persuade the consumers in an efficient manner to
purchase a second car.
Findings
i. For a new car purchase, a car’s attraction is not only at the functional, tangible level but
also at the intangible, symbolic level. As a result, consumers’ reactions to cars are often
emotional and unconscious.
15. 15
ii. Consuming behavior of an individual would be directed towards enhancing self-concept
through the consumption of goods as symbols.
iii. The level of satisfaction determines the depth of customers’ commitment towards a
brand. Experienced consumers should be better able to assess the pros and cons of
engaging in the behavior and to understand the factors that will influence the decision
than other consumers.
iv. The enjoyment from sharing is enhanced when other people provide positive judgments.
v. With respect to the family life cycle, it has been observed that the second cars are
purchased mostly in the “parenthood stage”. Family is of dominant concern for most
Indians.
Paper 14
Lucinda Parmer, John Dillard
The Relationship between Personality and Consumer Behavior Buying Patterns within the
Automobile Industry
Global Conference on Business and Finance Proceedings Vol. X
Objective
This paper aims at the primary objective of understanding the relationship between personality
and consumer behavior buying patterns within the automobile industry
Methodology
A 33-item questionnaire was administered in person and online by the authors. The subjects were
working professionals in the Houston, Texas metropolitan area. Consumer buying behavior was
assessed using 4 different items. The respondents in this survey consisted of 488 working
professionals. Sample subjects were 51% female, and 49% male.
Context
Country- Houston, Texas
Metropolitan area the factors mentioned in the paper would help in determining and
understanding the buying behavior patterns.
Findings
i. Type of ownership was significantly associated with the extraversion domain. Those who
lease their vehicle.
16. 16
ii. Among demographic characteristics, ethnicity was the only factor that was significantly
associated with all four buying behavior indicators.
iii. Age was also a significant predictor of likelihood of repurchasing, and having previously
owned the same brand, with those in the oldest age category most likely to indicate they
would repurchase, and most likely to previously own more vehicles within the same
brand.
iv. Number of children was a significant predictor of the number of vehicles previously
owned with participants who had no children the least likely to report previous
ownership.
v. Level of education and annual household income were both significant predictors.
Paper 15
Caroline Goukens, Siegfried Dewitte, and LukWarlop
Me, Myself, and My Choices: The Influence of Private Self-Awareness on Choice.
Journal of Marketing Research Vol. XLVI 2009 p.p. 682–692
Objective
The main objective of the paper is to find out the impact of private self-awareness on consumer
decision making. It also finds the ease of preference formation of individual by private self-
awareness which makes them more willing and able to rely on their personal preference weights.
Self-awareness is less inclined to opt for a varied choice set. If consumers feels to find that it is
difficult to construct personal preference they do not like to compromise options.
Methodology
It is an empirical approach with literature review in which four studies have been done a survey
of 116 undergraduate students (45 men, 71 women) are been conducted at university.
Context
Four studies have been done. First one is that privately self-aware consumers are less inclined to
opt for a varied choice set(Study 1), And are less likely to select compromise options (Studies 2
and 3),Unless they find that it is too difficult to construct their personal preferences (Study 4).
Findings
i. The study begins with the assumption that at any given time, people’s attention may be
focused on themselves or the environment, but not both.
17. 17
ii. Variety Seeking- When consumers make multiple purchases for several consumption
occasions, they tend to select a greater variety of items than they would if they were
making purchases sequentially.
iii. Compromise Effect- The compromise effect refers to the phenomenon by which options
with extreme values on some key attribute dimensions appear to be less attractive in the
presence of options with “safe” intermediate values than in the absence of those
compromise options. This effect implies that an alternative tends to gain market share.
iv. Self-aware people try to decrease the discrepancies between their current behavior and
personal standards. The study shows this tendency has a direct and consequent impact on
consumer decision making.
v. Greater self-awareness, consumers are more willing and able to rely on their personal
preference weights.
vi. Privately self-aware consumers are less inclined to opt for a varied choicest and are less
likely to select compromise options.
Paper 16
Dominique M. Hanssens
Order Forecasts, Retail Sales, and the Marketing Mix for Consumer Durables
Journal of Forecasting 1998 Vol. 17 p.p. 327-346
Objective
The main objective of the paper is to find the long-term behavior of orders and consumer sales.
And building good forecasting and marketing mix models for retail orders and consumer sales is
a high-value proposition to manufacturers of high-technology durables.
Methodology
He used new long-term time-series techniques to establish the longitudinal behavior of orders
and consumer sales and their connection. This allowed us to separate temporary versus
permanent movements in orders and sales, and to use that information strategically. We also
integrated a successful primary market research method, conjoint analysis, in an aggregate
market response model. Here it is used statistical models from econometrics, time-series analysis
and conjoint measurement. Though some of these methods are relatively new to the marketing
literature, we will keep technical discussion to a minimum and refer the interested reader to more
detailed literature.
Context
The study is done in the context of case studies.
18. 18
Findings
i. The accurate prediction and management of factory orders is a complex and strategically
important activity, especially in fast-moving high-technology markets.
ii. The most accessible data, factory orders, are noisy and do not lend them-selves well to
direct forecasting, due to the bullwhip effect.
iii. More appropriate data such as consumer sales and marketing-mix movements are more
difficult to bring together.
iv. markets for high-technology durables become more crowded and demand volatility
v. Increases with shortening life cycles, the strategic importance of order forecasting and
response-based marketing planning increases.
vi. Using an actual case study in high-technology durables, how a good marketing data
warehouse and the use of some rigorous statistical methods can help resolve the order
forecasting challenge.
Paper 17
N. Yugal, S. Pandey, M S Kulkarni
Competitive Priorities for Indian Car Manufacturing Industry (2011-2020) for Global
Competitiveness.
Global Journal of Flexible System and Management Vol. XII 2011 p.p.9-20
Objective
The main objective of the paper is to find out the competitive priorities and their relative
importance and understand the manufacturing strategies on these priorities for Indian automotive
manufactories’ during the decade 2011-2020
Methodology
It is an empirical study. In which the questionnaire was mailed to 340 senior executives of major
Indian car manufacturing and automotive consultants.
Context
The study is done in the context of India
Findings
i. Highest preference for the consumer perspective.
ii. Then followed by quality and cost.
19. 19
iii. Innovative and product technology is next important.
iv. Delivery has been seen comparatively low preference by Indian automotive
manufacturing which shall.
Paper 18
J S McDonnell, Dr. L V Defries, Dr. P J Sheehan
The Demand for New Motor Vehicles
Australian Economics Review Vol. II p.p. 35-44
Objective
The main objective of the paper is to find out that the new registration of motor vehicles is a
function of both the ability to buy ( measured in terms of income, credit availability, relative
prices), and willingness to buy( measured by our consumer sentiment data). And
Methodology
It is a conceptual model of study which will help to measure the consumer sentiment to explain
and predict consumer behavior then empirical analysis is done.
Context
The study is done in the context of Australian consumer.
Findings
i. Kotona’s theory simply states that consumption is a function of the ability to buy and the
willingness to buy, where the ability may be indicated by variables such as income, the
availability of credit and prices, and the willingness may be proxies by consumer
sentiment measures.
ii. Consumer sentiment and changes in new registration index was not much related.
iii. Individual attitudinal questions were highly correlated to new registration.
iv. Buying intention (in terms of household use, etc.) was related to new registration.
v. Attitudinal indexes were also found important.
vi. Overall, it was found that sentiment was most highly related to levels of new
registration.
20. 20
Research Methodology
Objective of the Research
The present study was undertaken with the objectives to understand and define the factors
influencing the purchase decision of an individual for an automobile, to identify factors
influencing consumer awareness and establish a relationship of these factors with relation to
demographic variables, to identify factors influencing consumer perception about a particular
brand of automobile, to find out brand preferences of individuals in the automobile sector, to
identify the factors influencing change of automobile by individuals and study the relationship
between these factors and demographics.
Research Process
Extensive Literature Review
This is the most important part of any research because it gives us the understanding to do our
research in the right direction .So we undertake extensive literature survey connected with the
problem. For this purpose, we tapped academic journals, conference proceedings, books etc.
Research Design
For our research we obtain the information from extensive Literature Review and Market
Survey. As our research is exploratory that is why we chose a flexible research design which
provides opportunity for considering many different aspects of a problem.
Determining sample design
As the total geographical area of our interest is big one so we chose convenience sampling.
Convenience sampling is a sampling technique where subjects are selected because of their
convenient accessibility and proximity to the researcher.
Our survey is conducted in Allahabad. The sample size we are considering is hundred and the
sample will be selected on the basis of convenience sampling.
Collecting the data
First to design our questionnaire we collect information from internet, journals, and academic
reports. After designing questionnaire we go to market area survey. Collect raw data from our
survey.
21. 21
Analysis of data
After the data have been collected, we turn to the task of analyzing them. For the analysis of data
we use statistical packages for social sciences (SPSS). First we make the entries of the questions
in the variable view and give names, labels and values to the questions. Then we do the entry in
the data view. After the data entry we analyze the date using tools such as factor analysis, chi-
square and cross tabulation frequency distributions.
22. 22
Analysis and Findings
The demographic profile of the respondents is shown in Table 1
Table 1 Demographic Profile
Gender Frequency Occupation Frequency
Male 62 Student 43
Female 38 Private Sector Employee 21
Age Frequency Self Employed (Business) 18
18-24 years 42 Government Employee/
Public Sector
15
25-34 years 33 Others 3
35-44 years 9 Monthly Income Frequency
More than 45 years 16 Less than 10,000 34
Education Frequency 10,000-25,000 27
10th 5 25,001-50,000 29
12th 4 More than 50,000 10
Graduation 45
Post-Graduation 46
To determine and define the factors influencing the purchase decision of automobiles we
conducted factor analysis the results of the factor analysis run on different attributes of
automobiles is shown in Table 2
Table 2 Factor Analysis
KMO and Bartlett's Test
Kaiser-Meyer-Olkin Measure of Sampling Adequacy. .640
Bartlett's Test of Sphericity Approx. Chi-Square 458.255
df 171
Sig. .000
23. 23
In order to address the objective of identifying factors that attract customers, the data was
analyzed with principal component analysis (PCA) with orthogonal rotation (varimax). The
overall KMO statistic for the study was 0.640 which indicated that the sample size was adequate
for proceeding with PCA. As our KMO and Barlett’s test value is above 0.5 so it is appropriate
to have factors determined.
Statement Factor
loading
Factor
loading
Factor
loading
Factor
loading
Factor
loading
Factor
loading
1 2 3 4 5 6
Innovative Technology .881
Suspension .809
Engine capacity(horse
power)
.768
Front/Rear Brake
(Disc/Drum)
.743
Safety Features .705
After Sales Service .730
Showroom Accessibility .506
Promotional Offers .822
Brand Ambassador .760
Brand Image / Value .784
Interior Design and Space .811
Exterior Design .780
Model variants in price
range
.674
Ex Show room Price .754
Resale Value .665
Sturdiness/durability .751
Purpose of Use .649
Fuel Efficiency .754
In order to determine the reliability of factors we calculated the Cronbrach’s Alpha Value of all
the factors determined and the value of each factor is shown in the table below. All the value is
above 0.5 so all the factors determined are reliable.
24. 24
Factor Cronbrach’s Alpha Value No. of Items
Technology Innovation .621 5
Convenience .576 2
Promotion .629 3
Utility .605 2
Cost .545 3
Design .625 3
Six factors determined. To check the reliability of factors a reliability test is run. The Cronbach's
Alpha value for all six factors determined is more than 0.5 meaning all the factors are reliable.
The factors determined are as follows.
Definition of Factors
1. Technology Innovation
This factor can be explained as the new advancements and innovations in an automobile
in terms of attributes such as engine capacity, suspension, braking and other safety
features. This factor influences purchase decision as consumers have a liking towards
new things.
2. Convenience
This factor can be explained as ease to the consumer of automobile in terms of
accessibility of showrooms near their residence and availability of after sales services for
the purchase they have made. This convenience to consumer may affect them to choose a
brand as consumer prefer brands which has its showrooms and service centers near their
place of residence.
3. Promotion
This may be understood as the efforts made by automobile manufacturers to increase
their sales volumes. This includes variables such as brand ambassadors, promotional
offers such as gifts, discounts etc. and image created by companies. This influences the
purchase decision as consumers are attracted to the promotional efforts made by the
company.
4. Design
25. 25
This factor refers to the overall appearance of the product. It includes interior and exterior
designing of the automobile. As automobile is a very high involvement and socially
visible product it’s designing may be considered by the consumers as important to choose
a particular brand.
5. Cost
This factor refers to the expenditure to be made by to acquire an automobile and the
return he could make out of it in monetary terms. This includes ex showroom price of the
vehicle and the resale value. Consumer considers his monetary cost before making a
purchase. As vehicles are expensive goods cost is an important factor influencing the
purchase decision.
6. Utility
This factor may be defined as the features of an automobile which are related to the usage
of the individual. It includes variables such as sturdiness, purpose of use and fuel
efficiency. If a consumer wants a vehicle for daily commute he would look for high fuel
efficiency. Thus it will affect the purchase decision.
Factors affecting consumer awareness about automobile include various sources of information
and media such as print media, television advertisement, friends and relatives, Expert review and
blogs etc. To study the relationship with demographic variables results are shown below.
Relationship between Sources of Knowledge of Launch of New Model of Cars and
Education
Table 3 Relationship between Sources of Knowledge of Launch of New Model of Cars and
Education
Relationship between
Print Advertisement
and Education
Yes No Relationship between
Friends and
Relatives and
Education
Yes No
10th 5 0 10th 4 1
12th 1 3 12th 3 1
Graduation 28 17 Graduation 28 17
Post Graduation 27 19 Post Graduation 30 16
26. 26
Relationship between
Television
Advertisement and
Education
Yes No Relationship between
Special Ad
Campaigns and
Education
Yes No
10th 1 4 10th 5 0
12th 2 2 12th 0 4
Graduation 32 13 Graduation 18 27
Post Graduation 37 9 Post Graduation 13 33
Relationship between
Showroom and
Education
Yes No Relationship between
Expert
Reviews/Blogs and
Education
Yes No
10th 3 2 10th 2 3
12th 2 2 12th 3 1
Graduation 16 29 Graduation 12 33
Post Graduation 15 31 Post Graduation 14 32
From the above data we can interpret that the respondents of different education level are aware
about the printed advertisements and television advertisements of car. From the above data we
can also interpret that many of the respondents are not aware about the launch of car from the
showrooms but the awareness of respondents with education level of High school is more than
the total number of respondents of High school. From the above data we can also interpret that
number of respondents of all education levels, who get the information about the new launch of
car from their friends and relatives are high. From the above data we can also interpret that
number of respondents is high who do not aware about the new launch of new Car from special
Ad campaigns/Outdoor ads but the number of respondents are high who have education level of
High school and get aware from special ads and campaign. From the above data we can also
interpret that there is lack of awareness about the new launch of Car from expert reviews and
blogs among the respondents of education level from High school to post graduation except the
respondents of Intermediate who are aware about that in comparison to total number of
respondents with education level of Intermediate.
Relationship between Sources of Knowledge of Launch of New Model of Two Wheeler and
Education
27. 27
Table 4 Relationship between Sources of Knowledge of Launch of New Model of Two Wheeler
and Education
Relationship between
Print Advertisement
and Education
Yes No Relationship between
Friends and
Relatives and
Education
Yes No
10th 4 1 10th 3 2
12th 4 0 12th 3 1
Graduation 30 15 Graduation 33 12
Post Graduation 30 16 Post Graduation 30 16
Relationship between
Television
Advertisement and
Education
Yes No Relationship between
Special Ad
Campaigns and
Education
Yes No
10th 5 0 10th 0 5
12th 3 1 12th 0 4
Graduation 34 11 Graduation 14 31
Post Graduation 29 17 Post Graduation 11 35
Relationship between
Showroom and
Education
Yes No Relationship between
Expert
Reviews/Blogs and
Education
Yes No
10th 2 3 10th 2 3
12th 4 0 12th 0 4
Graduation 14 31 Graduation 16 29
Post Graduation 14 32 Post Graduation 11 35
From the above data we can interpret that the number of respondents of all education level are
high who are aware about the new launch of a two wheeler from print advertisement. From the
above data we can also interpret that the number of respondents of all education level are high
who get the information of launch of a two wheeler from television. From the above data we can
also interpret that the number of respondents of all education level are low who can get the
information of new launch of two-wheeler from showrooms except the respondents who has
education level of Intermediate who are much aware about it. From the above data we can also
interpret that the number of respondents are high of all education level that get aware about the
launch of new two-wheeler from friends or relatives. From the above data we can also interpret
that awareness about new launch of two-wheeler from special ads and campaign are low among
the respondents of all educational level. From the above data we can also interpret that there is
less awareness about the launch of new two-wheeler from the expert reviews and blogs among
the respondents of all education level.
28. 28
Relationship between Sources of Knowledge of Technological Innovation in Cars and
Education
Table 5 Relationship between Sources of Knowledge of Technological Innovation in Cars and
Education
Relationship between
Print Advertisement
and Education
Yes No Relationship between
Friends and
Relatives and
Education
Yes No
10th 4 1 10th 5 0
12th 4 0 12th 1 3
Graduation 35 10 Graduation 22 23
Post Graduation 31 15 Post Graduation 27 19
Relationship between
Television
Advertisement and
Education
Yes No Relationship between
Special Ad
Campaigns and
Education
Yes No
10th 3 2 10th 0 5
12th 3 1 12th 1 3
Graduation 34 11 Graduation 12 33
Post Graduation 39 7 Post Graduation 13 33
Relationship between
Showroom and
Education
Yes No Relationship between
Expert
Reviews/Blogs and
Education
Yes No
10th 3 2 10th 1 4
12th 3 1 12th 1 3
Graduation 14 31 Graduation 14 31
Post Graduation 10 36 Post Graduation 17 29
From the above data we can interpret there is much awareness about the new technology of car
from print advertisement among the respondents of all education level. From the above data we
can also interpret that there is awareness among the respondents about the launch of new
technology of car from television advertisement of all education level. From the above data we
can also interpret that awareness about the launch of new technological innovation in car from
showroom is low among the respondents of all education level. From the above data we can also
interpret that the awareness about the launch of new technological innovation in car from friends
and relatives is high among the respondents who has education level of high school and
respondents of education level of High school but awareness is slight low among the respondents
29. 29
of education level of Intermediate and respondents of education level of graduation. From the
above data we can also interpret that awareness about the launch of new technological innovation
in car from special ads and campaign is low among the respondents of all education level. From
the above data we can also interpret that the awareness from expert reviews and blogs about the
launch of new technological innovation in car is low among the respondents of all education
level.
Relationship between Sources of Knowledge of Technological Innovation in Two Wheeler
and Education
Table 6 Relationship between Sources of Knowledge of Technological Innovation in Two
Wheeler and Education
Relationship between
Print Advertisement
and Education
Yes No Relationship between
Friends and
Relatives and
Education
Yes No
10th 2 3 10th 2 3
12th 1 3 12th 2 2
Graduation 29 16 Graduation 30 15
Post Graduation 35 11 Post Graduation 32 14
Relationship between
Television
Advertisement and
Education
Yes No Relationship between
Special Ad
Campaigns and
Education
Yes No
10th 1 4 10th 3 2
12th 3 1 12th 0 4
Graduation 37 8 Graduation 12 33
Post Graduation 35 11 Post Graduation 9 37
Relationship between
Showroom and
Education
Yes No Relationship between
Expert
Reviews/Blogs and
Education
Yes No
10th 2 3 10th 2 3
12th 3 1 12th 3 1
Graduation 13 32 Graduation 14 31
Post Graduation 15 31 Post Graduation 14 32
From the above data we can interpret that awareness from print advertisement about the new
launch of technological innovation in a two wheeler is high among the respondents of education
30. 30
level of graduation and post -graduation but low in the respondents of education level of high
school and intermediate. From the above data we can also interpret that awareness about the
launch of new technological innovation in a two wheeler from television advertisement is high
among the respondents of education level of graduation and post-graduation and Intermediate
whereas low in the respondents of education level of high school. From the above data we can
also interpret that awareness about the new technological innovation in two-wheeler from
showrooms is low among the respondents of education level of high-school, graduation and post-
graduation whereas high in respondent of education level of intermediate. From the above data
we can also interpret that awareness about the launch of technological innovation in two-wheeler
among the respondent from the friends and relatives is high among respondent of education level
from intermediate to post-graduation into their respective sector whereas low among the
respondents of education level of high-school. From the above data we can also interpret that
awareness about new launch of technological; innovation in two-wheeler from special ads is low
among the respondents of education level from intermediate to post-graduation whereas high
among the respondents of education level of high-school. From the above data we can also
interpret that awareness about launch of new technological innovation in two-wheelers is low
among the respondents of education level of high-school, graduation, post-graduation whereas
high among the respondents of education level of intermediate.
Relationship between Sources of Knowledge of Launch of New Model of Cars and Age
Table 7 Relationship between Sources of Knowledge of Launch of New Model of Cars and Age
Relationship between
Print Advertisement
and Age
Yes No Relationship between
Friends and
Relatives and Age
Yes No
18-24 years 17 25 18-24 years 24 18
25-34 years 28 5 25-34 years 29 4
35-44 years 7 2 35-44 years 6 3
45+ years 9 7 45+ years 6 10
Relationship between
Television
Advertisement and Age
Yes No Relationship between
Special Ad
Campaigns and Age
Yes No
18-24 years 30 12 18-24 years 20 22
25-34 years 21 12 25-34 years 10 23
35-44 years 7 2 35-44 years 3 6
45+ years 14 2 45+ years 3 13
31. 31
Relationship between
Showroom and Age
Yes No Relationship between
Expert
Reviews/Blogs and
Age
Yes No
18-24 years 17 25 18-24 years 16 26
25-34 years 8 25 25-34 years 9 24
35-44 years 4 5 35-44 years 2 7
45+ years 7 9 45+ years 4 12
This data indicates that majority of people that get information about launch of new model in
automobiles from print advertisement lie under the age group of 28-34. This data also indicates
that majority of people that get information about launch of new model in automobile from
television advertisement about automobile lie under the age group of 18-24.This data also
indicates that majority of people that get information about launch of new model in automobile
from showroom lie under the age group of 18-24.This data also indicates that majority of
people that get information about launch of new model in automobile from friends or relatives lie
under the age group of 25-34.This data also indicates that majority of people that get information
about launch of new model in automobile from special ad-campaigns lie under the age group of
18-24.This data also indicates that majority of people that get information about launch of new
model in automobile from expert reviews/blogs lie under the age group of 18-24.
Relationship between Sources of Knowledge of Launch of New Model of Two Wheeler and
Age
Table8 Relationship between Sources of Knowledge of Launch of New Model of Two Wheeler
and Age
Relationship between
Print Advertisement
and Age
Yes No Relationship between
Friends and
Relatives and Age
Yes No
18-24 years 26 16 18-24 years 30 12
25-34 years 25 8 25-34 years 26 7
35-44 years 8 1 35-44 years 6 3
45+ years 9 7 45+ years 7 9
32. 32
Relationship between
Television
Advertisement and Age
Yes No Relationship between
Special Ad
Campaigns and Age
Yes No
18-24 years 28 14 18-24 years 12 30
25-34 years 25 8 25-34 years 7 26
35-44 years 7 2 35-44 years 1 8
45+ years 11 5 45+ years 5 11
Relationship between
Showroom and Age Yes No
Relationship between
Expert
Reviews/Blogs and
Age
Yes No
18-24 years 15 27 18-24 years 15 27
25-34 years 9 24 25-34 years 6 27
35-44 years 3 6 35-44 years 4 5
45+ years 7 9 45+ years 4 12
This data indicates that majority of people that get information about launch of new model of a
two wheeler from print advertisement lie under the age group of 18-24.This data also indicates
that majority of people that get information about launch of new model of a two wheeler from
television advertisement the age group of 25-34.This data also indicates that majority of people
that get information about launch of a new model of a two wheeler from showroom lie under the
age group of 25-34.This data also indicates that majority of people that get information about
launch of new model of a two wheeler from friends or relatives lie under the age group of 18-
24.This data also indicates that majority of people that get information about launch of new
model in two wheeler from special ad campaigns/outdoor add lie under the age group of 18-24.
This data also indicates that majority of people that get information about launch of new model
of a two wheeler from expert/review blogs lie under the age group of 18-24.
Relationship between Sources of Knowledge of Launch of Technological Innovation of
Cars and Age
Table 9 Relationship between Sources of Knowledge of Launch of Technological Innovation of
Cars and Age
Relationship between
Print Advertisement
and Age
Yes No Relationship between
Friends and
Relatives and Age
Yes No
18-24 years 29 13 18-24 years 18 24
25-34 years 30 3 25-34 years 25 8
35-44 years 6 3 35-44 years 7 2
45+ years 9 7 45+ years 5 11
33. 33
Relationship between
Television
Advertisement and Age
Yes No Relationship between
Special Ad
Campaigns and Age
Yes No
18-24 years 32 10 18-24 years 14 28
25-34 years 26 7 25-34 years 7 26
35-44 years 8 1 35-44 years 1 8
45+ years 13 3 45+ years 4 12
Relationship between
Showroom and Age
Yes No Relationship between
Expert
Reviews/Blogs and
Age
Yes No
18-24 years 12 30 18-24 years 21 21
25-34 years 7 26 25-34 years 5 28
35-44 years 4 5 35-44 years 2 7
45+ years 7 9 45+ years 5 11
This data indicates that majority of people that get information about launch of a technological
innovation in car from print advertisement lie under the age group of 25-34.This data also
indicates that majority of people that get information about launch of a technological innovation
in car from television advertisement lie under the age group of 18-24.This data also indicates that
majority of people that get information about launch of a technological innovation in car from
showroom lie under the age group of 18-24.This data also indicates that majority of people that
get information about launch of a technological innovation in car from friends or relatives lie
under the age group of 25-34.This data also indicates that majority of people that get information
about launch of a technological innovation in car from friends or relatives lie under the age group
of 18-24.This data also indicates that majority of people that get information about launch of a
technological innovation in car from expert review and blogs lie under the age group of 18-24.
Relationship between Sources of Knowledge of Launch of Technological Innovation of Two
Wheeler and Age
Table 10 Relationship between Sources of Knowledge of Launch of Technological Innovation of
Two Wheeler and Age
34. 34
Relationship between
Print Advertisement
and Age
Yes No Relationship between
Friends and
Relatives and Age
Yes No
18-24 years 26 16 18-24 years 31 11
25-34 years 26 7 25-34 years 21 12
35-44 years 7 2 35-44 years 5 4
45+ years 8 8 45+ years 9 7
Relationship between
Television
Advertisement and Age
Yes No Relationship between
Special Ad
Campaigns and Age
Yes No
18-24 years 37 5 18-24 years 7 35
25-34 years 19 14 25-34 years 10 23
35-44 years 9 0 35-44 years 3 6
45+ years 11 5 45+ years 4 12
Relationship between
Showroom and Age
Yes No Relationship between
Expert
Reviews/Blogs and
Age
Yes No
18-24 years 15 27 18-24 years 16 26
25-34 years 12 21 25-34 years 8 25
35-44 years 2 7 35-44 years 4 5
45+ years 4 12 45+ years 5 11
This data indicates that majority of people that get information about launch of a technological
innovation in two wheelers from print advertisement lie under the age group of 25-34. This data
also indicates that majority of people that get information about launch of a technological
innovation in two wheelers from television advertisement lie under the age group of 25-34. This
data also indicates that majority of people that get information about launch of a technological
innovation in two wheelers from showroom lie under the age group of 18-24. This data also
indicates that majority of people that get information about launch of a technological innovation
in two wheelers from friends or relatives lie under the age group of 18-24. This data also
indicates that majority of people that get information about launch of a technological innovation
in two wheelers from friends or relatives lie under the age group of 25-34. This data also
indicates that majority of people that get information about launch of a technological innovation
in two wheelers from expert review/blogs lie under the age group of 18-24.
35. 35
Factors Influencing Brand Opinion
The factors which influence consumer perception of a particular brand include personal
experience, friends/social group experience, family opinion, social media reviews/blogs, brand
image, country of origin, celebrity endorsement etc. The factors considered important by the
respondents and their frequencies is shown in Table 11
Table 11 Factors Influencing Brand Opinion
Personal Experience Frequency Brand Image Frequency
Yes 57 Yes 40
No 43 No 60
Friends/Social Group
Experience
Frequency Country of Origin Frequency
Yes 52 Yes 10
No 48 No 90
Family Opinion Frequency Celebrity Endorsement Frequency
Yes 56 Yes 12
No 44 No 88
Social Media Review/Blogs Frequency
Yes 17
No 83
From the table it is clear that personal experience, friends/social group experience, family
opinion, brand image are important factors influencing brand opinion by the majority of the
respondents whereas social media reviews/blogs, country of origin, celebrity endorsement are
not considered a factor influencing brand opinion by the majority of respondents.
Relationship between Factor Influencing Opinion of a Brand and Gender
36. 36
Relationship between Personal Experience and Gender
Fig. 1 Relationship between Personal Experience and Gender
Majority of both males and females consider personal experience as an important factor
influencing opinion of a brand but more percentage of femalesconsider it as important when
compared to males.
37. 37
Relationship between Friends/Social Group Experience and Gender
Fig. 2 Relationship between Friends/Social Group Experience and Gender
Majority of both males and females consider friends/social group experience as an important
factor influencing opinion of a brand but more percentage of males do not consider it as
important when compared to females.
38. 38
Relationship between Family Opinion and Gender
Fig. 3 Relationship between Family Opinion and Gender
More number of males out of total males do not consider family opinion as an important factor
whereas more percentage of females consider it as important.
39. 39
Relationship between Social Media Review/Blogs and Gender
Fig. 4 Relationship between Social Media Review/Blogs and Gender
Majority of both males and females do not consider social media reviews/blogs as an important
factor influencing opinion of a brand.
40. 40
Relationship between Brand Image and Gender
Fig. 5 Relationship between Brand Image and Gender
Majority of both males and females do not consider brand image as an important factor
influencing opinion of a brand.
41. 41
Relationship between Country of Origin and Gender
Fig. 6 Relationship between Country of Origin and Gender
Both males and females do not consider country of originas an important factor influencing
opinion of a brand.
42. 42
Relationship between Celebrity Endorsement and Gender
Fig. 7 Relationship between Celebrity Endorsement and Gender
Both males and females do not consider celebrity endorsementas an important factor influencing
opinion of a brand.
43. 43
Mode of payment is also an important factor influencing the purchase decision. It is observed
that majority of respondents opt for installments for purchase of cars and one-time payment for
two wheelers. Monthly income may also have an impact selection on payment mode.
Relationship between Monthly Income and Payment Option
In Case of Cars
Fig. 8 Relationship between Monthly Income and Payment Option In Case of Cars
From the above bar chart we can interpret that the number of respondents of all income groups
prefers to buy car on installment.
44. 44
In Case of Two Wheelers
Fig. 9 Relationship between Monthly Income and Payment Option In Case of Two Wheeler
From the above bar chart we can interpret that respondents of all income group prefer to buy
two-wheeler on one -time payment.
45. 45
The brand preference is also an important factor influencing purchase decision. The most
common brands in automobile industry in India are Maruti Suzuki, Toyota, Hyundai,
Volkswagen, Mahindra, Tata etc. in case of cars and LML, Bajaj, Honda, TVS, Kinetic, Hero
etc. in case of two wheelers.
The brand of owned cars and preference for brand is shown in Table 12
Table 12 Brand Preference in Cars
Brand Owned Frequency Brand Intended to Buy Frequency
Maruti Suzuki 14 Maruti Suzuki 16
Toyota 7 Toyota 24
Hyundai 14 Hyundai 9
Volkswagen 9 Volkswagen 25
Mahindra 4 Mahindra 9
Tata 12 Tata 9
Others 0 Others 7
Not Owned 40
There is a shift in preference of brands the person who own cars were having Maruti Suzuki and
Hyundai but the preference has changed to Volkswagen and Toyota.
The brand of owned two wheelers and preference for brand is shown in Table 13
46. 46
Table 13 Brand Preference in Two Wheeler
Brand Owned Frequency Brand Intended to Buy Frequency
LML 9 LML 0
Bajaj 20 Bajaj 24
Honda 27 Honda 37
TVS 18 TVS 8
Kinetic 2 Kinetic 5
Hero 15 Hero 17
Other 1 Other 8
Not Owned 8
The most preferred brands are Bajaj and Honda by both who own and who intent to buy. There is
a decrease in preference of Hero.
Relationship of Demographic Factors on Change Behavior
Cases
Valid Missing Total
N Percent N Percent N Percent
Gender * New Technology 100 100.0% 0 .0% 100 100.0%
Gender * Brand Status 100 100.0% 0 .0% 100 100.0%
Gender * Increase in purchasing
power
100 100.0% 0 .0% 100 100.0%
Gender * Trend Change 100 100.0% 0 .0% 100 100.0%
Gender * Higher Mileage 100 100.0% 0 .0% 100 100.0%
Gender * Type of engine (
petrol, diesel, LPG, hybrid)
100 100.0% 0 .0% 100 100.0%
47. 47
Gender * New Technology
Table 14 Gender * New Technology
New Technology
Total
Very Important Important Neutral Unimportant
Gender Male Count 36 17 9 0 62
Expected Count 35.3 19.8 6.2 .6 62.0
Female Count 21 15 1 1 38
Expected Count 21.7 12.2 3.8 .4 38.0
Total Count 57 32 10 1 100
Expected Count 57.0 32.0 10.0 1.0 100.0
Chi-Square Tests
Value df
Asymp. Sig. (2-
sided)
Pearson Chi-Square 6.062a 3 .109
Likelihood Ratio 7.050 3 .070
Linear-by-Linear Association .067 1 .796
N of Valid Cases 100
a. 3 cells (37.5%) have expected count less than 5. The minimum expected
count is .38.
Independent Variable - Gender
Dependent Variable – New Technology as one of the influencing factor for change / shift to new
brand.
Since, Significance of critical value calculated is <0.5, Alternate Hypothesis (H1) is accepted.
So, It can be stated that there is association between Gender and New Technology as one of the
influencing factor for change / shift to new brand.
48. 48
Fig. 10 Gender * New Technology
Gender * Brand Status
Table 15 Gender * Brand Status
Brand Status
Total
Very Important Important Neutral
Gender Male Count 28 28 6 62
Expected Count 28.5 28.5 5.0 62.0
Female Count 18 18 2 38
Expected Count 17.5 17.5 3.0 38.0
Total Count 46 46 8 100
Expected Count 46.0 46.0 8.0 100.0
49. 49
Chi-Square Tests
Value df
Asymp. Sig. (2-
sided)
Pearson Chi-Square .624a 2 .732
Likelihood Ratio .659 2 .719
Linear-by-Linear Association .258 1 .611
N of Valid Cases 100
a. 2 cells (33.3%) have expected count less than 5. The minimum expected
count is 3.04.
Independent Variable - Gender
Dependent Variable – Brand Status as one of the influencing factor for change / shift to new
brand.
Since, Significance of critical value calculated is > 0.5, Null Hypothesis (Ho) is accepted.
So, It can be stated that there is no association between Gender and Brand Status as one of the
influencing factor for change / shift to new brand.
50. 50
Fig. 11 Gender * Brand Status
Gender * Increase in purchasing power
Table 16 Gender * Increase in purchasing power
Increase in purchasing power
Total
Very Important Important Neutral Unimportant
Very
Unimpor
tant
Gender Male Count 21 29 10 1 1 62
Expected
Count
24.2 27.9 8.7 .6 .6 62.0
Femal
e
Count 18 16 4 0 0 38
Expected
Count
14.8 17.1 5.3 .4 .4 38.0
51. 51
Total Count 39 45 14 1 1 100
Expected
Count
39.0 45.0 14.0 1.0 1.0 100.0
Chi-Square Tests
Value df
Asymp. Sig. (2-
sided)
Pearson Chi-Square 2.969a 4 .563
Likelihood Ratio 3.653 4 .455
Linear-by-Linear Association 2.776 1 .096
N of Valid Cases 100
a. 4 cells (40.0%) have expected count less than 5. The minimum expected
count is .38.
Independent Variable - Gender
Dependent Variable – Increase in purchasing power as one of the influencing factor for change /
shift to new brand.
Since, Significance of critical value calculated is <0.5, Alternate Hypothesis (H1) is accepted.
So, It can be stated that there is association between Gender and Increase in purchasing power as
one of the influencing factor for change / shift to new brand.
52. 52
Fig. 12 Gender * Increase in purchasing power
Gender * Trend Change
Table 17 Gender * Trend Change
Trend Change
Total
Very Important Important Neutral Unimportant
Very
Unimporta
nt
Gender Male Count 23 29 5 3 2 62
Expec
ted
Count
22.3 29.8 5.6 3.1 1.2 62.0
Female Count 13 19 4 2 0 38
Expec
ted
Count
13.7 18.2 3.4 1.9 .8 38.0
53. 53
Independent Variable -
Gender
Dependent Variable –
Trend Change as one of
the influencing factor for
change / shift to new brand.
Since, Significance of critical value calculated is > 0.5, Null Hypothesis (Ho) is accepted.
So, It can be stated that there is no association between Gender and Trend change as one of the
influencing factor for change / shift to new brand.
Fig. 13 Gender * Trend Change
Chi-Square Tests
Value df
Asymp. Sig. (2-
sided)
Pearson Chi-Square 1.499a 4 .827
Likelihood Ratio 2.182 4 .702
Linear-by-Linear Association .035 1 .853
N of Valid Cases 100
a. 5 cells (50.0%) have expected count less than 5. The minimum expected
count is .76.
54. 54
Gender * Higher Mileage
Table 18 Gender * Higher Mileage
Higher Mileage
Total
Very Important Important Neutral Unimportant
Very
Unimportant
Gender Male Count 36 18 5 2 1 62
Expect
ed
Count
34.7 20.5 4.3 1.2 1.2 62.0
Female Count 20 15 2 0 1 38
Expect
ed
Count
21.3 12.5 2.7 .8 .8 38.0
Independent Variable - Gender
Dependent Variable – High mileage as one of the influencing factor for change / shift to new
brand.
Since, Significance of critical value calculated is > 0.5, Null Hypothesis (Ho) is accepted.
So, It can be stated that there is no association between Gender and High mileage as one of the
influencing factor for change / shift to new brand.
Chi-Square Tests
Value df
Asymp. Sig. (2-
sided)
Pearson Chi-Square 2.515a 4 .642
Likelihood Ratio 3.193 4 .526
Linear-by-Linear Association .002 1 .966
N of Valid Cases 100
a. 6 cells (60.0%) have expected count less than 5. The minimum expected
count is .76.
55. 55
Fig. 14 Gender * Higher Mileage
Gender * Type of engine (petrol, diesel, LPG, hybrid)
56. 56
Table 19 Gender * Type of engine (petrol, diesel, LPG, hybrid)
Type of engine ( petrol, diesel, LPG, hybrid)
Total
Very Important Important Neutral Unimportant
Gender Male Count 32 18 10 2 62
Expected Count 32.2 19.8 8.7 1.2 62.0
Female Count 20 14 4 0 38
Expected Count 19.8 12.2 5.3 .8 38.0
Total Count 52 32 14 2 100
Expected Count 52.0 32.0 14.0 2.0 100.0
Chi-Square Tests
Value df
Asymp. Sig. (2-
sided)
Pearson Chi-Square 2.208a 3 .530
Likelihood Ratio 2.908 3 .406
Linear-by-Linear Association .638 1 .424
N of Valid Cases 100
a. 2 cells (25.0%) have expected count less than 5. The minimum expected
count is .76.
57. 57
Independent Variable - Gender
Dependent Variable – Type of Engine (Petrol, Diesel, LPG, Hybrid) as one of the influencing
factor for change / shift to new brand.
Since, Significance of critical value calculated is <0.5, Alternate Hypothesis (H1) is accepted.
So, It can be stated that there is association between Gender and Type of Engine (Petrol, Diesel,
LPG, Hybrid) as one of the influencing factor for change / shift to new brand.
Fig. 14 Gender * Type of engine (petrol, diesel, LPG, hybrid)
58. 58
Occupation * New Technology
Table 20 Occupation * New Technology
New Technology
Total
Very
Important Important Neutral Unimportant
Occupation Student Count 21 17 5 0 43
Expected Count 24.5 13.8 4.3 .4 43.0
Private Sector
Employee
Count 14 4 2 1 21
Expected Count 12.0 6.7 2.1 .2 21.0
Self Employed
(business)
Count 12 6 0 0 18
Expected Count 10.3 5.8 1.8 .2 18.0
Govt. Employee /
Public Sector
Count 9 4 2 0 15
Expected Count 8.6 4.8 1.5 .2 15.0
Others Count 1 1 1 0 3
Expected Count 1.7 1.0 .3 .0 3.0
Total Count 57 32 10 1 100
Expected Count 57.0 32.0 10.0 1.0 100.0
Case Processing Summary
Cases
Valid Missing Total
N Percent N Percent N Percent
Occupation * New Technology 100 100.0% 0 .0% 100 100.0%
Occupation * Brand Status 100 100.0% 0 .0% 100 100.0%
Occupation * Increase in
purchasing power
100 100.0% 0 .0% 100 100.0%
Occupation * Trend Change 100 100.0% 0 .0% 100 100.0%
Occupation * Higher Mileage 100 100.0% 0 .0% 100 100.0%
Occupation * Type of engine (
petrol, diesel, LPG, hybrid)
100 100.0% 0 .0% 100 100.0%
59. 59
Chi-Square Tests
Value df
Asymp. Sig. (2-
sided)
Pearson Chi-Square 10.950a 12 .533
Likelihood Ratio 11.650 12 .474
Linear-by-Linear Association .183 1 .669
N of Valid Cases 100
a. 13 cells (65.0%) have expected count less than 5. The minimum
expected count is .03.
Independent Variable – Occupation
Dependent Variable – New Technology as one of the influencing factor for change / shift to new
brand.
Since, Significance of critical value calculated is <0.05, Alternate Hypothesis (H1) is accepted.
So, It can be stated that there is association between occupation and New Technology as one of
the influencing factor for change / shift to new brand.
Fig. 16 Occupation * New Technology
60. 60
Occupation * Brand Status
Table 21 Occupation * Brand Status
Brand Status
Total
Very Important Important Neutral
Occupation Student Count 18 20 5 43
Expected Count 19.8 19.8 3.4 43.0
Private Sector
Employee
Count 10 11 0 21
Expected Count 9.7 9.7 1.7 21.0
Self Employed
(business)
Count 10 7 1 18
Expected Count 8.3 8.3 1.4 18.0
Govt. Employee /
Public Sector
Count 7 6 2 15
Expected Count 6.9 6.9 1.2 15.0
Others Count 1 2 0 3
Expected Count 1.4 1.4 .2 3.0
Total Count 46 46 8 100
Expected Count 46.0 46.0 8.0 100.0
Chi-Square Tests
Value df
Asymp. Sig. (2-
sided)
Pearson Chi-Square 4.713a 8 .788
Likelihood Ratio 6.439 8 .598
Linear-by-Linear Association .232 1 .630
N of Valid Cases 100
a. 7 cells (46.7%) have expected count less than 5. The minimum
expected count is .24.
Independent Variable – Occupation
Dependent Variable – Brand status as one of the influencing factor for change / shift to new
brand.
Since, Significance of critical value calculated is > 0.5, Null Hypothesis (Ho) is accepted.
So, It can be stated that there is no association between occupation and Brand status as one of the
influencing factor for change / shift to new brand.
62. 62
Occupation * Increase in purchasing power
Table 22 Occupation * Increase in purchasing power
Increase in purchasing power
Total
Very
Important Important Neutral
Unimport
ant
Very
Unimporta
nt
Occupation Student Count 16 19 8 0 0 43
Expected
Count
16.8 19.4 6.0 .4 .4 43.0
Private Sector
Employee
Count 9 9 3 0 0 21
Expected
Count
8.2 9.4 2.9 .2 .2 21.0
Self Employed
(business)
Count 5 9 2 1 1 18
Expected
Count
7.0 8.1 2.5 .2 .2 18.0
Govt. Employee /
Public Sector
Count 8 6 1 0 0 15
Expected
Count
5.8 6.8 2.1 .2 .2 15.0
Others Count 1 2 0 0 0 3
Expected
Count
1.2 1.4 .4 .0 .0 3.0
Total Count 39 45 14 1 1 100
Expected
Count
39.0 45.0 14.0 1.0 1.0 100.0
63. 63
Independent Variable –
Occupation
Dependent Variable –
Increase in purchasing
power as one of the
influencing factor for change / shift to new brand.
Since, Significance of critical value calculated is > 0.5, Null Hypothesis (Ho) is accepted.
So, It can be stated that there is no association between occupation and Increase in purchasing
power as one of the influencing factor for change / shift to new brand.
Fig. 18 Occupation * Increase in purchasing power
Chi-Square Tests
Value df
Asymp. Sig. (2-
sided)
Pearson Chi-Square 12.903a 16 .680
Likelihood Ratio 11.099 16 .803
Linear-by-Linear Association .193 1 .661
N of Valid Cases 100
a. 16 cells (64.0%) have expected count less than 5. The minimum expected
count is .03.
64. 64
Occupation * Trend Change
Table 24 Occupation * Trend Change
Trend Change
Total
Very
Important Important Neutral
Unimport
ant
Very
Unimportant
Occupation Student Count 17 21 3 0 2 43
Expected Count 15.5 20.6 3.9 2.2 .9 43.0
Private Sector
Employee
Count 7 8 3 3 0 21
Expected Count 7.6 10.1 1.9 1.0 .4 21.0
Self
Employed
(business)
Count 5 10 3 0 0 18
Expected Count 6.5 8.6 1.6 .9 .4 18.0
Govt.
Employee /
Public Sector
Count 6 7 0 2 0 15
Expected Count
5.4 7.2 1.4 .8 .3 15.0
Others Count 1 2 0 0 0 3
Expected Count 1.1 1.4 .3 .2 .1 3.0
Total Count 36 48 9 5 2 100
Expected Count 36.0 48.0 9.0 5.0 2.0 100.0
Chi-Square Tests
Value df
Asymp. Sig. (2-
sided)
Pearson Chi-Square 16.673a 16 .407
Likelihood Ratio 20.036 16 .219
Linear-by-Linear Association .002 1 .961
N of Valid Cases 100
a. 17 cells (68.0%) have expected count less than 5. The minimum
expected count is .06.
Independent Variable – Occupation
Dependent Variable – Trend change as one of the influencing factor for change / shift to new
65. 65
brand.
Since, Significance of critical value calculated is <0.5, Alternate Hypothesis (H1) is accepted.
So, It can be stated that there is association between occupation and Trend change as one of the
influencing factor for change / shift to new brand.
Fig.19 Occupation * Trend Change
66. 66
Occupation * Higher Mileage
Table 24 Occupation * Higher Mileage
Higher Mileage
Total
Very
Important Important Neutral
Unimpor
tant
Very
Unimportant
Occupation Student Count 18 20 2 2 1 43
Expected Count 24.1 14.2 3.0 .9 .9 43.0
Private Sector
Employee
Count 14 3 4 0 0 21
Expected Count 11.8 6.9 1.5 .4 .4 21.0
Self Employed
(business)
Count 12 5 1 0 0 18
Expected Count 10.1 5.9 1.3 .4 .4 18.0
Govt.
Employee /
Public Sector
Count 10 5 0 0 0 15
Expected Count
8.4 5.0 1.0 .3 .3 15.0
Others Count 2 0 0 0 1 3
Expected Count 1.7 1.0 .2 .1 .1 3.0
Total Count 56 33 7 2 2 100
Expected Count 56.0 33.0 7.0 2.0 2.0 100.0
Chi-Square Tests
Value df
Asymp. Sig. (2-
sided)
Pearson Chi-Square 32.928a 16 .008
Likelihood Ratio 25.072 16 .069
Linear-by-Linear Association 1.684 1 .194
N of Valid Cases 100
a. 18 cells (72.0%) have expected count less than 5. The minimum
expected count is .06.
Independent Variable – Occupation
Dependent Variable – Higher Mileage as one of the influencing factor for change / shift to new
67. 67
brand.
Since, Significance of critical value calculated is <0.5, Alternate Hypothesis (H1) is accepted.
So, It can be stated that there is association between occupation and Higher Mileage as one of the
influencing factor for change / shift to new brand.
Fig.20 Occupation * Higher Mirage
68. 68
Occupation * Type of engine (petrol, diesel, LPG, hybrid)
Table 25 Occupation * Type of engine (petrol, diesel, LPG, hybrid)
Type of engine ( petrol, diesel, LPG, hybrid)
Total
Very Important Important Neutral Unimportant
Occupation Student Count 15 17 9 2 43
Expected Count 22.4 13.8 6.0 .9 43.0
Private Sector
Employee
Count 15 3 3 0 21
Expected Count 10.9 6.7 2.9 .4 21.0
Self Employed
(business)
Count 8 8 2 0 18
Expected Count 9.4 5.8 2.5 .4 18.0
Govt.
Employee /
Public Sector
Count 12 3 0 0 15
Expected Count
7.8 4.8 2.1 .3 15.0
Others Count 2 1 0 0 3
Expected Count 1.6 1.0 .4 .1 3.0
Total Count 52 32 14 2 100
Expected Count 52.0 32.0 14.0 2.0 100.0
Chi-Square Tests
Value df
Asymp. Sig. (2-
sided)
Pearson Chi-Square 17.655a 12 .127
Likelihood Ratio 21.047 12 .050
Linear-by-Linear Association 9.282 1 .002
N of Valid Cases 100
a. 12 cells (60.0%) have expected count less than 5. The minimum
expected count is .06.
Independent Variable – Occupation
Dependent Variable – Occupation as one of the influencing factor for change / shift to new
brand.
Since, Significance of critical value calculated is <0.5, Alternate Hypothesis (H1) is accepted.
69. 69
So, It can be stated that there is association between Gender and Type of Engine (Petrol, Diesel,
LPG, Hybrid) as one of the influencing factor for change / shift to new brand.
Fig. 21 Occupation * Type of engine (petrol, diesel, LPG, hybrid)
70. 70
Cases
Valid Missing Total
N Percent N Percent N Percent
Monthly Income * In how many
years do you normally change your
car
100 100.0% 0 .0% 100 100.0%
Monthly Income * In how many
years do you normally change your
TW
100 100.0% 0 .0% 100 100.0%
Monthly Income * In how many years do you normally change your car
Table 26 Monthly Income * In how many years do you normally change your car
In how many years do you normally change your
car
Total
<2 years 2-5 years 6-10 years >10 years
Monthly Income <10,000 Count 1 14 12 7 34
Expected Count 1.7 11.2 11.2 9.9 34.0
10,000-
25,000
Count 1 9 8 9 27
Expected Count 1.4 8.9 8.9 7.8 27.0
25,001-
50,000
Count 2 7 10 10 29
Expected Count 1.4 9.6 9.6 8.4 29.0
>50,000 Count 1 3 3 3 10
Expected Count .5 3.3 3.3 2.9 10.0
Total Count 5 33 33 29 100
Expected Count 5.0 33.0 33.0 29.0 100.0
71. 71
Chi-Square Tests
Value df
Asymp. Sig. (2-
sided)
Pearson Chi-Square 3.997a 9 .912
Likelihood Ratio 4.014 9 .910
Linear-by-Linear Association .457 1 .499
N of Valid Cases 100
a. 7 cells (43.8%) have expected count less than 5. The minimum
expected count is .50.
Independent Variable – Monthly income
Dependent Variable – Behavioral impact i.e. how many years one want to change his car.
Since, Significance of critical value calculated is > 0.5, Null Hypothesis (Ho) is accepted.
So, It can be stated that there is no association between Monthly income and Behavioral impact
i.e. how many years one want to change his car.
Fig. 22 Monthly Income * In how many years do you normally change your car
72. 72
Monthly Income * In how many years do you normally change your TW
Table 27 Monthly Income * In how many years do you normally change your TW
In how many years do you normally change your TW
Total
<2 years 2-4 years 5-7 years >7 years
Monthly Income <10,000 Count 0 18 11 5 34
Expected Count 2.7 13.6 11.6 6.1 34.0
10,000-
25,000
Count 5 9 8 5 27
Expected Count 2.2 10.8 9.2 4.9 27.0
25,001-
50,000
Count 3 10 10 6 29
Expected Count 2.3 11.6 9.9 5.2 29.0
>50,000 Count 0 3 5 2 10
Expected Count .8 4.0 3.4 1.8 10.0
Total Count 8 40 34 18 100
Expected Count 8.0 40.0 34.0 18.0 100.0
Chi-Square Tests
Value df
Asymp. Sig. (2-
sided)
Pearson Chi-Square 10.929a 9 .281
Likelihood Ratio 13.250 9 .152
Linear-by-Linear
Association
.584 1 .445
N of Valid Cases 100
a. 8 cells (50.0%) have expected count less than 5. The minimum
expected count is .80.
Independent Variable – Monthly income
Dependent Variable – Behavioral impact i.e. how many years one want to change his two
wheeler.
Since, Significance of critical value calculated is <0.5, Alternate Hypothesis (H1) is accepted.
73. 73
So, It can be stated that there is association between Monthly income and Behavioral impact i.e.
how many years one want to change his Two wheeler.
Fig. 23 Monthly Income * In how many years do you normally change your TW
74. 74
Findings
i. The main factors we came across during the purchase of an automobile are Technological
innovation, Convenience, Promotion, Design, Cost, Utility.
ii. Most of the population usually prefers print advertisement and television as a source of
information but most of the population that lies in the male and female category which
has higher education is aware of expert blogs and reviews.
iii. Promotional offers, celebrity endorsement, gifts are a factor that influences the
purchasing decision of both male and female category.
iv. The purchase decision of automobile is highly affected with the decisions of friends,
family members.
v. The purchase decision of an individual is depend upon the monetary aspects in terms of
sale and resale value of an automobile.
vi. Brand preferences and showroom accessibility are a key factor that influences the
purchase decision.
vii. Apart from durability, sturdiness looks. Fuel efficiency is highly rated above all these
mentioned factors while purchasing an automobile.
viii. Design is also a factor which influences the purchase decision of consumers.
ix. In terms of attributes suspension, braking and safety features are important consideration
while purchase of an automobile.
x. The gender has significant association on decision making for changing the automobile
with the factors like new technology, increase in purchasing power, and type on engine (
petrol, diesel, LPG, CNG, Hybrid) i.e., these variable are depends on gender orientation.
xi. The gender has no significant association on decision making for changing the
automobile with the factors like brand status, trend change, high mileage i.e., these
variable are depends on gender orientation.
xii. The occupation has significant association on decision making for changing the
automobile with the factors like new technology, trend change, high mileage, type on
engine ( petrol, diesel, LPG, CNG, Hybrid) i.e., these variable are depends on occupation
of consumer.
75. 75
xiii. The occupation has significant association on decision making for changing the
automobile with the factors like brand status, increase in purchasing power i.e., these
variable are depends on occupation of consumer.
xiv. The monthly income of individual has high association with their time of usage of two
wheeler.
xv. The monthly income of individual has no association with their time of usage of car.
76. 76
Recommendations
On the basis of our findings we have derive and hence can make certain recommendations which
are relevant for automobile industry in making out there strategies for targeting on consumers
perception, behavior and modes of awareness.
i. By factor analysis it can be recommended that the most aspired attribute is technological
innovation aspect on which company can emphasize while designing a new product then
after that Convenience, Promotion, Design, Cost, Utility are in ranking order.
ii. As most preferred source of awareness among population are print advertisement and
television so most focused media would be this and to target higher educated expert
reviews and blogs.
iii. As Promotional offers, celebrity endorsement, gifts are most influence variables so
companies have to emphasis on it and have to work on other aspects.
iv. The advertisement should be such that it can target all the family member and friends.
v. The durability of products for their sale and resale value of an automobile is important.
vi. Brand preferences and showroom accessibility are key factors which are to be focused as
these are the influences that affect purchase decision.
vii. Fuel efficiency is highly rated factor while purchasing an automobile, so it should be
highly focused.
viii. Designing of the automobile if high rated aspect, so focus on it should be high.
ix. Attributes like suspension, braking and safety features are important consideration while
purchase of an automobile so, these should be highly considered while production.
x. Genders( male and female) have high association with difference in outlook on the
factors like new technology, increase in purchasing power, and type on engine ( petrol,
diesel, LPG, CNG, Hybrid) ,so the different strategies are required to target on these
variables for different genders.
xi. Genders( male and female) have no association with difference in outlook on factors like
brand status, trend change, high mileage ,so a similar strategies are required to target on
these variables for different genders.
77. 77
xii. The occupation have high association with difference in outlook on the factors like new
technology, trend change, high mileage, type on engine ( petrol, diesel, LPG, CNG,
Hybrid) ,so the different strategies are required to target on these variables for different
occupation class.
xiii. The occupation have no association with difference in outlook on the factors like brand
status, increase in purchasing power , so a similar strategies are required to target on
these variables for different occupation class.
xiv. The monthly income of individual has high association with their time of usage of two
wheeler, so the information can extracted that consumers change their two wheeler is
totally based on their purchasing power. So, company has to target their different models
for different income group.
xv. The monthly income of individual has no association with their time of usage of car, So
there is not much possibility of targeting income difference.
78. 78
Conclusion
Henceforth we can conclude on the basis of our findings we have derive and hence can make
certain recommendations which are relevant for automobile industry in making out there
strategies for targeting on consumers perception, behavior and modes of awareness. There are
various aspects which needs improvement under the category of safety features, technological
innovation, Even though the automobile sector has created enough to satisfy the consumers in all
aspects, but there are various promotional aspects as well as offers in terms of discounts, gifts
which the companies need to emphasize upon in order satisfy the need and demand.
79. 79
References
1. Barroso, A, &Llobet, G. (2012).Advertising and consumer awareness of new,
differentiated products. Journal of Marketing Research, 49(6), 773-792.
2. Jha, M., Sirohi, R., Madan, S., &Arora, S. (2011).Impact of Advertisement on Consumer
Buying Behaviour in Two Wheeler Segment. Journal of Marketing &
Communication, 7(1).
3. Cacovean, C. M., &Morar, D. D. (2014). An Empirical Investigation upon the Values
Appreciated by Consumers Regarding the Automotive Industry.MarketingFrom
Information to Decision, (7), 170-184.
4. Malhotra, G., Nandi, A., & Mukherjee, A. (2012).An Empirical Research on Consumer
Behavior towards Small Car Segment in Indian Market. Business Perspectives and
Research, 37-46.
5. Wetzel, J., & Hoffer, G. (1982). Consumer demand for automobiles: A disaggregated
market approach. Journal of Consumer Research, 195-199.
6. Juyal, S. A., & Singh, M. P. (2009).Role of Females in Family Buying Decision-
Making—A Study among Females in Uttrakhand. Vision: The Journal of Business
Perspective, 13(4), 15-23.
7. Nayeem, T., &Casidy, R. (2013). The role of external influences in high involvement
purchase behaviour. Marketing Intelligence & Planning, 31(7), 732-745.
8. Prabhakar, G. P. (2010). When in India do as the… An insight into an Italian automotive
company's experiences in India. Management Decision, 48(6), 1010-1022.
9. Mukherjee, A., Satija, D., Goyal, T. M., Mantrala, M. K., &Zou, S. (2012). Are Indian
consumers brand conscious? Insights for global retailers. Asia Pacific Journal of
Marketing and Logistics, 24(3), 482-499.
10. Kim, J., & Suk Kim, M. (2014).Analysis of automobile repeat-purchase behaviour on
CRM. Industrial Management & Data Systems, 114(7), 994-1006.
11. Monore, K.B. Price and customer perception of value. Reflections and Advances in
Business Marketing and Purchase. 19, p.p. 129-152.
12. Gavan, J., &Morwitz, T. V. G. (1996).The Effect of Measuring Intent on Brand-Level
Purchase Behavior.
80. 80
13. Banerjee, S. (2010). Study on Consumer Buying Behavior During Purchase of a Second
Car. Journal of Marketing & Communication, 6(2).
14. Paramer, L., Dillard, J. The relationship between personality and consumer behavior
pattern within the automobile industry. Global Conference on Business and Finance
Proceedings. 10.
15. Goukens, C., Dewitte, S., &Warlop, L. (2009). Me, myself, and my choices: the influence
of private self-awareness on choice. Journal of Marketing Research, 46(5), 682-692.
16. Hanssens, D. M. (1998). Order forecasts, retail sales, and the marketing mix for
consumer durables. Journal of Forecasting, 17(34), 327-346.
17. Nauhria, Y., Pandey, S., &Kulkarni, M. S. (2011). Competitive priorities for Indian car
manufacturing industry (2011–2020) for global competitiveness.Global Journal of
Flexible Systems Management, 12(3), 9-20.
18. Mc. Donnell, J.S., Defries, L.V., Sheehan, P.J. The demand for new motor vehicles.
Australian Economics Review. 2. p.p. 35-44.
81. 81
Annexure 1
Statistics
Gender Age Occupation Education
Monthly
Income
Own/Intend to
buy Car
Own/Intend to
buy Two
Wheeler
N Valid 100 100 100 100 100 100 100
Missing 0 0 0 0 0 0 0
Mean 1.38 1.99 2.14 3.32 2.15 1.55 1.15
Median 1.00 2.00 2.00 3.00 2.00 2.00 1.00
Mode 1 1 1 4 1 2 1
Statistics
Price Range
of Car in
Consideratio
n
Price Range
of Two
Wheeler in
Consideratio
n
Exterior
Design
Interior
Design and
Space
Safety
Features
Engine
capacity(hor
se power)
Sturdiness/d
urability
N Valid 100 100 100 100 100 100 100
Missing 0 0 0 0 0 0 0
Mean 2.77 2.56 1.56 1.60 1.33 1.46 1.66
Median 3.00 2.00 1.00 1.00 1.00 1.00 2.00
Mode 2 2 1 1 1 1 1
Statistics
Oil tank
capacity
Fuel
Efficiency Suspension
Front/Rear
Brake
(Disc/Drum)
Innovative
Technology
Ex Show
room Price
Model
variants in
price range
N Valid 100 100 100 100 100 100 100
Missing 0 0 0 0 0 0 0
Mean 1.64 1.46 2.09 2.03 2.06 2.19 2.16
Median 1.00 1.00 2.00 2.00 2.00 2.00 2.00
Mode 1 1 2 1 1 2 2
82. 82
Statistics
Television
Advertiseme
nt
Showroo
m
From
Friends or
Relatives
Special Ad
Campaigns/
Outdoor Ads
Expert
Reviews/Blo
gs
Print
Advertiseme
nt
Television
Advertiseme
nt
N Valid 100 100 100 100 100 100 100
Missing 0 0 0 0 0 0 0
Mean 1.29 1.66 1.31 1.75 1.71 1.26 1.21
Median 1.00 2.00 1.00 2.00 2.00 1.00 1.00
Mode 1 2 1 2 2 1 1
Statistics
After Sales
Service
Resale
Value
Brand Image
/ Value
Showroom
Accessibility
Brand
Ambassador
Promotional
Offers
Purpose of
Use
N Valid 100 100 100 100 100 100 100
Missing 0 0 0 0 0 0 0
Mean 1.69 1.92 1.71 2.50 2.77 2.68 1.88
Median 2.00 2.00 1.50 2.00 3.00 3.00 2.00
Mode 1 1 1 1 3 3 1
Statistics
Print
Advertiseme
nt
Television
Advertiseme
nt Showroom
From
Friends or
Relatives
Special Ad
Campaigns/
Outdoor Ads
Expert
Reviews/Blo
gs
Print
Advertiseme
nt
N Valid 100 100 100 100 100 100 100
Missing 0 0 0 0 0 0 0
Mean 1.39 1.28 1.64 1.35 1.64 1.69 1.32
Median 1.00 1.00 2.00 1.00 2.00 2.00 1.00
Mode 1 1 2 1 2 2 1
83. 83
Statistics
Showroom
From Friends
or Relatives
Special Ad
Campaigns/
Outdoor Ads
Expert
Reviews/Blo
gs
Print
Advertiseme
nt
Television
Advertiseme
nt Showroom
N Valid 100 100 100 100 100 100 100
Missing 0 0 0 0 0 0 0
Mean 1.70 1.45 1.74 1.67 1.33 1.24 1.67
Median 2.00 1.00 2.00 2.00 1.00 1.00 2.00
Mode 2 1 2 2 1 1 2
Statistics
From
Friends or
Relatives
Special Ad
Campaigns/
Outdoor Ads
Expert
Reviews/Blo
gs
Personal
experience
Friends/soci
al group
experience
family
opinion
social media
review/blog
N Valid 100 100 100 100 100 100 100
Missing 0 0 0 0 0 0 0
Mean 1.34 1.76 1.67 1.43 1.48 1.54 1.83
Median 1.00 2.00 2.00 1.00 1.00 2.00 2.00
Mode 1 2 2 1 1 2 2
Statistics
brand
image
country of
origin
celebrity
endorsement
Payment
option
Payment
option
Financing
option
Financing
option
N Valid 100 100 100 100 100 100 100
Missing 0 0 0 0 0 0 0
Mean 1.60 1.91 1.88 1.71 1.18 1.57 1.94
Median 2.00 2.00 2.00 2.00 1.00 1.00 2.00
Mode 2 2 2 2 1 1 2
84. 84
The mean, median and mode of all the data is close to each other meaning the data is normally
distributed. The data is normally distributed.
Statistics
Do you
currently
own
would you
prefer to
buy
Do you
currently
own
would you
prefer to
buy
In how
many years
do you
normally
change your
car
In how
many years
do you
normally
change your
TW
New
Technology
N Valid 100 100 100 100 100 100 100
Missin
g
0 0 0 0 0 0 0
Mean 5.18 3.47 3.73 3.82 2.86 2.62 1.55
Median 6.00 4.00 3.00 3.00 3.00 3.00 1.00
Mode 8 4 3 3 2a 2 1
Statistics
Brand Status
Increase in
purchasing
power Trend Change Higher Mileage
Type of engine (
petrol, diesel,
LPG, hybrid)
N Valid 100 100 100 100 100
Missing 0 0 0 0 0
Mean 1.62 1.80 1.89 1.61 1.66
Median 2.00 2.00 2.00 1.00 1.00
Mode 1a 2 2 1 1
85. 85
Annexure 2
Questionnaire on Factors influencing Awareness & Purchase Decision for
Automobiles
1. Name: _________________________________________
2. Gender: Male Female
3. What is your age (in years)?
18 - 24 25 - 34 35 - 44 45 and above
4. What is your occupation?
Student Private Sector employee
Self employed (business) Govt. employee/public sector employee
Others (Please Specify)_______________________________
5. Education level :
10th 12th Graduation
Post-graduation Others (Please specify)_____________________
6. What is your monthly income (in rupees)?
Less than 10,000/- 10,000/- - 25,000/-
25,001/- - 50,000/- More than 50,001/-
7. Do you own /intend to buy a
Car Own intend to buy
Two Wheeler Own intend to buy
8. What price range (in rupees) are you considering for
Car Less than 3,00,000/- 3,00,000/- - 5,00,000/-
5,00,000/- - 8,00,000/- 8,00,001/- - 12,00,000/-
More than 12,00,001/-
Two Wheeler Less than 40,000/- 40,000/- - 60,000/-
60,001/- - 80,000/- 80,001/- - 1,50,000/-
More than 1,50,000/-
9. Please rate the following attributes based on their importance in your decision to
purchase an automobile
86. 86
S.No. Attributes Very
important
Important Neutral Unimportant Very
Unimportant
1 Exterior Design
2 Interior Design &
Space
3 Safety features
4 Engine capacity
(horsepower)
5 Sturdiness/durability
6 Oil tank capacity
7 Fuel efficiency
8 Suspension
9 Front/ Rear brakes
(disc or drum)
10 Innovative technology
(digital meters, LED
tail lamps/indicators,
projector headlamps)
11 Ex-showroom Price
12 Model Variants in
price range
13 After sales service
14 Resale Value
15 Brand Image/ Value
16 Showroom
Accessibility
17 Advertisements/
Brand Ambassador
18 Promotional offers
19 Purpose of use
10. How do you come to know about launch of a new model (place √ for Yes)
S.No. Source of Information Car Two-wheeler
1 Print advertisement
2 Television advertisement
3 Showroom
4 From friends or relatives
5 Special Ad campaigns/ Outdoor ads
6 Expert Reviews/Blogs
87. 87
11. How do you come to know about launch of a technological innovation (place √ for Yes)
S.No. Source of Information Car Two-wheeler
1 Print advertisement
2 Television advertisement
3 Showroom
4 From friends or relatives
5 Special Ad campaigns/ Outdoor ads
6 Expert Reviews/Blogs
12. What Influences your opinion of a particular Brand?
Personal Experience Friends/Social Group Experience
Family Opinion Social Media Reviews/Blogs
Brand Image Country of Origin
Celebrity Endorsements Others (Please Specify)_________________
13. Which Payment option is better for you to buy
Car One-time payment on installments
Two wheeler One-time payment on installments
14. Which financing option would you prefer for
Car Vehicle loan Self financed Credit
Two wheeler Vehicle loan Self financed Credit
15. Which of the following brand/model of Car
Do you currently own?
Maruti Suzuki Toyota
Hyundai Volkswagen
Mahindra Tata
Others (Please Specify) ___________
Would you prefer to buy in case of a new car?
Maruti Suzuki Toyota
Hyundai Volkswagen
Mahindra Tata
Others (Please Specify) ___________
88. 88
16. Which of the following brand/model of a two wheeler
Do you currently own?
LML Bajaj Honda
TVS Kinetic Hero
Others (Please specify) _________
Would you prefer to buy inn case of a new two wheeler?
LML Bajaj Honda
TVS Kinetic Hero
Others (Please specify) _________
17. In how many years do you normally change your
Car Less 2 years 2 – 5 years
6 – 10 years More than 10 years
Two Wheeler Less 2 years 2 – 4 years
5 – 7 years More than 7 years
18. What is the importance of the following factors when you change your vehicle?
S.No. Attributes Very
important
Important Neutral Unimportant Very
Unimportant
1 New Technology
2 Brand Status
3 Increase in
Purchasing Power
4 Trend Change
5 Higher Mileage
6 Type of Engine
(Petrol, Diesel,
LPG, Hybrid)