1. UNIVERSITY OF OKLAHOMA
GRADUATE COLLEGE
PHOTOASSOCIATION AND ROVIBRATIONAL
COOLING OF SODIUM CESIUM USING
CHIRPED LASER PULSES AND
STIMULATED RAMAN ADIABATIC PASSAGE
A DISSERTATION
SUBMITTED TO THE GRADUATE FACULTY
in partial fulfillment of the requirements for the
Degree of
DOCTOR OF PHILOSOPHY
By
ST´EPHANE VALLADIER
Norman, Oklahoma
2015
2. PHOTOASSOCIATION AND ROVIBRATIONAL
COOLING OF SODIUM CESIUM USING
CHIRPED LASER PULSES AND
STIMULATED RAMAN ADIABATIC PASSAGE
A DISSERTATION APPROVED FOR THE
HOMER L. DODGE DEPARTMENT OF PHYSICS AND ASTRONOMY
BY
Dr. Gregory A. Parker, Chair
Dr. Michael A. Morrison, Co-Chair
Dr. Eric R. Abraham
Dr. Kieran J. Mullen
Dr. James P. Shaffer
Dr. Wai Tak Yip
4. To Victoria-St´ephanie Badino & Mireille Montet,
my great-grandmother and my grandmother;
To ´Elie & Hortense Granjeon,
my step grandparents;
To R´egis & Th´er`ese Valladier,
my grandparents.
To my wife Marine
for your support, your love, and above all, your patience.
5. Acknowledgements
My first and foremost thanks go to my advisor and mentor for more than
nine years, Prof. Michael A. Morrison. You opened my mind to scientific re-
search, and constantly reminded me of the traps and pitfalls that plague the
path, while the intellectual reward, even though hard to get, was definitely
worth the trouble. For your help, guidance, advice, and above all, patience: sin-
cere thanks, Michael. Next I want to thank Prof. Gregory A. Parker who agreed to
advise me when Prof. Morrison officially retired. Greg, your insights, sugges-
tions, and warnings when dealing with numerical intricacies were extremely
valuable. Thanks for your help and support through the second half of this
journey. For their experimental expertise, I convey my gratitude to Profs. Abra-
ham and Shaffer, who kept me aware of the realities of the laboratory, some-
times easily forgotten by theorists. For accepting to jump on the wagon while
it was already on the tracks, I very gratefully thank Prof. Yip. Finally, I dearly
thank Prof. Mullen for his ongoing moral support and his help in making my
last semester at the University of Oklahoma possible.
I do not think it possible to go through Graduate School without an en-
tourage of true friends. I wish this list would be exhaustive, but sadly, I only
have limited space, and can not thank all of you individually as well as you
deserve. Nonetheless, my friendship and gratitude go in particular to Nassima
Baamara, Marine Le Faucheur, Brad C. Wilcox, Tom Akin, Sara Barber, Sean
Krzyzewski, Scarlet Norberg, and Shayne Cairns. To Bobby and Allison Flesh-
man, my thanks to you are “bigger in the inside than on the outside”. To my
colleague in this adventure, James Dizikes, for his friendship and patience with
my crazyness, for the long discussions on Physics, for his support, for the tools
you developed that helped me in this work, un grand merci.
iv
6. Although I left home to get on this adventure, home never left me. Thanks
to B´ereng`ere and Pierre Quero for their unfaltering friendship, understanding,
and electronic presence. Thanks to technology, my uncle Michel Valladier and
his wife Annie were very often by my side, and have not the slightest idea
of how much it meant to me. To my sister Diane Daunas for her unfaltering
love, her moods that always cheered me up, and her help in motivating me,
merci Micropuce. To my stepmother ´Eliane Granjeon, whose serenity and calm
were inspiring and helpful beyond hope, thank you. To my mother Corinne
Constant for her complete confidence in her son, her patience in waiting for
the end of this long road, and the long hours spent a long time ago checking
my homework, and always pushing me to give my best, thank you. To my father,
´Etienne Valladier. You ignited a hunger for knowledge in me that will never be
satiated. I hope that I put as much care in this work as you have taught me to
put in everything I do. I wish that you are as proud of this result as I am proud
to have you as a father.
Et dans mes grandes mains tremblantes
o`u repose ma th`ese termin´ee,
je haussais vers le ciel la gloire de mes parents
vers les volcans de mon Velay et les collines
de ma Provence.
—d’apr`es Marcel Pagnol,
La gloire de mon P`ere
St´ephane Valladier
Burbank, California, 13th March, 2015
v
7. Remerciements
D’abord et avant tout mes remerciements s’adressent `a mon directeur de
th`ese et mentor pendant plus de neuf ans, le Prof. Michael A. Morrison. Vous
m’avez ouvert l’esprit `a la recherche scientifique, et m’avez constamment mis
en garde contre les pi`eges et trappes qui infestent le chemin, alors que la r´e-
compense intellectuelle, bien que difficile `a obtenir, valait v´eritablement la
peine. Pour votre aide, vos conseils, vos avis, et par dessus tout, votre patience:
sinc`eres remerciements, Michael. Ensuite je voudrais remercier le Prof. Gregory
A. Parker qui accepta de me suivre quand le Prof. Morrison pris officiellement
sa retraite. Greg, votre discernement, vos suggestions, et vos avertissements `a
propos des subtilit´es num´eriques furent d’une grande valeur. Merci de votre
aide et de votre soutien pendant la deuxi`eme moiti´e de ce parcours. Pour
leur expertise dans le domaine exp´erimental, je transmets ma gratitude aux
Profs. Abraham et Shaffer, qui m’ont rappel´e les r´ealit´es du laboratoire, parfois
facilement oubli´ees par les th´eoriciens. Pour avoir accepter de prendre le train
en marche alors qu’il ´etait d´ej`a bien en route, je remercie tr`es sinc`erement le
Prof. Yip. Enfin, je remercie tr`es ch`erement le Prof. Mullen pour son soutien
moral sans faille et son aide pour avoir rendu possible mon dernier semestre `a
l’Universit´e d’Oklahoma.
Je doute qu’il soit possible de traverser l’´Ecole Doctorale sans un solide
entourage de v´eritables amis. J’aimerais que cette liste soit exhaustive, mais
malheureusement, je n’ai que peu de place, et je ne pourrais jamais vous re-
mercier tous autant que vous le m´eritez. Cependant, mon amiti´e et ma grati-
tude s’adressent en particulier `a Nassima Baamara, Marine Le Faucheur, Brad
C. Wilcox, Tom Akin, Sara Barber, Sean Krzyzewski, Scarlet Norberg, et Shayne
Cairns. `A Bobby et Allison Fleshman, ma gratitude pour vous est “plus grande
vi
8. `a l’int´erieur qu’`a l’ext´erieur”. `A mon coll`egue dans cette aventure, James Dizi-
kes, pour son amiti´e et sa patience avec mes folies, pour les longues discussions
de Physique, pour son soutien, pour les outils que tu as d´evelopp´es et qui m’ont
aid´es dans mon travail, un grand merci.
Bien qu’ayant quitt´e ma terre pour m’engager dans cette aventure, ma terre
ne m’a jamais quitt´e. Merci `a B´ereng`ere et Pierre Quero pour leur amiti´e sans
faille, leur compr´ehension, et leur pr´esence ´electronique. Grˆace `a la technolo-
gie, mon oncle Michel Valladier et sa femme Annie furent souvent `a mes cˆot´es,
et vous n’avez pas la moindre id´ee de ce que c¸a a repr´esent´e pour moi. `A
ma sœur Diane Daunas pour son amour sans faille, ses humeurs qui m’ont
toujours remont´e le moral, et son aide pour me motiver, merci Micropuce. `A
ma belle-m`ere ´Eliane Granjeon, dont la s´er´enit´e et le calme furent une source
d’inspiration et d’aide au-del`a de tout espoir, merci. `A ma m`ere Corinne Con-
stant pour sa confiance totale dans son fils, sa patience en attendant la fin de
cette longue route, et les longues heures pass´ees il y a longtemps `a v´erifier mes
devoirs, et `a toujours me pousser `a donner le meilleur de moi-mˆeme, merci. `A
mon p`ere, ´Etienne Valladier. Tu as allum´e en moi une faim de connaissance qui
ne sera jamais rassasi´ee. J’esp`ere avoir mis autant de soin dans ce travail que
tu m’as enseign´e `a en mettre dans tout ce que j’entreprenais. Je souhaite que tu
sois aussi fier de ce r´esultat que je suis fier de t’avoir pour p`ere.
Et dans mes grandes mains tremblantes
o`u repose ma th`ese termin´ee,
je haussais vers le ciel la gloire de mes parents
vers les volcans de mon Velay et les collines
de ma Provence.
—d’apr`es Marcel Pagnol,
La gloire de mon P`ere
St´ephane Valladier
Burbank, Californie, le 13 mars 2015
vii
13. List of Tables
2.1 Rabi oscillations for a continuous wave laser: maximal population in the
final state for various detunings. . . . . . . . . . . . . . . . . . . . . . . . 23
2.2 Parameters of the analytic representation of the potential energy curve
of the X1Σ+ state in NaCs. . . . . . . . . . . . . . . . . . . . . . . . . . . 42
2.3 Parameters for the short-range and the long-range form of the A1
Σ+ and
b3
Π electronic states potential energy curves of NaCs. . . . . . . . . . . 45
3.1 Molecular quantum numbers associated with various angular momenta. 59
4.1 Norm of the highest lying rovibrational wave functions of the A1
Σ+ state
of NaCs. . . . . . . . . . . . . . . . . . . . . . . . . . . . . . . . . . . . . . 123
6.1 Four letters codes for possible combination of study parameters . . . . 156
6.2 Free-bound transition dipole moment matrix elements for the 7 vibra-
tional states immediately below the configuration average asymptote
Na(3S)+Cs(6P ). . . . . . . . . . . . . . . . . . . . . . . . . . . . . . . . . 192
6.3 Population in the various states involved in case 12—BNCc at the end
of the process. . . . . . . . . . . . . . . . . . . . . . . . . . . . . . . . . . 196
6.4 Population in the various states involved in case 14—BSIc at the end of
the process. . . . . . . . . . . . . . . . . . . . . . . . . . . . . . . . . . . . 203
6.5 Population in the various states involved in case 16—BSCc at the end of
the process. . . . . . . . . . . . . . . . . . . . . . . . . . . . . . . . . . . . 207
G.1 Parameters for optimized population transfer in case 1—bNIu. . . . . . 259
G.2 Parameters for optimized population transfer in case 2—bNIc. . . . . . 260
G.3 Parameters for optimized population transfer in case 3—bNCu. . . . . . 261
G.4 Parameters for optimized population transfer in case 4—bNCc. . . . . . 262
G.5 Parameters for optimized population transfer in case 5—bSIu. . . . . . 263
G.6 Parameters for optimized population transfer in case 6—bSIc. . . . . . . 264
G.7 Parameters for optimized population transfer in case 7—bSCu. . . . . . 265
G.8 Parameters for optimized population transfer in case 6—bSIc. . . . . . . 266
G.9 Parameters for optimized population transfer in case 9—BNIu. . . . . . 267
G.10 Parameters for optimized population transfer in case 10—BNIc. . . . . 268
G.11 Parameters for optimized population transfer in case 11—BNCu. . . . . 269
G.12 Parameters for optimized population transfer in case 12—BNCc. . . . . 271
G.13 Parameters for optimized population transfer in case 13—BSIu. . . . . . 273
G.14 Parameters for optimized population transfer in case 14—BSIc. . . . . . 274
xii
14. G.15 Parameters for optimized population transfer in case 15—BSCu. . . . . 276
G.16 Parameters for optimized population transfer in case 14—BSIc. . . . . . 279
xiii
15. List of Figures
1.1 Common temperatures in Physics compared to the ultracold regime,
T ≤ 1mK. . . . . . . . . . . . . . . . . . . . . . . . . . . . . . . . . . . . . 1
1.2 General photoassociation cooling process. . . . . . . . . . . . . . . . . . 4
2.1 Gaussian electric field pulse amplitude. . . . . . . . . . . . . . . . . . . 9
2.2 Gaussian electric field pulse intensity. . . . . . . . . . . . . . . . . . . . 11
2.3 Linearly up-chirped Gaussian pulse e−t2
cos((10 + 9t)t). . . . . . . . . . . 14
2.4 Linearly up-chirped Gaussian intensity with parameters relevant to the
present research. . . . . . . . . . . . . . . . . . . . . . . . . . . . . . . . . 15
2.5 The 2-state problem: energy levels and states labels. . . . . . . . . . . . 20
2.6 Rabi oscillations for 3 different detunings. . . . . . . . . . . . . . . . . . 24
2.7 Population transfer for a π-pulse. . . . . . . . . . . . . . . . . . . . . . . 27
2.8 Population transfer for a near π-pulse. . . . . . . . . . . . . . . . . . . . 28
2.9 Energy configurations in the 3-state problem. . . . . . . . . . . . . . . . 29
2.10 Spherical polar coordinates and 3D Hilbert space. . . . . . . . . . . . . 34
2.11 Ideal adiabatic passage in the 3-state problem. . . . . . . . . . . . . . . . 38
2.12 Potential energy curves for the X1Σ+, A1
Σ+, and b3
Π electronic states of
NaCs. . . . . . . . . . . . . . . . . . . . . . . . . . . . . . . . . . . . . . . 40
2.13 Log-log plot of modified electric transition dipole moment data. . . . . 48
2.14 Semilog plot of modified electric transition dipole moment data. . . . . 49
2.15 Linear fit residuals between the electric transition dipole moment long-
range model and ab initio data. . . . . . . . . . . . . . . . . . . . . . . . . 50
2.16 Electric transition dipole moment function. . . . . . . . . . . . . . . . . 50
3.1 Definition of angles in the space-fixed frame attached to the center of
mass of the nuclei of NaCs. . . . . . . . . . . . . . . . . . . . . . . . . . . 54
3.2 Maxwell-Boltzmann probability distribution of energies at T = 200µK. 55
3.3 Definition of distances between particles in a diatomic molecule. . . . . 57
4.1 X1Σ+ electronic state of NaCs with = 1 centrifugal barrier. . . . . . . . 75
4.2 NaCs Hund’s case (a) potential energy curves (PECs) for the b3
Π and
A1
Σ+ electronic states, coupled by spin-orbit interactions to yield hy-
brid PECs V1/2 and V3/2. . . . . . . . . . . . . . . . . . . . . . . . . . . . 104
4.3 Dependence of derivatives of the spin-orbit mixing angle γ on the inter-
nuclear separation R. . . . . . . . . . . . . . . . . . . . . . . . . . . . . . 107
4.4 Definition of notation for bound states, scattering states, and asymptotic
energy for the hybrid potentials energy curves V1/2(R) and V3/2(R). . . . 109
xiv
16. 4.5 Diagonal bound-bound matrix elements
2
2µ χv1/2
| V1/2 γ V1/2 |χv1/2
. 113
4.6 Diagonal bound-bound matrix elements
2
2µ Ξq3/2
| V3/2 γ V3/2 |Ξq3/2
. . 114
4.7 Off-diag. bound-bound matrix elements −
2
2µ Ξq3/2
| V3/2 γ V1/2 |χv1/2
. 115
4.8 Test case: 2-state problem with continuous wave laser. . . . . . . . . . . 126
4.9 Test case: 3-state problem with continuous wave laser. . . . . . . . . . . 127
4.10 Test case: 2-state problem with π-pulse laser. . . . . . . . . . . . . . . . 128
5.1 Coupled-channel probability density function for vcc = 0. . . . . . . . . 133
5.2 Coupled-channel probability density function for vcc = 3. . . . . . . . . 134
5.3 Coupled-channel probability density function for vcc = 6. . . . . . . . . 135
5.4 Coupled-channel probability density function for vcc = 75. . . . . . . . 136
5.5 Coupled-channel probability density function for vcc = 165. . . . . . . . 137
5.6 Coupled-channel probability density function for vcc = 166. . . . . . . . 138
5.7 Coupled-channel probability density function for vcc = 194. . . . . . . . 139
5.8 Coupled-channel probability density function for vcc = 195. . . . . . . . 140
5.9 Coupled-channel probability density function for vcc = 235. . . . . . . . 141
6.1 Free-bound & bound-bound transition dipole moment matrix elements
between the X1Σ+ and the A1
Σ+ electronic states. . . . . . . . . . . . . . 144
6.2 Free-bound & bound-bound transition dipole moment matrix elements
between the X1Σ+ and the coupled-channel states V1/2 ∼ V3/2. . . . . . . 147
6.3 Photoassociation rate for NaCs at T = 200µK, I = 5W/cm2, below the
Na(3S)+Cs(62P3/2) asymptote. . . . . . . . . . . . . . . . . . . . . . . . . 148
6.4 Photoassociation rate for NaCs at T = 200µK, I = 5W/cm2, below the
Na(3S)+Cs(62P1/2) asymptote. . . . . . . . . . . . . . . . . . . . . . . . . 149
6.5 Photoassociation rate for NaCs at T = 100µK, I = 3.63W/cm2, below the
Na(3S)+Cs(62P1/2) asymptote. . . . . . . . . . . . . . . . . . . . . . . . . 150
6.6 Photoassociation rate for NaCs at T = 200µK, I = 74W/cm2, below the
Na(3S)+Cs(62P3/2) asymptote. . . . . . . . . . . . . . . . . . . . . . . . . 151
6.7 Photoassociation rate for NaCs at T = 1000µK, I = 74W/cm2, below the
Na(3S)+Cs(62P3/2) asymptote. . . . . . . . . . . . . . . . . . . . . . . . . 152
6.8 Difference between including and neglecting spin-orbit coupling when
determining photoassociation rates for NaCs at T = 200µK using a con-
tinuous wave laser with intensity I = 74W/cm2 vs. detuning. . . . . . . 153
6.9 Population transfer as a function of time, case 1—bNIu. . . . . . . . . . 158
6.10 Sensitivity of the final population in the final state to the laser detunings
for chirped pulses in the intuitive sequence for narrow bandwidth, no
SO coupling, case 2—bNIc. . . . . . . . . . . . . . . . . . . . . . . . . . . 162
xv
17. 6.11 Population transfer as a function of time, chirped lasers with optimized
detunings, minimal π-pulse intensity, case 2—bNIc. . . . . . . . . . . . 163
6.12 Dependence of population transfer for chirped pulses on the intensity
for case 2—bNIc. . . . . . . . . . . . . . . . . . . . . . . . . . . . . . . . . 164
6.13 Population transfer as a function of time, case 2—bNIc. . . . . . . . . . 165
6.14 Insensitivity of the population at the end of the process to the delay
between the pulses for chirped lasers, case 2—bNIc. . . . . . . . . . . . . 166
6.15 Population transfer as a function of time for optimal time delay in case
2—bNIc. . . . . . . . . . . . . . . . . . . . . . . . . . . . . . . . . . . . . 167
6.16 Adiabatic eigenstates and local adiabatic conditions for case 2—bNIc at
optimal detuning, pulse delay, and intensity. . . . . . . . . . . . . . . . . 168
6.17 Final population as a function of pulse intensities for unchirped lasers
in the counterintuitive sequence (case 3—bNCu). . . . . . . . . . . . . . 170
6.18 Final population as a function of pulse delay for unchirped lasers in the
counterintuitive sequence (case 3—bNCu) for 2 values of the intensity. . 171
6.19 Population as a function of pulse delay for unchirped lasers in the coun-
terintuitive sequence (case 3—bNCu) for 2 values of the intensity. . . . 172
6.20 Dependence of final populations on pulse delay for the counterintuitive
sequence with chirped pulses (case 4—bNCc). . . . . . . . . . . . . . . . 174
6.21 Population as a function of time in chirped STIRAP (case 4—bNCc) for
an intensity of 16Iπ,0 at optimal pulse delay. . . . . . . . . . . . . . . . . 175
6.22 Population transfer as a function of time, case 5—bSIu. . . . . . . . . . 177
6.23 Sensitivity of the final population in the final state to the laser detun-
ings for chirped pulses in the intuitive sequence for narrow bandwidth,
including SO coupling (case 6—bSIc). . . . . . . . . . . . . . . . . . . . . 178
6.24 Populations as a function of time in chirped intuitive sequence (case 6—
bSIc) for an intensity of 25Iπ,0 at optimal pulse delay. . . . . . . . . . . . 180
6.25 Population as a function of time in chirped intuitive sequence (case 7—
bSCu) for an intensity of 25Iπ,0 at optimal pulse delay. . . . . . . . . . . 181
6.26 Population transfer for chirped counterintuitive sequence of lasers with
narrow spectral bandwidth, accounting for spin-orbit effects, case 8—
bSCc. . . . . . . . . . . . . . . . . . . . . . . . . . . . . . . . . . . . . . . 182
6.27 Adiabatic elements for case 8—bSCc. . . . . . . . . . . . . . . . . . . . . 184
6.28 Population transfer for intuitive sequence of unchirped lasers with broad
spectral bandwidth (10GHz), exclusive of spin-orbit coupling, case 9—
BNIu. . . . . . . . . . . . . . . . . . . . . . . . . . . . . . . . . . . . . . . 186
6.29 Dependence of final population on the detuning of the pump pulse for
case 9—BNIu. . . . . . . . . . . . . . . . . . . . . . . . . . . . . . . . . . 187
xvi
18. 6.30 Dependence of final population on the intensity of the pump pulse for
case 9—BNIu. . . . . . . . . . . . . . . . . . . . . . . . . . . . . . . . . . 188
6.31 Dependence of final population on the pulse delay for case 9—BNIu. . 188
6.32 Population transfer for intuitive sequence of unchirped lasers with broad
spectral bandwidth (10GHz), exclusive of spin-orbit coupling, case 9—
BNIu with optimized parameters. . . . . . . . . . . . . . . . . . . . . . . 190
6.33 Population transfer for intuitive sequence of chirped lasers with broad
spectral bandwidth (10GHz), exclusive of spin-orbit coupling, case 10—
BNIc. . . . . . . . . . . . . . . . . . . . . . . . . . . . . . . . . . . . . . . 191
6.34 Population transfer for intuitive sequence of chirped lasers with broad
spectral bandwidth (10GHz), exclusive of spin-orbit coupling, case 10—
BNIc, optimal detunings. . . . . . . . . . . . . . . . . . . . . . . . . . . . 193
6.35 Variation of final populations in vibrational states of interest as a func-
tion of pulse delay for case 10—BNIc. . . . . . . . . . . . . . . . . . . . . 194
6.36 Populations with optimized parameters for case 11—BNCu. . . . . . . . 195
6.37 Populations with optimized parameters for case 12—BNCc. . . . . . . . 197
6.38 Population transfer for intuitive sequence of unchirped lasers with broad
spectral bandwidth (10GHz), inclusive of spin-orbit coupling, case 13—
BSIu. . . . . . . . . . . . . . . . . . . . . . . . . . . . . . . . . . . . . . . 199
6.39 Dependence of final population on the detuning of the pump pulse for
case 13—BSIu. . . . . . . . . . . . . . . . . . . . . . . . . . . . . . . . . . 200
6.40 Dependence of final population on the intensity of the pump pulse for
case 13—BSIu. . . . . . . . . . . . . . . . . . . . . . . . . . . . . . . . . . 200
6.41 Dependence of final population on the pulse delay for case 13—BSIu. . 201
6.42 Population transfer for intuitive sequence of unchirped lasers with broad
spectral bandwidth (10GHz), exclusive of spin-orbit coupling, case 13—
BSIu with optimized parameters. . . . . . . . . . . . . . . . . . . . . . . 202
6.43 Populations with optimized parameters for case 14—BSIc. . . . . . . . . 204
6.44 Populations with optimized parameters for case 15—BSCu. . . . . . . . 206
6.45 Populations with optimized parameters for case 16—BSCc. . . . . . . . 208
A.1 Linearly up-chirped Gaussian pulse U(t) = e−t2
cos(10πt + 21t2). . . . . 220
F.1 Coupled-channel wave function for vcc = 0. . . . . . . . . . . . . . . . . 240
F.2 Coupled-channel wave function for vcc = 3. . . . . . . . . . . . . . . . . 241
F.3 Coupled-channel wave function for vcc = 6. . . . . . . . . . . . . . . . . 242
F.4 Coupled-channel wave function for vcc = 75. . . . . . . . . . . . . . . . . 243
F.5 Coupled-channel wave function for vcc = 165. . . . . . . . . . . . . . . . 244
xvii
19. F.6 Coupled-channel wave function for vcc = 166. . . . . . . . . . . . . . . . 245
F.7 Coupled-channel wave function for vcc = 194. . . . . . . . . . . . . . . . 246
F.8 Coupled-channel wave function for vcc = 195. . . . . . . . . . . . . . . . 247
F.9 Coupled-channel wave function for vcc = 235. . . . . . . . . . . . . . . . 248
F.10 Precision check for the coupled-channel wave function for vcc = 0. . . . 249
F.11 Precision check for the coupled-channel wave function for vcc = 3. . . . 250
F.12 Precision check for the coupled-channel wave function for vcc = 6. . . . 251
F.13 Precision check for the coupled-channel wave function for vcc = 75. . . 252
F.14 Precision check for the coupled-channel wave function for vcc = 165. . . 253
F.15 Precision check for the coupled-channel wave function for vcc = 166. . . 254
F.16 Precision check for the coupled-channel wave function for vcc = 194. . . 255
F.17 Precision check for the coupled-channel wave function for vcc = 195. . . 256
F.18 Precision check for the coupled-channel wave function for vcc = 235. . . 257
F.19 Comparison of vibrational transition energies from the coupled-channel
calculation to the results of Zarahova et al.(2009). . . . . . . . . . . . . . 258
G.1 Numerical search for optimal detunings in case 11—BNCu. . . . . . . . 270
G.2 Numerical search for optimal laser intensities in case 11—BNCu, for the
optimal detuning from Fig. G.1. . . . . . . . . . . . . . . . . . . . . . . . 270
G.3 Numerical search for the optimal value of the pulse delay for the opti-
mal detuning of Fig. G.1 and the optimal intensities Fig. G.2, case 11—
BNCu. . . . . . . . . . . . . . . . . . . . . . . . . . . . . . . . . . . . . . . 271
G.4 Numerical search for optimal detunings in case 12—BNCc. . . . . . . . 272
G.5 Numerical search for optimal laser intensities in case 12—BNCc, for the
optimal detuning from Fig. G.4. . . . . . . . . . . . . . . . . . . . . . . . 272
G.6 Numerical search for the optimal value of the pulse delay for the opti-
mal detuning of Fig. G.4 and the optimal intensities Fig. G.5, case 12—
BNCc. . . . . . . . . . . . . . . . . . . . . . . . . . . . . . . . . . . . . . . 273
G.7 Numerical search for optimal detunings in case 14—BSIc. . . . . . . . . 275
G.8 Numerical search for optimal laser intensities in case 14—BSIc, for the
optimal detuning from Fig. G.7. . . . . . . . . . . . . . . . . . . . . . . . 275
G.9 Numerical search for the optimal value of the pulse delay for the opti-
mal detuning of Fig. G.7 and the optimal intensities Fig. G.8, case 14—
BSIc. . . . . . . . . . . . . . . . . . . . . . . . . . . . . . . . . . . . . . . . 276
G.10 Numerical search for optimal detunings in case 15—BSCu. . . . . . . . 277
G.11 Numerical search for optimal laser intensities in case 15—BSCu, for the
optimal detuning from Fig. G.1. . . . . . . . . . . . . . . . . . . . . . . . 277
xviii
20. G.12 Numerical search for the optimal value of the pulse delay for the opti-
mal detuning of Fig. G.1 and the optimal intensities Fig. G.2, case 15—
BSCu. . . . . . . . . . . . . . . . . . . . . . . . . . . . . . . . . . . . . . . 278
G.13 Numerical search for optimal detunings in case 16—BSCc. . . . . . . . 278
G.14 Numerical search for optimal laser intensities in case 16—BSCc, for the
optimal detuning from Fig. G.13. . . . . . . . . . . . . . . . . . . . . . . 279
G.15 Numerical search for the optimal value of the pulse delay for the op-
timal detuning of Fig. G.13 and the optimal intensities Fig. G.14, case
16—BSCc. . . . . . . . . . . . . . . . . . . . . . . . . . . . . . . . . . . . 280
xix
21. Abstract
This dissertation presents the study of how two laser pulses can bind sodium
and cesium atoms at ultracold temperature (T = 200µK) into an ultracold, po-
lar, diatomic molecule with a definite quantum state. A single-channel scat-
tering model represents the initial continuum state, and two different models
represent the intermediate state: one excluding spin-orbit coupling effects in
the intermediate state, the other accounting for such effects. We calculate the
A1
Σ+ − b3
Π spin-orbit coupled wave functions using a basis expansion tech-
nique, and validate the results by comparing to experimentally obtained, spin-
orbit coupled energy levels. The computation of photoassociation rates be-
tween the continuum state and the intermediate states reveals the crucial im-
portance of spin-orbit coupling. Furthermore, this study shows how the spec-
tral bandwidth (narrow vs. broad), the chirping (chirped vs. unchirped), the
detunings, the intensities, and the pulse delay (intuitive vs. counter-intuitive
sequence) of the lasers affect the transfer of population from the continuum
scattering state to a comparatively low-lying (vX = 32,JX = 0) rovibrational
state of the X1Σ+ ground electronic state of NaCs. The transfer process relies
either on a sequence of π-pulses, or uses stimulated Raman adiabatic passage
(STIRAP). Lasers with narrow spectral bandwidth (0.5GHz) always yield a fi-
nal population in |X1Σ+,vX = 32,JX = 0 higher than 95% in less than 4 ns.
xx
22. Chapter 1
Introduction
1.1 Ultracold polar molecules
Since the successful realization of Bose-Einstein condensates [1], physicists
endeavored to extend cooling techniques from atoms to molecules, hoping to
reach the ultracold thermal regime of a few hundred microKelvin (µK).
T K
6000 K: surface of the Sun
100°C: water boils
273.15K 0°C: water freezes
77 K: nitrogenboils
2.7 K: outer space
200 ΜK: NaCs in this work
50 nK: atomic Bose Einstein condensation
10 8
10 7
10 6
10 5
10 4
10 3
10 2
10 1
100
101
102
103
104
Figure 1.1: Common temperatures in Physics compared to the ultracold
regime, T ≤ 1mK.
Ultracold molecules are the nexus where high-precision measurement physi-
cists, controlled-chemistry scientists, and experts in quantum information pro-
cessing meet [2, 3]. Krems [4] mentions that thermal motion complicates the
occurrence of bimolecular reaction controlled by external fields; molecular
gases in the ultracold regime would not suffer from these complications, con-
1
23. sequently facilitating the reaction. The drastic reduction of thermal motion in
the ultracold regime grants controls of new degrees of freedom only available
to molecules.
Ultracold homonucleara diatomic molecules widened the horizon of physi-
cal chemistry with photoassociation, a process where a laser light binds two
atoms to form a molecule. Then the hope for ultracold polar heteronuclear
diatomic molecules was on sight, along with many promises. Carr et al. [3]
provide an extensive review of the fundamental science accessible with ultra-
cold molecules, along with possible applications. For example, strong dipolar
molecules are good candidates for testing fundamental symmetries, as they
may be used to measure the electric dipole moment of the electron (eEDM) [5].
The existence of an eEDM would violate the parity and time-reversal symme-
tries, and could explain the matter/antimatter imbalance in the observed Uni-
verse. When an electron is bound to an atom, the effect of an external electric
field on the eEDM is about 3 times smaller than when the electron is bound to
a dipolar molecule. Thus dipolar molecules naturally increase the resolutions
of the eEDM measurements. DeMille [6] proposed to use the strong dipole-
dipole interaction between such molecules to build a quantum computer. A
few years later, Rabl et al. [7] proposed a scheme to create quantum memory
devices, paving the way to the next upgrade from current Solid State Drives
(SSD) used in today’s computers. Recently, Bomble et al. [8] simulated the exe-
cution of quantum algorithms using laser pulses on a register of ultracold NaCs
molecules. Finally, Pupillo et al. [9] proposed to align strong dipolar molecules
with an external field to create a floating lattice structure, capable to host a
aAs soon as two atoms bond together, they form a molecule. If the two atomic nuclei in this
diatomic molecule are identical, the molecule is homonuclear, e.g. O2, the oxygen most lifeforms
on Earth breath. If the two atomic nuclei are different, the molecule is heteronuclear. Carbon
monoxide, CO, is a well known heteronuclear molecule: in the USA, many states require by
law that homes be equipped with CO alarms, as the gas is highly toxic to humans.
2
24. different atomic or molecular species that would then form a lattice gas.
1.2 The photoassociation process
In order to use ultracold dipolar molecules, a scheme to create them is nec-
essary. My research concerns a theoretical study of the photoassociation of the
NaCs molecule from the continuum of the ground electronic Born-Oppenheimer
(BO) state X1Σ+ to a superposition of rovibrational levels of the first excited BO
state A1
Σ+, and subsequent stabilization to one of the low-lying rovibrational
levels of the X1Σ+ state—a process called rovibrational cooling. Photoassocia-
tion is triggered by a pulsed laser that excites the initial continuum state to a
superposition of high-lying rovibrational levels of the A1
Σ+ state. The subse-
quent wave packet propagates back and forth in the potential well of the A1
Σ+
state. Eventually, spontaneous (or stimulated) emission can populate a low-
lying rovibrational level of the X1Σ+ state. The overall process is sketched in
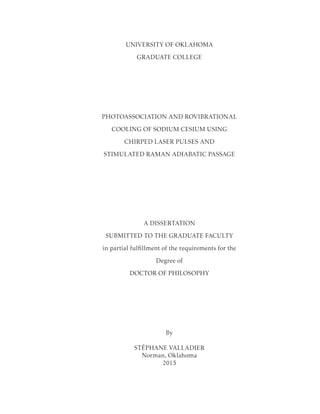
Fig. 1.2.
The study also accommodates the strong spin-orbit coupling effects be-
tween the b3
Π and the A1
Σ+ electronic states, and reported by Zaharova et al.
[10]. In the range of excitation energy usually used in photoassociation, these
relativistic effects should not be ignored.
1.3 Context
Within the past decade, several groups achieved rovibrational cooling of
diatomic molecules using various processes involving photoassociation. Luc-
Koenig and Masnou-Seeuws [11] described rovibrational cooling of Cs2 us-
ing chirped laser pulses for the photoassociation step, and relied either on
3
25. Low v
Superposition of
high lying states
Photoassociation
Relaxation
Wave packet propagation
X1
A1
Na 3s Cs 6s
Na 3s Cs 6p
Internuclear separation
Potentialenergy
Figure 1.2: General photoassociation cooling process. The photoassociation
laser transfers the colliding atoms from the continuum of the ground elec-
tronic state to a superposition of high-lying rovibrational states of the first
excited Born-Oppenheimer (BO) electronic state. As the wave packet formed
propagates to smaller internuclear separations, relaxation can occur either by
spontaneous or stimulated emission.
spontaneous [12] or stimulated [13] emission for the relaxation step. Winkler
et al. [14] transferred ultracold 87Rb2 formed via a Feschbach resonance from
a bound rovibrational state of the ground electronic state into a more deeply
bound rovibrational state of that electronic state.
The group of Ye at JILAa [15] populated high-lying vibrational levels of
the X1Σ+ state of 40K87Rb by preparing Feschbach molecules and then using
STImulated Raman Adiabatic Passage (STIRAP [16, 17]) to transfer them to the
destination state. Kerman et al. [18] reported on the formation of 85Rb133Cs
molecules in deeply bound states of the X1Σ+ state using a continuous-wave
laser for photoassociation and spontaneous emission for relaxation. Yet, prepar-
ing Feschbach molecules is technologically intricate and costly, and the relia-
aFormerly known as the Joint Institute for Laboratory Astrophysics.
4
26. bility of spontaneous emission to reach a chosen quantum state is questionable.
1.4 Why NaCs?
As mentioned above, one goal of ultracold physics is to form highly polar
molecules. The sodium-cesium (NaCs) dimer has the second largest permanent
electric dipole moment of all alkali dimers [Tbl. VI in 19]. This dipole moment
is also fairly constant among the low-lying vibrational states in the ground elec-
tronic state of NaCs [19]. ˙Zuchowski and Hutson [20, Tbl. II] showed that NaCs
is quite insensitive to the reaction 2NaCs → Na2 + Cs2: once the molecule is
formed it is the least likely among other heteronuclear alkali dimer to dissoci-
ate when colliding with another molecule.
To my knowledge, only two groups are now doing research on NaCs: the
Tiemann team at Hannover [21], and the Bigelow group at Rochester [22].
Therefore proposing a new photoassociation scheme for NaCs will contribute
to the field of formation of ultracold alkali dimers.
1.5 Here’s the menu
This manuscript unfolds in the following manner:
• Chap. 2 provides a non-exhaustive set of background topics and concepts
necessary to understand the results at the end, and also the invaluable in-
gredients required to do the research. These include the basics of the 2-
and 3- state problems of quantum mechanics, the potential energy curves
for the electronic states of the molecule, and the electric dipole moment
function that partially governs the transition between the relevant elec-
tronic states
5
27. • Chap. 3 defines the system I studied, details its relevant physical char-
acteristics, and gives justifications for the models and approximations I
used.
• Chap. 4 sets up the mathematical description of the system and the physi-
cal interactions that govern its behavior; then proceeds to derive the equa-
tions one needs to solve to actually discover how the system behaves.
• Chaps. 5 focuses on the probability density functions for the spin-orbit
coupled channels, in particular the location of the peaks of probability
depending on the energy of the coupled-channel bound state.
• Chap. 6 give the solutions to the equations obtained in Chap. 4, and fi-
nally,
• Chap. 7 summarizes the findings of this adventure, and suggests possible
extension of this work.
6
28. Chapter 2
Background
“A beginning is the time for taking the most
delicate care that the balances are correct.”
—Frank Herbert, Dune
2.1 Lasers
This section summarizes some aspects of the mathematical modeling of
lasers relevant to this work. Saleh and Teich [23, Chap. 3 & 15]a provide in-
depth information on the optical properties of laser apparati. For the purpose
of this research, it suffices to remember that lasers are essentially sources of
monochromatic electromagnetic fields. In this work, the term laser refers only
to the time-dependent, propagating, monochromatic electromagnetic field, and
never to its source. As a propagating E&M wave, laser fields are also space-
dependent. I justify in Sec. 3.2.4 p. 63 why I can neglect this spatial depen-
dence. Finally, only the electric part of the laser E&M field is considered. In
this section, I focus on the time-dependence of the laser field.
In general, the laser field
#
E (t), polarized in the direction ˆ is written as
#
E (t) = E (t)cos(ωt) ˆ (2.1)
where E (t) is the amplitude and ω the angular frequency of the photons in the
laser field.
aSee also references therein and Bransden and Joachain [24, Chap. 15].
7
29. In what follows, I examine special cases for the time dependence of E (t).
Later on, I introduce chirped laser fields, where ω becomes time-dependent.
2.1.1 Continuous wave lasers
In a continuous wave (cw) laser, the amplitude of the field is constant:
E (t) = E0 so that
#
E (t) = E0 cos(ωt) ˆ. (2.2)
Thus a cw laser is an electric field that points along the direction ˆ perpendic-
ular to the direction of propagation, with a single definite angular frequency
ω. Mathematically, the cw laser field is on since the beginning of times, and
remains on until the end of times. Physically, the cw laser field interacts with
a system that never experiences the on-off transition regime of the laser.
The intensity I(t) of an electromagnetic wave is the time-averagea over one
period T of the wave, of the magnitude of the Poynting vector #π(t):
I(t) =
1
T
t+T
t
|#π(t )|dt , (2.3)
where |#π(t )| = cε0|
#
E (t )|2. For a cw laser with amplitude E0, the intensity is the
constant I = 1
2cε0E 2
0 .
Let’s now examine a special case of lasers with time-dependent amplitudes:
the Gaussian laser pulses.
aSee [25, p. 454].
8
30. Τ'
t
0
0
2
t0 2 Τ' t0
3
2
Τ' t0 1 Τ' t0
1
2
Τ' t0 t0
1
2
Τ' t0 1 Τ' t0
3
2
Τ' t0 2 Τ'
Figure 2.1: Gaussian electric field pulse amplitude. The horizontal dashed
line indicates the Half Maximum height, while the two vertical dashed lines
mark the Full Width at Half Maximum (FWHM) ∆τ .
2.1.2 Gaussian laser pulses
In a pulsed laser, the amplitude E (t) is zero long before and long after the
interaction of the laser with the system:
lim
t→−∞
E (t) = lim
t→+∞
E (t) = 0
Typical pulsed lasers have a Gaussian amplitude—see Fig. 2.1—such that
E (t) = E0 exp −4ln2
t − t0
∆τ
2
(2.4)
where the pulse has maximum amplitude E0 at t = t0 and ∆τ is the Full Width
at Half Maximum (FWHM) such that E (t ± ∆τ
2 ) = E0
2 .
The intensity is still defined by Eq. (2.3), but a pulsed laser has a time-
9
31. dependent amplitude, so
I(t) =
1
T
t+T
t
|#π(t )|dt =
cε0
T
t+T
t
|
#
E (t )|2
dt
=
cε0
T
t+T
t
|E (t )|2
cos2
(ωt)dt
=
cε0E 2
0
T
t+T
t
exp
−4ln2
t − t0
∆τ
2
× 2
cos2
(ωt )dt (2.5)
The integral in Eq. (2.5) has no analytic solution. However, if the period of the
wave is shorter than the FWHM ∆τ , the wave oscillates over one period with-
out the envelope changing significantly, see Fig. 2.2. The exponential factor
may then be considered constant in the interval [0,T], and thus taken out of
the integral in Eq. (2.5) when T = 2π
ω ∆τ :
I(t) ≈
ω∆τ 2π
cε0E 2
0 exp −4ln2
t − t0
∆τ
2
× 2
1
T
t+T
t
cos2
(ωt )dt
I(t) ≈
ω∆τ 2π
cε0E 2
0
2
exp
−4ln2
t − t0
∆τ /
√
2
2
. (2.6)
In this research, the angular frequency ω corresponds to the transition fre-
quency between the quantum states involved. At least, ω is on the order of the
62S1/2 → 62P1/2 transition frequency of Cesium [26]: ω ≈ 2π × 3.35 × 1014 Hz.
The duration of the laser pulses in this research never exceeds 10ns = 10−8 s,
thus ω∆τ ≈ 2π × 3.35 × 1014 × 10−8 2π, so Eq. (2.6) applies. Under such con-
dition, the intensity is also Gaussian bell shaped, with peak value I0 =
cε0E 2
0
2 at
t = t0 and FWHM ∆τ = ∆τ
√
2/2.
The integral over time of the intensity represents the total energy per unit
area provided by the pulse. Let’s write I(t) as I(t) = I0 exp −
(t−t0)2
2σ2 . The Gaus-
sian function is such that 99.7% of the pulse energy is carried between t0 − 3σ
and t0 + 3σ. I can relate the standard deviation σ of the pulse intensity to the
10
32. t0 2 Τ'
t0
3
2
Τ'
t0 Τ'
t0
Τ'
2
t0
t0
Τ'
2
t0 Τ'
t0
3
2
Τ'
t0 2 Τ'
Τ
2
2
Τ'
I t
I0
I0
2
t1
t1
2 Π
Ω
t1 2
2 Π
Ω
t1 3
2 Π
Ω
t1 4
2 Π
Ω
t1 5
2 Π
Ω
t1 6
2 Π
Ω
t1 7
2 Π
Ω
I0
Figure 2.2: Top: Gaussian electric field pulse intensity. Solid thick black
line: Gaussian envelope. The gray filling inside the envelope is actually the
densely packed oscillations of the cos2(ωt) term in Eq. (2.5). These oscilla-
tions are magnified in the bottom panel. The horizontal dashed line indicates
the Half Maximum height, while the two vertical dashed lines mark the Full
Width at Half Maximum (FWHM), which is
√
2/2 smaller than the FWHM
∆τ of the original amplitude pulse of Fig. 2.1. Bottom: The period 2π/ω of
the wave is much smaller than the FWHM of the pulse. After 7 periods of the
original wave, the height of the crests remains the same, thereby justifying the
approximation that yields to Eq. (2.6). This figure uses ω = 2π×3.35×1014 Hz
and ∆τ = 10ns. The time t1 in the bottom panel is taken 500 000 wave periods
after the peak at t0.
11
33. FWHM ∆τ of the corresponding field amplitude pulse by identifying the rele-
vant terms. Thus
3σ =
3∆τ
4
√
ln2
≈ 0.9∆τ . (2.7)
Therefore, numerically, it is sufficient to consider that a process involving Gaus-
sian pulses starts ∆τ before the pulse reaches its maximum, and is over after
∆τ has elapsed since the pulse’s maximum.
Finally, since the FWHM of the Gaussian function I(t) is the temporal band-
width of the laser, what is the associated spectral bandwidth? First, the Fourier
Transform of a Gaussian function is a Gaussian function, with different param-
eters. Using the information from [23, p. 1124], the time-dependent Gaussian
intensity
I(t) =
cε0E 2
0
2
exp −4ln2
t − t0
∆τ
2
with FWHM ∆τ, has Fourier Transform
F [I(t)] = I(ω) =
cε0E 2
0
2
8πln2
∆ω2
exp −4ln2
ω − ω0
∆ω
2
.
The spectral bandwidth ∆ω, which is also the FWHM of I(ω), relates to the
temporal bandwidth through
∆ω =
4ln2
∆τ
.
Thus the briefer the laser pulse, the broader its spectral bandwidth: the fre-
quency resolution of the pulse decreases with its duration. Consider a very
brief laser pulse, such that ∆τ ≈ 5ps, then the spectral bandwidth is ∆ω ≈
2π × 8.8 × 1010 Hz. Suppose now the laser tuned to the transition between two
quantum states |1 and |2 , with resonant frequency ω12, and all initial popula-
12
34. tion in state |1 . If there exists a quantum state |3 with an energy within ∆ω of
state |2 , then the laser maya transfer some population to state |3 rather than
|2 , an unintended consequence. In choosing the laser pulses’s characteristics
in this research, I must keep this issue in mind.
2.1.3 Chirped laser pulses
By definition, a laser pulse is chirped when its central frequency ω is time-
dependent, ω = ω(t). A pulse is linearly chirped when its central frequency ω(t)
depends linearly on time, i.e. when there exists a real constantb such that
ω(t) = ω0 + t, where is the chirp rate. Linearly chirped pulses are up-chirped
for > 0 (frequency increases with time) and down-chirped for < 0 (frequency
decreases with time). A chirped Gaussian laser pulse field, polarized along ˆ
has therefore the mathematical form
#
E (t) = E (t)cos(ω(t)t) ˆ, (2.8)
with E (t) the Gaussian envelope defined in Eq. (2.4).
Figure 2.3 shows an example of a linearly up-chirped Gaussian laser pulse.
I chose the values of ω0 and to exaggerate the features created by chirping.
As Fig. 2.4 shows, for the laser tuning frequency and chirp rate value rele-
vant to the problem, the intensity of the laser is constant over several optical
cycles. Thus, like in the unchirped case of the previous section, the tempo-
ral intensity still follows a Gaussian curve. As before, if the electric field has
Gaussian envelope with FWHM ∆τ , then the temporal intensity has FWHM
aThe transition can be allowed by relevant selection rules, but actually ill-favored by detri-
mental transition dipole moments factors.
bGiven how many symbols this dissertation requires, I am running out: the character
(read roomen) is a letter in the Elvish script invented by Tolkien [27, App. E].
13
35. Time
Pulse Amplitude
Figure 2.3: Linearly up-chirped Gaussian pulse: e−t2
cos((10 + 9t)t) is the
pulse amplitude, with central frequency ω(t) = 10+9t. The dashed lines indi-
cate the pulse envelope.
∆τ = ∆τ
√
2/2:
I(t) =
cε0E 2
0
2
exp −4ln2
t − t0
∆τ
2
. (2.9)
The FWHM of the spectral intensity still defines the spectral bandwidth ∆ω
of the Gaussian chirped pulse. According to the results from Appendix A and
using the notations of the current sectiona,
∆ω =
4 ln2
∆τ
1 +
∆τ2
2ln2
2
. (2.10)
For a chirped Gaussian pulse, the spectral bandwidth is a function of the tem-
poral bandwidth and the chirp rate. Thus the choice of 2 parameters deter-
mines the third one.
aDimensional reminder: the chirp rate has dimension of time−2, and the FWHM ∆τ has
dimension of time, thus the sum in the square root in Eq. (2.10) is dimensionally consistent.
14
36. t0 2 Τ'
t0
3
2
Τ'
t0 Τ'
t0
Τ'
2
t0
t0
Τ'
2
t0 Τ'
t0
3
2
Τ'
t0 2 Τ'
Τ
2
2
Τ'
I t
I0
I0
2
t1
t1
2 Π
Ω
t1 2
2 Π
Ω
t1 3
2 Π
Ω
t1 4
2 Π
Ω
t1 5
2 Π
Ω
t1 6
2 Π
Ω
t1 7
2 Π
Ω
t1 8
2 Π
Ω
t1 9
2 Π
Ω
I0
Figure 2.4: Linearly up-chirped Gaussian pulse intensity. The gray filling
inside the envelope is actually the function e−4ln2(t−t0
∆τ )
2
cos2((ω + t)t) with
∆τ = 3ns, ω = 2π × 335.048THz, and = 2π × 10GHz/ns = 6.28 × 10⁻⁵ ps−2.
For these values of the parameters, the intensity is constant over a few optical
cycles, as the magnification in the bottom panel shows.
2.2 Adiabatic Theorem
Adiabaticity is a versatile concept in Physics, with different meanings in
thermodynamics, statistical mechanics, molecular spectroscopy, and general
quantum mechanics (see App. B). Here I limit the discussion of adiabaticity
15
37. in the context of the adiabatic theorem and adiabatic passage as presented by
Messiah [28, Chap. XVII, §II.10, vol. 2], who derives the formal mathematical
proof of the adiabatic theorem.
The Adiabatic Theorem states that if the system starts in an eigenket |i(t0)
of the Hamiltonian H (t0) at t = t0, and if H (t) changes infinitely slowly with
time, then at t = t1 > t0, the system will be in the eigenket |i(t1) of H (t1) that
derives from |i(t0) by continuity. Consequently, as time passes, the system
makes no transition from |i(t) to any other eigenket |j(t) of H (t).
2.2.1 Adiabatic passage
Consider a total hamiltonian of the form H (t) = H0 + V (t), where V (t)
represents a time-dependent interaction of the system with its environment.
In the absence of V (t), the system is governed solely by H0.
By controlling the time variation of V (t), one controls how H (t) changes in
time, and thus how its eigenstates {|j(t) }j evolve in time. In particular, one can
control the evolution of the projection of the |i(t) s on the (time-independent)
eigenkets of H0.
Let’s now assume that at t = t0 = 0,V (t0) = 0: the eigenstates of H (t0) and
H0 coincide since the two hamiltonian equal each others. Therefore, there ex-
ists an eigenket |i(t0) of H (t0) that coincides at t0 = 0 with a particular eigen-
ket of interest |ψ0 of H0. The point of adiabatic passage is to engineer V (t) so
that at some later time t1, V (t1) = 0 and |i(t1) now coincides with an eigenket
|ψ1 |ψ0 of H0.
One may think of adiabatic passage as a rotation in Hilbert space of the
time-dependent eigenkets {|j(t) }j of H (t). The rotation starts with the kets
|j(t) ’s coinciding with the eigenbasis of H0. As time passes, V (t) reorients the
16
38. kets |j(t) ’s into another configuration relative to the fixed, time-independent
eigenbasis of H0.
2.2.2 Condition for applicability of the adiabatic theorem
In adiabatic passage, the carrier state |i(t) transfers population adiabati-
cally from an initial state |ψ0 to a final state |ψ1 . The transfer is adiabatic if
the adiabatic theorem applies, i.e. the hamiltonian H (t) must vary slowly with
time. How slow is sufficiently slow? This is what the adiabatic approximation
answers.
Any rigorous implementation of the adiabatic approximation requires the
determination of the eigensystem of H (t), i.e. that H (t) can be diagonalized, a
condition satisfied by all hermitian operatorsa. The most general form of the
adiabatic approximation appears in Messiah [28, pp. 753–754]. However, this
form is impractical when engineering V (t) to achieve adiabaticity.
Noting that the adiabatic theorem is mostly used with the system at t0 = 0
in a eigenket |i(t0) of H (t0), the adiabatic approximation simplifies into [28]
αji(t)
ωji(t)
2
1, j i, (2.11)
where αji(t) = j(t) ∂
∂t
i(t) , and ωji(t) = ωj(t) − ωi(t) with ωu(t) the eigen-
value of H (t) associated with |u(t)
H (t)|u(t) = ωu(t)|u(t) , u = i,j. (2.12)
aH (t) may not be hermitian, in which case the existence of its eigenelements must be proven
by other means. Also the eigenvalues of H (t)—if they exist—may not belong to R. That’s OK:
rigorously, when H is time-dependent, its eigenvalues do not represent the possible energies
of the system, and they might even be non-observable.
17
39. Let’s show how the time-dependent potential V (t) comes into play a little
more explicitly. First remember that the total time-dependent hamiltonian is
H (t) = H0 + V (t), and differentiate Eq. (2.12) with respect to time for u = i:
∂
∂t
H (t)|i(t) =
∂
∂t
( ωi(t)|i(t) ) (2.13a)
⇔
∂H
∂t
|i(t) + H (t)
∂
∂t
|i(t) =
∂ ωi(t)
∂t
|i(t) + ωi(t)
∂
∂t
|i(t) . (2.13b)
Now, operate on the left with j(t)|
j(t)
∂H
∂t
i(t) + j(t) H (t)
∂
∂t
i(t) =
∂ ωi(t)
∂t
j(t)|i(t) + ωi(t) j(t)
∂
∂t
i(t) .
(2.13c)
Since H (t) is hermitian, j(t)|i(t) = δij and j(t)|H (t) = ωj(t) j(t)|. Thus
j(t)
∂H
∂t
i(t) + ωj(t) j(t)
∂
∂t
i(t) =
∂ ωi(t)
∂t
δij + ωi(t) j(t)
∂
∂t
i(t)
(2.13d)
⇔ j(t)
∂
∂t
i(t) = −
1
(ωj(t) − ωi(t))
j(t)
∂H
∂t
i(t) (2.13e)
⇔ αji = −
1
ωji
j(t)
∂H
∂t
i(t) (2.13f)
⇔ αji = −
1
ωji
j(t)
∂V
∂t
i(t) (2.13g)
Therefore the adiabatic theorem is applicable when
j(t) ∂V
∂t
i(t)
ω2
ji(t)
2
1, j i. (2.14)
To verify that any process is adiabatic requires the knowledge of the time deriva-
tive of the operator V (t), and the eigenelements of the total time-dependent
18
40. hamiltonian H (t).
In the next section, I will exploit adiabatic passage in the 3-state problem,
and derive the relevant adiabatic condition for that case.
2.3 Population transfer
2.3.1 The 2-state problem
This section defines the 2-state problem and presents some of its solution
in certain cases. Cohen-Tannoudji et al. [29, chap. IV, p. 405] introduces the
reader to the 2-state problem. The monograph by Shore [30] provides, to my
knowledge, the most advanced, thorough, and complete treatment of the 2 and
3-state problems. I will focus on the latter in Sec. 2.3.2, but for the moment I
shall concentrate on the former.
2.3.1.1 Presentation
Consider the 2 quantum states of Fig. 2.5. The states |i and |f are eigen-
states of a time-independent hamiltonian H0: H0 |u = Eu |u ,u = i,f. The goal
in the 2-state problem is to tailor a time-dependent interaction V (t) to trans-
fer an ensemble of particles initially in state |i to state |f . For simplicity, I
will assume that V (t) has no diagonal elements, and that all non zero matrix
elements are real:
i V (t) i = f V (t) f = 0 (2.15a)
i V (t) f = f V (t) i = Vif (t) 0. (2.15b)
19
41. f , Ef
i , Ei
Ωfi
Ω
Energy
Figure 2.5: The 2-state problem: energy levels and states labels. The prob-
lem consists in transferring the system initially in state |i into state |f using
a monochromatic coherent radiation with frequency ω. The detuning ∆ is the
difference between the radiation frequency and the energy separation between
the 2 state: ∆ = ωfi − ω.
The system is described by a ket
|Ψ (t) = ai(t)|i + af (t)|f , (2.16)
where Pi(t) = |ai(t)|2 represents the probability to find the system at time t in
state |i , and Pf (t) = |af (t)|2 represents the probability to find the system at
time t in state |f . Sometimes, one refers to Pi(t) as the population in state |i ,
and to Pf (t) as the population in state |f . The initial condition translates into
|Ψ (t = 0) = |i , i.e. Pi(t = 0) = 1 and Pf (t = 0) = 0. From the Time-Dependent
Schr¨odinger Equation using the descriptor of Eq. (2.16) and the properties of
the interaction potential given by Eqs. (2.15), one obtains, in matrix form:
i
d
dt
ai
af
=
Ei Vif (t)
Vif (t) Ef
ai
af
. (2.17)
Let’s work on how to solve this equation.
20
42. 2.3.1.2 Rotating wave approximation and solutions to the 2-state problem
The operator V (t) models the interaction between the electric dipole of the
system and the electric field
#
E (t) of a monochromatic wave with frequency ω
(see Eq. (2.1)). Thus, I may write
Vif (t) = Vif E (t)cos(ωt) = Ω(t)cos(ωt), (2.18)
so Eq. (2.17) now reads:
i
d
dt
ai
af
=
Ei Ω(t)cos(ωt)
Ω(t)cos(ωt) Ef
ai
af
. (2.19)
Due to the oscillatory term cos(ωt), this equation has no analytic solution [30,
p. 231].
To pave the way towards a solution, let’s perform the unitary transformation
ai
af
=
e−iEit/ 0
0 e−i(Ei− ω)t/
ci
cf
(2.20)
The unitary transformation does not change the populations, Pi(t) = |ai(t)|2 =
|ci(t)|2 and Pf (t) = |af (t)|2 = |cf (t)|2. The new probability amplitudes c’s satisfy
i
d
dt
ci
cf
=
0 Ω(t)cos(ωt)e−iωt
Ω(t)cos(ωt)e+iωt Ef − Ei − ω
ci
cf
(2.21a)
⇔ i
d
dt
ci
cf
=
0
Ω(t)
2 (1 + e−2iωt)
Ω(t)
2 (e2iωt + 1) Ef − Ei − ω
ci
cf
. (2.21b)
Setting Ω(t) to a constant and ω = 0 in the latter equation, renders the interac-
21
43. tion V time-independent. Then, Eq. (2.21b) has analytic solutions called Rabi
oscillations [29, chap. IV.C.3, p. 412] with frequency 1
(Ef − Ei)2 + 4| Ω|2.
When V (t) is time-dependent such that Vif (t) = Vif E (t)cos(ωt), and the
driving frequency ω is much greater thana 1
(Ef − Ei)2 + 4|Vif Emax|2, the be-
havior of interest for the probability amplitude occurs over many optical cycles
[30, p. 236]. In this context, the Rotating Wave Approximation (RWA) [30,
p. 236] assumes that the probability amplitudes cu(t),u = i,f do not change
appreciably over an optical cycle of the driving field, and thus the rapidly os-
cillating term e2iωt in Eq. (2.21b) averages out over said optical cycle. In effect
the RWA consists in the replacements
1 + e2iωt
→ 1
1 + e−2iωt
→ 1
It is useful to condense notations by defining the detuning ∆ of the driving
field from the resonance frequency, ∆ =
Ef −Ei
− ω. With the RWA, Eq. (2.21b)
becomes
d
dt
ci
cf
= −
i
2
0 Ω(t)
Ω(t) 2∆
ci
cf
(2.22)
aThe quantity Emax is the maximum value of the electric field envelope E (t).
22
44. ∆ (units of Ω) 0 1 2 3 4 5
Pmax
f 1 0.5 0.2 0.1 0.0588 0.0385
Table 2.1: Rabi oscillations for a continuous wave laser: maximal popula-
tion in the final state for various detunings. The maximal population in |f
decreases as the detuning increases, according to Pmax
f = 1/ 1 + ∆
Ω
2
.
2.3.1.3 Rabi oscillations for different detunings
For a continuous wave laser, Ω is time-independent. Then Eq. (2.22) has
analytic solutionsa for all values of the detuning ∆
ci(t) =
e−i ∆
2 t
δ
δcos
δt
2
+ i∆sin
δt
2
, (2.23a)
cf (t) = −
iΩ
δ
e−i ∆
2 t
sin
δt
2
, (2.23b)
where δ =
√
∆2 + Ω2. The probability to find the system described by the ket
|Ψ (t) in state |i or state |f at time t, i.e. the populations Pi(t) and Pf (t), are
therefore
Pi(t) = |ci(t)|2
=
1
δ2
δ2
cos2 δt
2
+ ∆2
sin2 δt
2
, (2.24a)
Pf (t) = |cf (t)|2
=
Ω
δ
2
sin2 δt
2
, (2.24b)
In Fig. 2.6 p. 24, I plot Eqs. (2.24) for three values of the detuning ∆. The plots
show that the population in each state oscillates with frequency δ =
√
∆2 + Ω2,
between extrema that also depend on the detuning (see Tbl. 2.1). As the de-
tuning increases, so does the frequency of the oscillations, while the maximal
population in state |f decreases. The population in the final state, Pf (t) is
aOne may obtain these solutions by standard methods from calculus, in particular by diag-
onalizing the 2×2 matrix of Eq. (2.22).
23
45. 2 Π
∆0
2
2 Π
∆0
3
2 Π
∆0
4
2 Π
∆0
0.0
0.5
1.0
Probability
0 2 Π
∆1
2
2 Π
∆1
3
2 Π
∆1
4
2 Π
∆1
5
2 Π
∆1
0.0
0.5
1.0
Probability
0 2 Π
∆2
2
2 Π
∆2
3
2 Π
∆2
4
2 Π
∆2
5
2 Π
∆2
6
2 Π
∆2
7
2 Π
∆2
8
2 Π
∆2
Time
0.0
0.2
0.4
0.6
0.8
1.0
Probability
Figure 2.6: Rabi oscillations for 3 different detunings. Red solid curve:
population in the final state |f . Blue dashed curve: population in the ini-
tial state |i . In each panel, the detuning is a multiple of Ω, ∆k = kΩ, so
δk = ∆2
k + Ω2 = Ω
√
k2 + 1. Top panel: zero detuning, ∆ = 0. Middle panel:
∆ = Ω. Bottom panel: ∆ = 2Ω. The vertical dashed lines mark the period for
the on-resonance (∆ = 0) case: as the detuning increases, the period of the os-
cillation decreases. Also, as the detuning increases, the maximum population
that can be transferred in |f decreases, see also Tbl. 2.1.
maximal every half-period, that is whena t = (2k + 1)π
δ ,k ∈ N.
An important point to keep in mind: figure 2.6 shows oscillating probabil-
ak ∈ N since t ≥ 0.
24
46. ities. If one performs a measurement on the system at any time t, then the
possible outcomes of that measurement are given by Eqs. (2.24). For example,
at zero detuning (top panel in Fig. 2.6), if the system is probed at t = 22π
δ0
, then
there is a 100% chance that the system is in |f . By the fifth postulate of quan-
tum mechanics (Cohen-Tannoudji et al. [29, p. 221]), the system is then frozen
into |f . Probing the same system again at a later time—no later than the life-
time of |f —will again yield Pf = 1. Population oscillations plots can not be
obtained in the lab like oscillations on an oscilloscope screen, every data point
must be obtained individually and the experiment restarted.
Summary To achieve population transfer from |i to |f in the 2-state configu-
ration with a continuous wave laser
1. the laser must be resonant with the transition |i → |f , i.e. ∆ = 0,
2. the system must be probed at any time t = (2k + 1) π
Ω,k ∈ N to freeze the
population in state |f .
What happens with a pulsed laser?
2.3.1.4 Pulsed lasers in the 2-state problem: the necessity for π-pulses
When Ω is time-dependent, then for ∆ = 0 Eq. (2.22) has analytic solutions:
ci(t) = i cos
t
0
Ω(t )
2
dt (2.25a)
cf (t) = −i sin
t
0
Ω(t )
2
dt , (2.25b)
25
47. which yields for the populations
Pi(t) = cos2
t
0
Ω(t )
2
dt (2.26a)
Pf (t) = sin2
t
0
Ω(t )
2
dt . (2.26b)
The probability to find the system in |f is 1 at all instants t such that
t
0
Ω(t )dt = (2k + 1)π, k ∈ N. (2.27)
If Ω(t) is a pulse, lasting from t = 0 to t = tend, then according to the above
condition, the pulse successfully transferred population from |i to |f if
tend
0
Ω(t )dt = (2k + 1)π, k ∈ N. (2.28)
The challenge is to achieve population transfer in a given amount of time: tend
is therefore a constraint on the problem. Furthermore, imposing when the pro-
cess ends determines the FWHM of the pulse. If ∆τ is the FWHM of a Gaus-
sian pulse, then at least 99.7% of the pulse energy is transferred to the system
between tp − ∆τ and tp + ∆τ (see Sec. 2.1.2, p. 9). Therefore one may choose
∆τ such that 2∆τ = tend. The only parameter of the pulse left to satisfy the
condition Eq. (2.28) is the pulse amplitude. In particular, a pulse that satisfies
Eq. (2.28) for k = 0 is called a π-pulse.
Figure 2.7 shows the ideal case of a π-pulse and the corresponding pop-
ulation transfer. Figure 2.8 shows the case of a near-π-pulse and the corre-
sponding population transfer. For the pulse in Fig. 2.8,
tend
0
Ω(t )dt = 3.15π.
Because the pulse does not satisfy Eq. (2.28), the population in the final state
reaches 1 before the pulse is over, and then decreases to its final value. The
26
48. 0
0.5
1
Pulseamplitude0
a
0 Τ'
2
Τ' 3
2
Τ'
2 Τ'
Time
0.0
0.2
0.4
0.6
0.8
1.0
Probability
b
final t
initial t
Figure 2.7: Population transfer for a π-pulse. (a): Solid curve, pulse am-
plitude Ω(t). The dashed lines mark the Full Width at Half Maximum. Note
that the vertical axis is in units of Ω0. (b): Probability in each state of the
2-state problem. The population passes smoothly and completely from the
initial state |i (blue dashed curve) to the final state |f (red solid curve). The
transfer effectively starts after ∆τ /2, and is essentially over after 3∆τ /2.
requirements of the π-pulse condition are quite constraining [16, p. 1005]. As
Fig. 2.8 show, population is not fully transferred when the π-pulse condition is
only approximately satisfied.
27
49. 0
0.5
1
1.5
2.
2.5
3.
Pulseamplitude0
a
0 Τ
2
Τ 3
2
Τ
2 Τ
Time
0.0
0.2
0.4
0.6
0.8
1.0
Probability
b
final t
initial t
Figure 2.8: Population transfer for a near-π pulse. (a): Solid curve, pulse
amplitude Ω(t). The dashed lines mark the Full Width at Half Maximum.
Note that the vertical axis is in units of Ω0. The dotted thin line represents
the original π-pulse of Fig. 2.7. (b): Probability in each state of the 2-state
problem. The population oscillates between the two states before reaching a
steady value at the end of the process. However, because the pulse does not
satisfy Eq. (2.28), the population in |f reaches 1 before the pulse is over, and
then decreases to its final value.
2.3.2 The 3-state problem
In the previous section, the selection rules of the interaction V (t) determine
the possibility of a transition |i → |f . As V (t) represents the electric dipole-
28
50. i , Ei
e , Ee
f , Ef
Energy
i , Ei
e , Ee
f , Ef
V
i , Ei
e , Ee
f , Ef
Figure 2.9: Possible ordering of energy in the 3-state problem. Left (Λ):
Λ configuration, Ef < Ei < Ee. Middle (Ξ): Ξ configuration, Ei < Ee < Ef .
Right (V ): V configuration, Ee < Ef < Ei. The arrows indicate the expected
sequence of the transfer. The diagrams are drawn for an overall relaxation:
Ef is always below Ei. Swapping the indices f and i gives the diagram for an
overall excitation.
electric field interaction, the strength of the transition |i → |f depends on the
amplitude of the laser field and the magnitude of the electric dipole moment
matrix element between |i and |f . If selection rules forbid the transition al-
togethera, then one can use an intermediate state |e , for which the transitions
|i → |e and |e → |f are allowed by the operator V (t), as a stepping stone be-
tween |i and |f . Whether |i lies above or below |f in energy, there are three
possible ways to position |e on the energy scale, as Fig. 2.9 shows.
2.3.2.1 Defining the problem
In the 3-state problem, two E&M fields are present: the pump field with
frequency ωP couples |i & |e , while the Stokes field with frequency ωS couples
|e to |f . If V (t) is the operator representing this interaction, we shall assume
a Or the matrix element i V (t) f is so small that the amplitude of the corresponding
laser is unrealistic.
29
51. that
i V i = e V e = f V f = i V f = 0.
I will further assume that all non-zero matrix element of V are real, and re-
member that they are time-dependent.
Furthermore, the Gaussian envelopes of each laser pulse do not coincide in
time. In particular, the envelopes reach their peak values at different instants.
Thus, the expression for the Gaussian pulse envelopes are
Ei(t) = E 0
i exp
−4ln2
(t − ti)
∆τi
2
, i = P ,S, (2.29)
where ti is the instant when Ei(t) peaks. I also define the pulse delay η = tS −tP .
When η > 0 ⇒ tS > tP , the pump pulse peaks before the Stokes pulse (intuitive
sequence). When η < 0 ⇒ tS < tP , the pump pulse peaks after the Stokes pulse
(counterintuitive sequence).
The descriptor of the system in the 3-state problem is
|Ψ (t) = ci(t)e−iEit/
|i + ce(t)e−it(ωP +Ei/ )
|e + cf (t)e−it(ωP −ωS+Ei/ )
|f , (2.30)
where the choice of phase factors sets the stage to use the RWA later. Plugging
|Ψ (t) into the Time-Dependent Schr¨odinger Equation yields equations for the
probability amplitudes c’s:
i
d
dt
ci
ce
cf
=
0 i V e e−itωP 0
e V i eitωP ∆P e V f eitωS
0 f V e e−itωS (∆P − ∆S)
ci
ce
cf
, (2.31)
30
52. where I defined the detunings
∆P =
Ee − Ei
− ωP , (2.32a)
∆S =
Ee − Ef
− ωS. (2.32b)
As in the 2-state problem, the time dependence of i V e and f V e
originates from an oscillatory part and a time-dependent envelope. However,
each term has its own envelope and its own oscillation frequencya:
i V e = VieEP (t)cos(ωP t) =
ΩP (t)
2
eiωP t
+ e−iωP t
(2.33a)
f V e = Vf eES(t)cos(ωSt) =
ΩS(t)
2
eiωSt
+ e−iωSt
(2.33b)
As in the 2-state problem, I assume that the Rabi frequencies ΩP (t) and ΩS(t)
are real quantities. Now I insert Eqs. (2.33) into Eq. (2.31) and invoke the RWA
to obtain:
d
dt
ci
ce
cf
= −
i
2
0 ΩP (t) 0
ΩP (t) 2∆P ΩS(t)
0 ΩS(t) 2(∆P − ∆S)
H(t)
ci
ce
cf
. (2.34)
Pulses in the intuitive sequence Whenb ∆P = ∆S = 0, if the pump pulse oc-
curs before the Stokes pulse, and the pulses do not overlap significantly, the
system undergoes Rabi oscillations between |i & |e while the pump pulse
lasts. After the pump pulse is over, the Stokes pulse interacts with the system
a In reality, the system interacts with the superposition EP (t) + ES(t). I give a mathemati-
cally and physically more rigorous approach in Sec. 4.3, p. 89. Thanks to the Rotating Wave
Approximation, the full problem reduces to the situation described in the present section.
b The condition ∆P = ∆S is equivalent to Ef − Ei = ωP −ωS, i.e. the energy separation between
the two photons is in resonance with the transition from |i to |f , hence the phrase two-photon
resonance.
31
53. and triggers Rabi oscillations between |e & |f . During this intuitive sequence,
if the pump (first) pulse does not satisfy the π-pulse condition of Eq. (2.28),
then the population in the intermediate state |e at the end of the pump pulse,
Pe(t
pump
end ), cannot reach 1, as in Fig. 2.8. Consequently, the Stokes (second)
pulse, even if it satisfies Eq. (2.28) can only transfer into |f at best the popu-
lation Pe(t
pump
end ). Therefore, transferring population from |i to |f through |e
sequentially requires both pulses to satisfy the π-pulse condition [31].
STIRAP However, one may use adiabatic passage to successfully transfer pop-
ulation from |i to |f ([16, 30–32]). Fewell et al. [32] provide the analytic ex-
pressions for the time-dependent eigenstates of H(t) in Eq. (2.34) for any value
of the detunings ∆P and ∆S. To gain insights relevant to this work, I confine
the present discussion to the two-photon resonance case where ∆ ≡ ∆P = ∆S.
The eigenvalues of H(t) when ∆P = ∆S = ∆ are
ω±(t) = ∆ ± ∆2 + |ΩP (t)|2 + |ΩS(t)|2 (2.35a)
ω0 = 0 (2.35b)
Unless necessary, I will no longer indicate the time-dependence of ω±(t), ΩP (t),
and ΩS(t). I assumed above that the Rabi frequencies were real quantities, thus
the modulus bars | · | in the definition of the eigenvalues are unnecessarya. The
corresponding time-dependent eigenkets are:
|Ψ+(t) =
ΩP
ω+(ω+ − ω−)
|i +
ω+
ω+(ω+ − ω−)
|e +
ΩS
ω+(ω+ − ω−)
|f (2.36a)
|Ψ−(t) =
ΩP
ω−(ω− − ω+)
|i +
ω−
ω−(ω− − ω+)
|e +
ΩS
ω−(ω− − ω+)
|f (2.36b)
aReminder: if Ω ∈ R, then |Ω|2 = Ω2. But if Ω ∈ C, then |Ω|2 Ω2, since |Ω|2 is always real,
while Ω2 can be complex.
32
54. |Ψ0(t) =
ΩS
√
−ω−ω+
|i −
ΩP
√
−ω−ω+
|f (2.36c)
Since −ω−ω+ = ΩP (t)2 +ΩS(t)2, all of the square roots above are real quantities.
The eigenket |Ψ0 is the key to adiabatic passage: if the system starts in
|Ψ0(t = t0) , and H(t) varies slowly with time, then at a later time t1 > t0, the
system will be in |Ψ0(t = t1) . Since |Ψ0 has no component along |e , the proba-
bility to find the system in |e always remains 0: the state |e is never populated.
In the case of the 3-state problem, an interesting analogy helps to visualize
adiabatic passage. Since H(t) is hermitian, the three eigenkets {|Ψ+ ,|Ψ− ,|Ψ0 }
are orthonormal, just like {|i ,|e ,|f }. Remember how to change from carte-
sian coordinates to spherical polar coordinates: the unit vectors of Fig. 2.10 are
related bya
ˆr = cosθ ˆZ + sinθ cosϕ ˆX + sinθ sinϕ ˆY (2.37a)
ˆθ = −sinθ ˆZ + cosθ cosϕ ˆX + cosθ sinϕ ˆY (2.37b)
ˆϕ = −sinϕ ˆX + cosϕ ˆY (2.37c)
The Hilbert space spanned by {|i ,|e ,|f }—or equivalently by {|Ψ0 ,|Ψ+ ,|Ψ− }—
is isomorphic to the familiar, everyday, 3 dimensional space R3. Thus by direct
analogy, I can establish the following mapping
|i ↔ ˆY Ψ+ ↔ ˆr (2.38a)
|e ↔ ˆZ Ψ− ↔ ˆθ (2.38b)
|f ↔ ˆX Ψ0 ↔ ˆϕ (2.38c)
aExceptionally, the hats on the letters do not denote operators, they are just a standard math-
ematical notation.
33
55. ˆX
ˆY
ˆZ
ˆr
ˆθ
ˆϕ
θ
ϕ
|f
|i
|e
|Ψ+
|Ψ−
|Ψ0
θ
ϕ
⇔
Figure 2.10: Spherical polar coordinates and 3D Hilbert space. Left: Angu-
lar spherical polar coordinates (θ,ϕ), along with the cartesian basis ( ˆX, ˆY , ˆZ)
and the spherical polar basis (ˆr, ˆθ, ˆϕ) of R3. The vector ˆϕ is always parallel
to the ( ˆX, ˆY ) plane. The vectors ˆr & ˆθ are in the meridian plane defined by
the azimuth ϕ. On this figure, ˆθ is below the ( ˆX, ˆY ) plane. The dotted line
extends the ˆX-axis behind the ( ˆY , ˆZ) plane. Right: The kets (|f ,|i ,|e ) of
the 3D Hilbert space correspond one to one with the vectors ( ˆX, ˆY , ˆZ) of R3.
Likewise, (|Ψ+ ,|Ψ− ,|Ψ0 ) correspond to (ˆr, ˆθ, ˆϕ). When ϕ = 0,|Ψ0 = |i ; when
ϕ = π/2,|Ψ0 = −|f . For all values of θ,|Ψ0 is always in the (|f ,|i ) plane of
the Hilbert space, thus |Ψ0 never has a component along |e .
and define the angles θ and ϕ such that:
cosϕ =
ΩS
√
−ω−ω+
sinϕ =
ΩP
√
−ω−ω+
tanϕ =
ΩP
ΩS
(2.39a)
cosθ =
ω+
ω+ − ω−
sinϕ =
ω−
ω− − ω+
(2.39b)
Consequently,
|Ψ+ = cosθ |e + sinθ cosϕ |f + sinθ sinϕ |i (2.40a)
|Ψ− = −sinθ |e + cosθ cosϕ |f + cosθ sinϕ |i (2.40b)
|Ψ0 = −sinϕ |f + cosϕ |i (2.40c)
I may now interpret adiabatic passage as the rotation in Hilbert space of |Ψ0
from |i to −|f when ϕ varies from 0 to π/2.
34
56. We should now examine closely the properties of Eq. (2.39a). The angle
ϕ varies from 0 to π/2 if the ratio ΩP /ΩS varies from 0 at t = t0 to +∞ at
t = tend. When the Gaussian pump pulse ΩP (t) peaks before the Gaussian Stokes
pulse ΩS(t) (tP < tS), then at the beginning of the process, ΩP (t)
t tP
ΩS(t), so
tanϕ
t tP
1, i.e. ϕ →
t tP
π/2 and |Ψ0 ≈
t tP
−|f . When the pulse sequence is over,
that is for t tS > tP , then
ΩP (t)
t tS
ΩS(t) ⇒ tanϕ
t tS
1 ⇒ ϕ →
t tS
0 ⇒ |Ψ0 ≈
t tS
|i
On the contrary, when the Stokes pulse peaks before the pump pulse (tS > tP ),
ΩP (t)
t tS
ΩS(t) ⇒ tanϕ
t tS
1 ⇒ ϕ →
t tS
0+
⇒ |Ψ0 ≈
t tS
|i
ΩP (t)
t tP
ΩS(t) ⇒ tanϕ
t tP
1 ⇒ ϕ →
t tP
π
2
+
⇒ |Ψ0 ≈
t tP
−|f
Thus, only when the Stokes pulse precedes the pump pulse—counterintuitive
sequence—does the state |Ψ0 effectively rotate—in Hilbert space—from |i to
−|f . Bergmann et al. [16, §V.B, p. 1011] define the effective Rabi frequency
Ωeff(t) = Ω2
P (t) + Ω2
S(t) and state
“For optimum delay, the mixing angle should reach an angle of π/4
when Ωeff reaches its maximum value.”
For Gaussian pulses of identical width ∆τ and identical height Ω0, the require-
ment of [16] yields the optimal pulse delay
η = −
∆τ
2
√
ln2
≈ −0.6∆τ
as reported in [31] (see also Appendix C).
With the counterintuitive sequence, the passage is adiabatic if the adiabatic
35
57. condition Eq. (2.14) is satisfied , i.e. if
Ψ±
d
dt
Ψ0
2
|ω± − ω0|2
(2.41)
Using the time-dependent colatitude θ(t) and azimuth ϕ(t) of Eq. (2.39)
d
dt
|Ψ0 = − ˙ϕ cosϕ |f − ˙ϕ sinϕ |i . (2.42)
Thus,
Ψ+
d
dt
Ψ0 = − ˙ϕ cosϕ sinθ cosϕ − ˙ϕ sinϕ sinθ sinϕ
= − ˙ϕ sinθ
Ψ−
d
dt
Ψ0 = − ˙ϕ cosϕ cosθ cosϕ − ˙ϕ sinϕ cosθ sinϕ
= − ˙ϕ cosθ
Since ∀t |cosθ(t)| ≤ 1 and |sinθ(t)| ≤ 1, naturally | ˙ϕg(θ(t))|2 ≤ | ˙ϕ|2,g = cos,sin.
Using Eq. (2.39) and the procedure from Appendix D,
dϕ
dt
=
1
1 + ΩP
ΩS
2
d
dR
ΩP
ΩS
(2.43a)
=
Ω2
S
Ω2
S + Ω2
P
·
˙ΩP ΩS − ΩP
˙ΩS
Ω2
S
(2.43b)
=
˙ΩP ΩS − ΩP
˙ΩS
Ω2
S + Ω2
P
(2.43c)
Therefore the transfer from |i to |f using the state |Ψ0 is adiabatic as long as,
36
58. at all times,
˙ΩP ΩS − ΩP
˙ΩS
Ω2
S + Ω2
P
2
2∆2
+ Ω2
P + Ω2
S − ∆2 + Ω2
P + Ω2
S (2.44)
If at some instant t during the interaction between the external radiation and
the sample, the adiabatic condition is not satisfied, then some population may
pass from |Ψ0 into either |Ψ+ or |Ψ− , and thus the state |e may be temporarily
populated. Fewell et al. [32] discuss more thoroughly the consequences of the
adiabatic condition not being satisfied (see [32, p. 301]).
To close this section, Fig. 2.11 shows the components squared of |Ψ0 along
|i and |f as time passes when the lasers are in the counterintuitive sequence.
The population transfer occurs mainly between the peaks of the two pulses.
The time required to achieve complete transfer is thus on the order of two laser
width plus the pulse delay, 2∆τ + η.
2.4 Spin-orbit coupling
Spin-orbit coupling is a relativistic effect [29]: in atoms, the electrons orbit
around the nucleus thanks to the electric field of the protons. According to
special relativity, this orbiting motion creates a magnetic field in the reference
frame of the electron. The magnetic field then couples with the spin of the
electron, hence the name spin-orbit coupling.
There are two ways to account for the spin-orbit effect in quantum mechan-
ics: a classical approach consists in including the spin-orbit interaction hamil-
tonian in the Time-Dependent Schr¨odinger Equation, while the Dirac approach
consists in imposing that the equation(s) describing the dynamics of the parti-
cles have relativistic invariance. In the latter case, the spin-orbit coupling term
37
59. 0
0.5
1
Pulseamplitude0
a
Stokes
Pulse
Pump
Pulse
0 Τ
2
tS tP
tP
Τ
2
2 Τ Η
Time
0.0
0.2
0.4
0.6
0.8
1.0
Probability
b
final t
initial t
Figure 2.11: Ideal adiabatic passage in the 3-state problem. Top (a): Rabi
pulses in the counterintuitive sequence. Bottom (b): Components squared of
the adiabatic state |Ψ0 along the states |i (dashed red line) and |f (solid blue
line).
naturally comes out of a power series expansion in v/c of the Dirac hamiltonian
[29, chap. XII], and is part of the more general fine-structure effects.
van Vleck [33] derived the full expression for the spin-orbit hamiltonian
in diatomic molecules. Lefebvre-Brion and Field [34, §3.4, p. 181] discuss ex-
tensively the van Vleck result and the corresponding selection rules between
molecular electronic states. Katˆo [35, Eq. (52 p. 3215)] derives in more de-
38
60. tails what electronic states actually couple through the spin-orbit interaction
in molecules. In particular, the spin-orbit interaction couples only electronic
states dissociating to the same asymptote.
2.5 Ingredients for the research
The goal of this research is to photoassociate, at ultracold temperature, a
sodium atom with a cesium atom, and then transfer the resulting molecule to
a low-lying rovibrational state in the X1Σ+ electronic state of NaCs.
Two types of physical quantities are mandatory for the research: the poten-
tial energy curves (PECs), and the transition electric dipole moment.
2.5.1 Potential energy curves
There are three PECs involved in this problem: the X1Σ+ ground elec-
tronic state, and the spin orbit-coupled A1
Σ+ and b3
Π electronic states. Here
I present the origin of the data, and how I combined it to construct physically
valid PECs, all plotted in Fig. 2.12 on p. 40.
2.5.1.1 X1
Σ+ ground electronic state
For the X1Σ+ electronic state, I used the piecewise analytic expression ob-
tained by Docenko et al. in their experimental work on the X1Σ+ and a3Σ+
electronic states of NaCs [21]. Three different pieces make up the potential
VX(R). First, at small internuclear separations 0 < R < RSR, the potential model
is
V X
SR(R) = ASR +
BSR
R3
. (2.45a)
39
61. 5 10 15 20 25 30 35 40
R a0
0.02
0.01
0.00
0.01
0.02
0.03
0.04
0.05
VREh
5 10 15 20
R
4000
2000
0
2000
4000
6000
8000
10000
12000
VRcm
1
X
1
A
1
b
3
Figure 2.12: Potential energy curves for the X1Σ+, A1
Σ+, and b3
Π electronic states
of NaCs. Solid horizontals: potential asymptotes, the A1
Σ+ and b3
Π states share the
same asymptote. Red (inner) dotted verticals: RSR and RLR for the X1Σ+ state. Blue
(outer) dotted verticals: RSR and RLR for the A1
Σ+ and b3
Π states. Dashed rectangle:
range of energies and internuclear separations covered in the experiment of [10].
40
62. Between R = RSR and R = RLR, Docenko et al. use the modified Dunham expres-
sion [36, chap. 4]
V X
WR(R) =
n
i=0
ai
R − Rm
R + bRm
i
. (2.45b)
Finally at large internuclear separations R > RLR,
V X
LR(R) = V X
disp(R) + Vex(R)
= −
CX
6
R6
−
CX
8
R8
−
CX
10
R10
− AexRγ
e−βR
. (2.45c)
In general, electronic state potentials behave as Vdisp(R) = V∞ − n Cn/Rn; how-
ever NaCs is a heteronuclear neutral molecule, and I am only interested in elec-
tronic states where the sodium atom is always in an S state, therefore according
to LeRoy [37, p. 117], ∀n ≤ 5,CX
n = 0 in V X
disp(R). Note also that the dissociation
asymptote of the X1Σ+ state serves as the origin of the energy scale—the zero of
energy—thus V X
∞ = 0. Umanski and Voronin [38] provide detailed information
on the exchange energy Vex(R).
Figure 2.12 shows the X1Σ+ state PEC, obtained by plugging in Eqs. (2.45)
the parameters of Tbl. 2.2 (reproduced from [21]).
2.5.1.2 Excited electronic states, A1
Σ+ and b3
Π
Zaharova et al. [10] published parameters for an extended Morse oscilla-
tor (EMO) model of the A1
Σ+ and b3
Π electronic states of NaCs. However,
the EMO does not have the physically appropriate n Cn/Rn behavior [37, 39]
for values of the internuclear separation R much larger than the equilibrium
internuclear separation of the respective potentials. Although the EMO does
not represent correctly the long range interactions in the diatomic molecule,
the predictions from this model agree with experimental data for the range of
41
64. energies that Zaharova et al. studied (see dashed box in Fig. 2.12 on p. 40).
In ultracold photoassociation, a laser binds the scattering atoms into a high-
lying rovibrational state of an excited electronic state of the molecule [40]. The
long-range tail of the PEC controls the shape of the radial wave function of
such high-lying state. Therefore, an alternative to the EMO model is necessary
at large values of R.
Furthermore, the rightmost (respectivelya leftmost) R boundaries of the
EMO model in Fig. 2.12 are not large (resp. small) enough to switch to the long-
range dispersion (resp. short range) form at these values of R.
Upon request, Professor Andrey Stolyarovb kindly sent me in 2009 his ab
initio data for the A1
Σ+ and b3
Π electronic states of NaCs. Stolyarov’s data has
the appropriate long range behavior:
V
q
ab initio(R) ≈
R R
q
e
V
q
∞ −
C
q
6
R6
−
C
q
8
R8
−
C
q
10
R10
j = A1
Σ+ or b3
Π, (2.46)
where j stands either for the A1
Σ+ or the b3
Π electronic state, R
q
e is the equi-
librium separation of state j, and V
q
∞ its asymptotic value. I extracted the dis-
persion coefficients from the Stolyarov data using the procedure below.
As the nuclei approach each others from large internuclear separation, more
dispersion terms become necessary to describe the long-range tail of the poten-
tial. Starting with the asymptotic value V
q
∞, the model must first include a R−6
term, then R−8, then R−10, and finally the exchange term.
Since the Stolyarov data stops at R = 20 ˚A, I initially modeled the potential
tail with V
q
∞ − C
q
6/R6. This model has two parameters; to obtain statistically
meaningful parameters through a least-squares regression, I need at least 5
aIt is common practice to abbreviate respectively as resp., a convention I will use from this
point on.
bDepartment of Chemistry, Moscow State University, Moscow, Russia.
43
65. data points. Among the n = 95 data points contained in the Stolyarov set, I
picked the last 5: Rn−4, Rn−3, Rn−2, Rn−1, Rn, and determined V
q
∞ & C
q
6 using
Mathematica least-squares regression.
To obtain converged values of the parameters, I added the next data point
when decreasing R, Rn−5, and re-ran the regression. When adding points to the
regression successively in this fashion, the parameters remained rather stable,
until adding new points caused a significant divergence of the parameters from
their previously stable value. This divergence signals the necessity for the next
term in the long-range expression. Consequently, I restarted the procedure
above, with V
q
∞ − C
q
6/R6 − C
q
8/R8.
Bussery et al. [41] and Marinescu and Sadeghpour [42] calculated ab initio
values of C6 and C8 for NaCs in the A1
Σ+ and b3
Π states. I retained the results
from the regression that yielded a 95% confidence interval for C6 that con-
tained the ab initio value of [42]. I never included C10 in the regression model:
I used C10 to enforce smoothness of the piecewise potential I constructed (see
below). The asymptotic value V
q
∞ is necessary to run the regression, however,
I discarded the fitted value, and used V
q
∞ to ensure continuity of the piecewise
potential.
Table 2.3 gives the value of C6 and C8 from the retained regression results.
Equipped with the Stolyarov data and the dispersion coefficients, and in-
fluenced by the work of [21], I constructed a piecewise model potential that
exploits the EMO of [10].
For R values below the leftmost Stolyarov data point, RSR, I used the decay-
ing exponential suggested in [43, chap. 5]
V
q
SR(R) = B
q
SRe−α
q
SRR
j = A1
Σ+ or b3
Π. (2.47)
44
66. q = A1
Σ+ b3
Π
R
q
SR ( ˚A) 2.4 2.4
B
q
SR (cm−1) 473510.3635544896 1.7618018556402298 × 10⁶
α
q
SR ( ˚A
−1
) 1.36381214805273 2.0587811904165627
R
q
LR ( ˚A) 20 20
V
q
∞ (cm−1) 16501.744076327697 16501.817004117052
C
q
6 (Eh a0
6) 17797.95844 8258.463614
C
q
8 (Eh a0
8) 5.080016549 × 10⁶ 232117.7941
C
q
10 (Eh a0
10) −3.424611835 × 10⁹ −1.443415004 × 10⁹
Table 2.3: Parameters for the short-range form V
q
SR(R) = B
q
SRe−α
q
SRR and the
long-range form V
q
LR(R) = V
q
∞ −
C
q
6
R6 −
C
q
8
R8 −
C
q
10
R10 of the A1
Σ+ and b3
Π electronic
states potential energy curves of NaCs.
For R values above the rightmost Stolyarov data point, RLR, I describe the PEC
with the dispersion potential of Eq. (2.46). Between RSR and RLR, I use the
Stolyarov data. Yet I substitute the EMO model for the Stolyarov data in the
applicable range of R values (see dashed rectangle in Fig. 2.12 p. 40), and use a
spline interpolation to smoothly connect the experimental potential to the ab
initio data points. Imposing continuity of V q(R) and dV q
dR at R = RSR yields B
q
SR
and α
q
SR. The same constraints at R = RLR give the values of V
q
∞ and C
q
10.
The A1
Σ+ and the b3
Π states should have the same asymptotic value: the
fine structure average energy ECs
avg of the cesium atom between the 62P1/2 and
the 62P3/2 excited atomic states. Using the data tables from Steck [26], where
the energies are measured from the ground atomic state 62S1/2,
ECs
avg =
3/2
j=1/2(2j + 1)ECs
j
3/2
j=1/2(2j + 1)
= 11547.6274568cm−1
. (2.48)
45