SlideShare a Scribd company logo
1 of 74
Download to read offline
E NERGY E FFICIENCY OF ARM
ARCHITECTURES FOR CLOUD
 COMPUTING APPLICATIONS

       Olle Svanfeldt-Winter


                                  Master of Science Thesis
                            Supervisor: Prof. Johan Lilius
                           Advisor: Dr. Sébastien Lafond
                           Embedded Systems Laboratory
                   Department of Information Technologies
                                  Åbo Akademi University
                                                     2011
A BSTRACT

This thesis evaluates how the energy efficiency of the ARMv7 architecture based pro-
cessors Cortex-A9 MPCpre and Cortex-A8 compare in applications such as a SIP-
Proxy and a web server compared to Intel Xeon processors. The focus is on com-
paring the energy efficiency between the two architectures rather than just the perfor-
mance. As the processors used in servers today have more computational power than
the Cortex-A9 MPCore, several of these slower but more energy efficient processors
are needed. Depending on the application, benchmarks indicate energy efficiency of
3-11 times greater for the ARM Cortex-A9 in comparison to the Intel Xeon. The top-
ics of interconnects between processors and overhead caused by using an increasing
number of processors, are left for later research.

Keywords: Cloud Computing, Energy Efficiency, ARM, Erlang, SIP-Proxy, Apache


                                          i
C ONTENTS


Abstract                                                                                                                                  i

Contents                                                                                                                                 ii

List of Figures                                                                                                                          iv

Glossary                                                                                                                                 vi

1 Introduction                                                                                                                           1
  1.1 Purpose of this thesis . . . . . . . . . . . . . . . . . . . . . . . . . .                                                         2
  1.2 Cloud Software project . . . . . . . . . . . . . . . . . . . . . . . . .                                                           3
  1.3 Thesis structure . . . . . . . . . . . . . . . . . . . . . . . . . . . . .                                                         3

2 Energy efficiency of servers                                                                                                             5
  2.1 Throughput and latency . . . . . . . .                         .   .   .   .   .   .   .   .   .   .   .   .   .   .   .   .   .    5
  2.2 Energy . . . . . . . . . . . . . . . . .                       .   .   .   .   .   .   .   .   .   .   .   .   .   .   .   .   .    6
  2.3 Large scale energy consumption . . .                           .   .   .   .   .   .   .   .   .   .   .   .   .   .   .   .   .    7
  2.4 Reducing energy consumption . . . .                            .   .   .   .   .   .   .   .   .   .   .   .   .   .   .   .   .    9
  2.5 Energy proportional computing . . . .                          .   .   .   .   .   .   .   .   .   .   .   .   .   .   .   .   .   11
  2.6 Energy efficient low power processors                           .   .   .   .   .   .   .   .   .   .   .   .   .   .   .   .   .   13
  2.7 Summary . . . . . . . . . . . . . . .                          .   .   .   .   .   .   .   .   .   .   .   .   .   .   .   .   .   14

3 Evaluated computing platforms                                                                                                          15
  3.1 Hardware . . . . . . . . . .              .   .    .   .   .   .   .   .   .   .   .   .   .   .   .   .   .   .   .   .   .   .   16
  3.2 Software . . . . . . . . . . .            .   .    .   .   .   .   .   .   .   .   .   .   .   .   .   .   .   .   .   .   .   .   23
  3.3 Benchmarks . . . . . . . . .              .   .    .   .   .   .   .   .   .   .   .   .   .   .   .   .   .   .   .   .   .   .   24
  3.4 Summary . . . . . . . . . .               .   .    .   .   .   .   .   .   .   .   .   .   .   .   .   .   .   .   .   .   .   .   31

4 Performance comparison                                                                                                                 32
  4.1 Apache results . . . .    .   .   .   .   .   .    .   .   .   .   .   .   .   .   .   .   .   .   .   .   .   .   .   .   .   .   32
  4.2 Emark results . . . .     .   .   .   .   .   .    .   .   .   .   .   .   .   .   .   .   .   .   .   .   .   .   .   .   .   .   36
  4.3 SIP-Proxy results . .     .   .   .   .   .   .    .   .   .   .   .   .   .   .   .   .   .   .   .   .   .   .   .   .   .   .   41
  4.4 Summary . . . . . .       .   .   .   .   .   .    .   .   .   .   .   .   .   .   .   .   .   .   .   .   .   .   .   .   .   .   47


                                                    ii
5 Conclusions and future work                                                        48
  5.1 Conclusions . . . . . . . . . . . . . . . . . . . . . . . . . . . . . . .      48
  5.2 Future work . . . . . . . . . . . . . . . . . . . . . . . . . . . . . . .      51

Bibliography                                                                         52

Swedish Summary                                                                      55

6 Energieffektivitet hos ARM-arkitektur för applikationer i datormoln                55
  6.1 Introduktion . . . . . . . . . . . . . . . . . . . . . . . . . . . . . .   .   55
  6.2 Energiförbrukning . . . . . . . . . . . . . . . . . . . . . . . . . . .    .   55
  6.3 Förbättring av energieffektivitet . . . . . . . . . . . . . . . . . . .    .   56
  6.4 Mätningar . . . . . . . . . . . . . . . . . . . . . . . . . . . . . . .    .   58
  6.5 Slutsatser . . . . . . . . . . . . . . . . . . . . . . . . . . . . . . .   .   59

A Results from Erlang benchmarking                                                   60


                                         iii
L IST OF F IGURES


2.1   Monthly costs for server, power and infrastructure [1] . . . . . . . . .       9
2.2   CPU contribution to total server power usage for two generations of
      Google servers. The rightmost bar shows the newer server when idling
      [2] . . . . . . . . . . . . . . . . . . . . . . . . . . . . . . . . . . . .    12

3.1   BeagleBoard block diagram [3] . . . . . . . . . . . . . . . . . . . . .        17
3.2   OMAP3530 block diagram [4] . . . . . . . . . . . . . . . . . . . . .           17
3.3   Block diagram of the Versatile Express with the Motherboard Express
      µATX, CoreTile Express A9x4 and LogicTile Express [5] . . . . . . .            18
3.4   Top level view of the main components of the CoreTile Express A9x4
      and with the CA9 NEC chip [5] . . . . . . . . . . . . . . . . . . . .          20
3.5   Test setup for Apache test . . . . . . . . . . . . . . . . . . . . . . . .     28
3.6   Test setup SIP-Proxy test . . . . . . . . . . . . . . . . . . . . . . . .      30

4.1   Comparison between CoreTile Express, Tegra and an Intel Pentium 4
      powered machine running the Apache HTTP server. . . . . . . . . . .            33
4.2   CPU utilization during test on machine with two Quad Core Intel Xeon
      E5430 processors . . . . . . . . . . . . . . . . . . . . . . . . . . . .       34
4.3   Number of requests handled for each Joule used by the CPU . . . . .            36
4.4   Graph showing the CPU utilization for CoreTile Express during SIP-
      Proxy benchmark . . . . . . . . . . . . . . . . . . . . . . . . . . . .        43
4.5   Power consumption for the CPU in CoreTile Express during SIP-Proxy
      test . . . . . . . . . . . . . . . . . . . . . . . . . . . . . . . . . . . .   44
4.6   Graph showing performance of reference machine with two Quad Core
      Xeons using an increasing number of schedulers . . . . . . . . . . . .         45
4.7   Number of calls handled for each Joule used by the CPU . . . . . . .           46


                                         iv
5.1   Achievable energy dissipation reduction by the usage of more efficient
      processors . . . . . . . . . . . . . . . . . . . . . . . . . . . . . . . .   49
5.2   Achievable energy dissipation reduction when moving to more effi-
      cient processors . . . . . . . . . . . . . . . . . . . . . . . . . . . . .   50


                                        v
G LOSSARY

SMP
        In symmetric multiprocessing two or more processors are connected to the same
        main memory.

DVF
        Dynamic Voltage and Frequency regulation is used to adjust the input voltage
        and clock frequency according to the momentary need in order to avoid unnec-
        essary energy consumption

Power gating
     Cutting power to parts of a chip when the particular part is not needed.

Data center
      Facility that houses computer systems

Server farm
      A server farm is a collection of servers. They are used when a single server is
      not capable of providing the required service

CPU Central processing unit.

Cloud
        Platform for computational and data access services where details of physical
        location of the hardware is not necessarily of concern for the end user

Granularity
     Granularity describes the extent a system is broken down into smaller parts

DMIPS
    Dhrystone MIPS. Obtained when dividing a Dhrystone benchmark score by
    1757


                                          vi
1 I NTRODUCTION

Cloud computing systems often use large server farms in order to provide services.
These server farms have high energy consumption. The energy is not only needed to
run the servers themselves but also for the systems that keep them cool. Energy con-
sumption is seen as both an economical and ecological issue. Regardless of whether
one wants to save money or to cause less strain on the environment, the solution is the
same; to reduce the energy consumption.
     The approach presented in this thesis to reduce the power dissipated by server farms
is to replace their processors with ones that are more energy efficient. The architecture
of processors used in smartphones and embedded systems have been designed with
energy efficiency in mind from the beginning, something that has not been the case
with the x86 architecture usually found in servers. This makes the processors used in
embedded systems interesting candidates when looking for replacements for regular
x86 architecture based server processors.
     Although the processors used in mobile devices use less energy for executing a sin-
gle instruction, the execution of a single instruction is often not directly comparable to
an instruction execution on a regular server processor, due to factors such as differences
in the instruction sets. Also the computational power for a single low power processor
is generally modest compared to traditional desktop and server processors. Moving
to processors with lower individual performance increases the number of processors
needed to provide the same service as before. Distributing work on a larger number
of processors increases the importance of parallelism on the software side. Applica-
tions that use a lot of I/O operations will get less of a performance drop than those
that are more computationally intensive, when switching to processors with lower in-
dividual performance, as the speed of I/O is dependent on other components than just
the CPU. Applications designed to be run on server farms are already designed to be
distributable in order to use the added resources from a server farm, compared to that
of a single server.


                                            1
Applications such as gateways in telecommunication have a large number of re-
quests to serve but the requests are light and generally independent of each other. Also
tasks performed by web servers such as serving static webpages are suitable candidates
to be run in clouds of low power processors, as the services provided are not CPU in-
tensive. The suitability to provide services using low power energy efficient processors
will be evaluated using benchmarks.
    General performance benchmarks for the Erlang virtual machine (VM) will be used
in addition to Apache benchmarking and a SIP-Proxy running on top of Erlang. Gen-
eral performance benchmarks will be used to evaluate the performance of the Erlang
run time system (erts) for a variety of tasks such as message passing and pure number
crunching thereby comparing the performance between the different architectures. The
obtained results are used to evaluate why some tasks run better on some hardware than
others and explain the performance differences for realistic applications.
    The extent of this thesis is limited to how well a single Cortex-A9 MPCore and a
Cortex-A8 perform in comparison to processors such as the Intel Xeon. The topics of
interconnects between processors and overhead caused by using an increasing number
of processors are left for later research.


1.1 Purpose of this thesis
The purpose of this thesis is to evaluate the energy efficiency of ARM Cortex-A9 MP-
Core based processors compared to x86 based processors for telecom systems and
other Cloud like services. In addition to the energy efficiency of the Cortex-A9 MP-
Core processors single core Cortex-A8 processor will also be evaluated. To make an
energy efficiency comparison possible the performance of the processors will first be
evaluated. The main interest is the comparison between the energy efficiency for the
two architectures rather than on the energy efficiency between certain processor mod-
els.
     To achieve this, several processors based on the same underlying architecture will
be evaluated. The ability to provide simple web services will also be evaluated on the
same ARM based test machines. For testing how well the testmachines perform in
providing simple web services Apache 2.2 will be used. The focus is on the ability
to provide static web pages. For the telecommunication part the focus will be on a
SIP-Proxy running on top of the Erlang VM. Micro benchmarks that stress different


                                           2
aspects of the Erlang VM are used to evaluate how efficient the ARM based processors
can handle different tasks. The important metric is how much performance is achieved
compared to the amount of energy used, rather than pure performance of the proces-
sors. The potential for energy saving achieved from using ARMv7 based processors
in servers compared to servers based on x86 processors will be evaluated. To make
the comparison realistic only the efficiency of the processors will be considered. The
potential for energy efficiency improvement for the rest of the components in the test
machines are not considered. The impact to total data center infrastructure and power
cost will be analyzed using a cost model for a hypothetical data center.


1.2 Cloud Software project
The Cloud Software Program (2010-2013) is a SHOK-program financed through TEKES
and coordinated by Tivit Oy. Its aim is to improve the competitive position of the
Finnish software intensive industry in the global market [6]. The content of this thesis
is part of the project.
    The research focus for the project in the Embedded Systems Laboratory at The
Department of Information Technologies at Åbo Akademi is to evaluate the potential
gain for energy efficiency by using low power nodes to provide services. In addition
to energy efficiency the total cost of ownership for the cloud server infrastructure is in
a central role.


1.3 Thesis structure
Chapter 2 begins with the introduction of concepts such as energy and energy effi-
ciency. Followed by why energy efficiency is an issue for cloud service providers and
how much and where energy is consumed in data centers. Methods to reduce energy
consumption as well as the concept of energy proportional computing are presented
in chapter 2. The chapter ends with a discussion on the motivations and theories on
why the usage of energy efficient low power processors is a viable option. Chapter 3
presents the hardware and software used in the evaluations as well as the benchmarks.
Chapter 4 presents the results from the benchmarks presented in Chapter 3. Compar-
isons between the results for the different test machines in the benchmarks are also
presented in this chapter. Chapter 5 shows conclusions together with suggestions for


                                          3
future work.


               4
2 E NERGY EFFICIENCY OF SERVERS

In this chapter concepts such as energy, energy efficiency and energy proportionality
will be presented. Metrics necessary to evaluate energy efficiency will also be briefly
discussed, continued by the subject of why energy consumption is both an economical
and practical issue. An example of how much energy is being used by server farms and
the cost associated with it is shown. Both direct energy cost and costs related to energy
related infrastructure. The chapter ends by presenting methods used to decrease energy
consumption and by discussing why using energy efficient low power nodes would be
an option.


2.1 Throughput and latency
It is important to notice that latency and throughput do not always correlate. Even if
two systems have the same throughput the time to serve a single request is not nec-
essarily the same. A system that uses one node to provide a certain service has to
process the individual requests faster than one consisting of several units. If the num-
ber of nodes used to provide a certain service is doubled, the requirements are naturally
cut by half for each unit. The formula below shows the relation between throughput,
latency and the number of nodes.

                   T hroughput = Availablenodes ∗ (1/Latency)

    The unit of throughput can vary greatly. If the performance of a web server is eval-
uated, the throughput can be defined as the number of requests served each second.
The latency is the time taken to serve a request and the available nodes simply indi-
cates how many nodes that are available to provide the service. The throughput can
be kept on the same level even if the latency increases, provided that the number of
nodes is increased to compensate. For example if one server with the ability to serve


                                           5
a hundred requests per second were be replaced by servers with the ability to serve 10
requests each, ten of the less powerful servers would be needed to achieve the same
performance. It is implied that the minimum latency for the service cannot be lower
than the minimum latency for a node. How long latency is acceptable depends on
the service being provided: a phone call is likely to have stricter requirements for the
response time than a service for downloading files.


2.2 Energy
Energy is generally described as the ability to perform work. It can be of many forms
such as kinetic, thermal or electric. In this thesis the focus is on electric and thermal
energy as computers use electric energy and transform it to thermal energy. Power
is the rate at which energy is being transformed into another form. In the case of
computers the conversion is from electrical energy to thermal energy. The unit for
power is Watt (W). Electric energy is measured in Joule (J) and is defined as power
multiplied with time.

                            Energy = AvgP ower ∗ T ime

    Energy efficiency is the amount of work done compared to the amount of energy
used. The exact way to measure and compare energy efficiency varies depending on the
particular application. When considering the energy efficiency for services provided by
a cloud or a server it could be for example how many Joules is needed for a transaction,
or retrieving a file from a web server. Depending on the application the metrics can
greatly vary.
    As it is stated by the first law of thermodynamics, energy is never created or de-
stroyed, only converted to other forms. All the energy that a computer, or part of a
computer consumes will be converted into heat. Depending on the amount of energy
the component consumes, the greater the problem with heat dissipation becomes. The
ability to dissipate heat is dependent on many factors, such as surface area and ma-
terial. Heat sinks are often used to increase the ability of the component in question
to dissipate heat. Regardless of thermal dissipation capabilities and the amount of
thermal energy dissipated, the heat has to be transferred somewhere in order to avoid
overheating issues.


                                           6
2.3 Large scale energy consumption
Small computer systems such as personal computers can generally be cooled by a few
fans as the space they are kept in is relatively large in comparison to the amount of
heat that is generated. When having a large number of servers in the same place the
amount of heat builds adds up. Also the modest energy consumption of a regular home
computer is often not a great economical issue as the power needed is on the same
scale of magnitude as a few incandescent light bulbs. The more densely hardware is
stacked in order to fit as much equipment as possible in the smallest possible space;
the more heat is also produced in the same space.
    The biggest consumer of energy in a server is the CPU with approximately 45
percent of the total consumption [2]. The energy consumption ratios between different
components vary depending on the configuration of the server. In servers where several
disk drives are used for data storage the energy consumption of the disk drives also
becomes significant [7]. According to Schäppi et al. the total energy consumption
of data centers has been increasing for years [8]. In 2006 the energy consumption
of servers in Western Europe (EU 15 and Switzerland) was 14,7 TWh [8]; this does
not include any energy consumed by the infrastructure such as cooling, lighting and
UPS. Schnäppi et al. also states that the complete energy consumption for the data
centers in the same region is 36,9 TWh. It is not uncommon for data center service
providers to boast of high energy efficiency, both for their servers and for the data
centers as a whole. Companies do not, however, generally present exact data on energy
consumption and the technical specification of their centers for the public, making
accurate estimates difficult. Several different metrics for energy efficiency on a data
center scale are used. Power Usage Effectiveness (PUE) and DCiE are metrics defined
by Green Grid in a white paper called “The green grid power efficiency metrics: PUE
& DCiE“ [9]. The definitions on PUE and DCiE are shown below.

              P U E = T otalF acilityP ower/IT EquipmentP ower[9]


   DCiE = 1/P U E = IT EquipmentP ower/T otalF acilityP ower ∗ 100%[9]

  IT Equipment power includes the servers but also network equipment and equip-
ment used to monitor and control the data center. Total facility power includes in

                                         7
addition to the IT equipment cooling, UPS, lighting and distribution losses external to
the IT equipment [9].
    In an ideal data center the PUE would be 1 and would mean that all power used
by the center is used to power the IT equipment. According to "The green grid power
efficiency metrics: PUE & DCiE“ preliminary data shows that many data centers have
a PUI of 3.0 or greater [9].
    Companies that provide cloud services need large amounts of computer resources.
When using cloud computing the user does not need to worry about the resources
locally, and many new data centers are being built to provide the required resources.
Several companies including Google and Microsoft are building data centers [10] with
increasing numbers of servers. Many of the centers are so large that instead of using
a server rack as the basic unit shipping containers are used [10] [11]. For example
Google uses shipping containers to house servers in their data centers. One container
is reported to house 1160 servers, and the power consumption of just one container is
reported to be up to 250 KW [11]. Using the reported values one server would use
approximately 216 W.
    In 2008 Microsoft announced that they were building a data center containing 300
000 servers [12]. If the power consumption of the servers in Microsoft’s new server
farm is the same as that reported by Google the power consumption of the servers in
the farm is approximately 65 MW. The fact that the servers are packed tightly also
means that the challenges for the cooling is increasing. The problem with large heat
dissipation is being addressed in different ways, for example Intel provides energy
efficient versions of some of its Xeon processors intended especially for high density
blade servers [13]. The more energy efficient versions are generally more expensive.
For example the Intel Xeon L5434 costs 562 e[14] and the E5430 costs 455 e[15].
Having to pay less for keeping the servers running and still providing the same services
makes new business opportunities possible and increases the profit for current business
areas.
    In order to evaluate the potential savings caused by a reduction of the energy con-
sumption the total cost structure for a server farm must be analyzed. Hamilton [1]
presents a cost analysis for a hypothetical data center. To enable the comparison be-
tween cost elements such as infrastructure, hardware and power, amortization times are
defined for the investments. The infrastructure in Hamilton’s hypothetical data center
is designed to have a 15-year amortization time for infrastructure and a 3-year amorti-


                                           8
zation time for the servers. A five percent annual cost for the capital used to build the
data center is assumed. The cost of power is set at $0.07/KWh for this example. The
costs of the data center can be seen in the pie chart shown in Figure 2.1. The chart
shows that the direct cost of power is 19 percent of the total cost. Hamilton contin-
ues pointing out that for the hypothetical data center 82 percent of the infrastructure
costs consist of power and cooling infrastructure, and that thereby the maximum power
consumption of the servers is reflected in the infrastructure costs. In Hamilton´s hy-
pothetical data center the combined cost of power and cooling infrastructure, and the
actual power is 42 percent. Hamilton writes that the power consumption contribution
is 23 percent of the total cost. The numbers in the graph do not support that statement.
The contribution of power and cooling infrastructure to the total cost on the other hand
is 23 percent and the cost of power is 19 percent, according to the graph. These are the
values that will be used in chapter five.


          Figure 2.1: Monthly costs for server, power and infrastructure [1]


2.4 Reducing energy consumption
In order to improve energy efficiency for a computer, the causes for the energy con-
sumption must be known. Knowing the contributions of the main components in a
modern computer helps to focus only on the critical components. Modern computer
systems are built using CMOS circuits. The causes for energy consumption in a CMOS
circuit are divided into Static power consumption and Active power consumption. The
static power consumption is caused by unintended leakage currents within the circuits.

                                           9
The static power consumption can be reduced by bringing down the number of active
transistors and turning parts of the chip off when not needed. Another factor that af-
fects the static power consumption is the supply voltage. Active power consumption is
caused by switching the states of the transistors and is thereby dependent of the usage
of the circuit.
    The time taken to charge and discharge a capacitor is dependent on the voltage
used. A higher voltage allows a shorter switching time and thereby a higher clock
frequency. The lowest voltage possible should be used for the planned clock frequency
in order to be energy efficient. Voltage and Frequency Scaling (DVFS) is a method to
reduce the energy consumption of a processor at times when it is not required to run
at full capacity. DVFS works by varying both the voltage and clock frequency of the
processor, depending on the performance required at a specific time [16].
    The number of transistors in a CPU has increased approximately as predicted by
Moore’s law for the last forty years, which means doubling roughly every two years
[17]. The number of transistors is reflected in chip performance. David A. Patterson
points out that the bandwidth (performance) improvement of CPUs has been faster
than for other components [18]. The annual improvements can be seen in Table 2.1.
The performance increases shown in the table are without units as it only shows the
annual improvement for the type of component in comparison to similar components
from previous years. While the difference in improvement per year is not huge, the
difference has been building up for many years. Patterson points out that bandwidth
between components such as the CPU and memory can always be improved by adding
more communications paths between them, but that it is costly and causes an increase
in energy consumption and the size of the circuits. In addition to the un proportional
increase in performance for the components in Table 2.1, Patterson raises concerns
that latency has improved less than bandwidth. Patterson continues to point out that
marketing has been one reason for this inbalance, that an increase in bandwidth is
easier to sell than a decrease in latency. Finally Patterson reminds us that certain
methods created to improve bandwidth, such as buffering, has a negative effect on
latency [18].
    The time it takes for a computer to execute a process is not only dependent on the
speed of its CPU. Other components in a computer such as the random-access memory
(RAM) are not as fast as the CPU. The speed difference causes the CPU to waste many
clock cycles waiting for memory transactions. If data has to be fetched from a hard

                                          10
CPU DRAM LAN HDD
                            1.50 1.27 139 1.28

Table 2.1: Relative annual bandwidth improvement of different computer components
during the last 20-25 years [18]


drive disk (HDD) the waiting period is further increased.
    If there is more than one task running on the same system, and the tasks are running
independently from each other, the system might well be able to execute other tasks
while one is waiting for I/O. This works well if most tasks do not require I/O operations
and access to memory. If the purpose of a system is to mainly run tasks that are I/O
intensive and require lots of memory accesses, much time is potentially wasted for the
CPU.
    As Hamilton [1] points out there are at least two ways of dealing with the perfor-
mance inbalance problem. One is to simply invest in better bandwidth and commu-
nication paths between the memory and CPU. Another way is to avoid the problem
by using lower-powered and cheaper CPUs that does not need as fast memory [1].
Hamilton also points out that because server hardware is built with higher quality re-
quirements, and in lower volumes than client hardware it is more expensive. Hamilton
continues that ”When we replace servers well before they fail, we are effectively pay-
ing for quality that we’re not using“[1]. The energy efficiency is in general better for
newer hardware adding to the pressure to upgrade to newer servers.


2.5 Energy proportional computing
According to Barroso and Holzle [2] a server is generally operating at 10 to 50 percent
of its maximum capacity but is rarely completely idle. Having data on several servers
improves the availability of the data; a side effect is, however, that more servers must
be online. In a case where servers would be completely idle for significant times,
powering down a part of the server farm would allow significant power savings. In
practice some sort of load and task migration/management system would be needed
to distribute tasks in a favorable manner between the available servers, in order to
allow powering down a larger number of servers. Barroso and Holzle continue to
state that even when a server is close to idle it still consumes about half of its peak


                                           11
power consumption. In a completely energy proportional server no energy would be
used while the server is idle. Complete energy proportionality is not feasible with the
manufacturing techniques and materials of today’s processors, due to leakage currents.
    Regardless of the average power consumption during standard operation, a data
center must still have the infrastructure to support the maximum power that the servers
can use, or are allowed to use. Reducing the peak power consumption also reduces the
demand on the power and cooling infrastructure, the part of the infrastructure that is
responsible for 82 percent of the total infrastructure costs [1]. The energy consumption
of a server is not necessarily the same as the combined peak power of the components
the server is built from [7]. The maximum peak power consumption measured for
a server constructed for the example was less than 60 percent of the combined peak
power consumption for its components. Fan et al. [7] continue to state that the power
consumption is also application specific. From the tests performed in preparation for
this thesis, it is clear that even if the system reported full CPU utilization the actual
power consumption of the CPU can vary. Furthermore Fan et al. [7] state that in
case of an actual data center the consumption is 72 percent of the actual peak power
consumption.


Figure 2.2: CPU contribution to total server power usage for two generations of Google
servers. The rightmost bar shows the newer server when idling [2]

    Figure 2.2 from [2] shows the percentage of energy consumption that the CPU con-
tributes to the total energy consumption of the server. The data are from two servers


                                           12
used by Google in 2005 and 2007. The graphs show that the contribution to the to-
tal consumption is approximately 45 percent during its peak power consumption and
approximately 27 percent when idle for the newer server. The power saving mech-
anisms on the server is unknown but from the data provided in the graph the power
saving works better on the processor itself than on the server as a whole because the
contribution made by it is smaller when the server is idling. Barroso and Holzle also
point out that they have experienced that the dynamic power ranges for DRAM are
below 50 percent: 25 percent for disc drives and 15 for networking switches [2]. The
observations are in line with the results in Figure 2.2.
    The authors in [7] claim that peak power consumption is the most important factor
for guiding server deployment in data centers but that the power bill is defined by
the average consumption. A lower peak power consumption for the servers allows
for a larger number of servers within the same energy budget, leading to a higher
utilization level of the cooling and power infrastructure and thereby a more effective
use of the available resources and budget. The requirements for both cooling and
power, including UPS are reduced with lower peak power consumption.


2.6 Energy efficient low power processors
Servers have generally been constructed for high performance, using high performance
processors rather than energy efficient ones. Processors that originate from embedded
systems are in contrast mainly built for energy efficiency. This is due to both thermal
constraints and power constraints from battery powered devices. This kind of proces-
sors hardly ever needs active cooling, regardless of them having small physical size.
     By replacing an energy hungry high performance processor with a set of energy
efficient processors originating from battery powered embedded systems, the energy
consumption can be reduced. General purpose processors for embedded systems are
produced in large numbers. To get the same amount of work done, a larger number of
the slower processors is needed. When increasing the number of processors the gran-
ularity of the power consumption also increases. In order to improve energy efficiency
with the changing of processors, the processors used must be at least as energy efficient
as the one that should be replaced. Processors used in battery powered devices where
computational power is required, are ideal for the evaluating the energy saving poten-
tial. ARM Cortex-A8 and the Cortex-A9 MPCore are tested for this purpose. When


                                          13
using DVFS to reduce the energy consumption of the processor the server continues
in an operational state. A much greater energy reduction can, however, be achieved
by entering a sleep state, where a processor is turned off and thereby not able to do
any calculations until it is waken up. The time to enter and return from a sleep state
is generally longer than when changing between power states using DVFS. In a server
with multiple processors it could be possible to put the ones that are not needed at the
moment in a sleep state, in order to reduce power consumption. In this case it is, how-
ever, important to be able to predict how long time switching between different power
states takes, and know if the service deadlines allow for such a latency.


2.7 Summary
In a perfectly power proportional server the instantaneous energy consumption is pro-
portional to the required service level. An idling server would not use any energy
and a server functioning at half capacity would use half of the server’s peak power
consumption. Techniques such as DVFS and power gating are used to increase en-
ergy proportionality. In a modern computer based on CMOS circuits complete energy
proportionality is not achievable due to leakage currents. While the average power
consumption determines the amount of actual used energy, the peak power consump-
tion is what defines the required capacity of the cooling and power infrastructure. The
cost of power and cooling infrastructure combined with direct energy consumption in
a data center is 42 percent, and approximately 45 percent of a server’s peak power
consumption is caused by the server’s processor or processors.
     Processors intended for usage in embedded devices are designed for energy effi-
ciency, in contrast to server processors that are designed for performance. The poten-
tial benefit from replacing server grade processors based on the x86 -architecture, used
in modern servers with more energy efficient ARM Cortex-A9 MPCore processors is
evaluated in this thesis.


                                          14
3 E VALUATED COMPUTING PLATFORMS

This chapter describes the hardware and software that has been used for the bench-
marking. The evaluated hardware uses the ARMv7 -architecture based Cortex-A8 and
Cortex-A9 MPCore processors. The platforms that will be used for testing are the Bea-
gleBoard, Versatile Express with a CoreTile Express A9 MPCore daughter board and
a Tegra 250 development board. The benchmarks presented in this chapter are used
to evaluate the performance of the following applications: Apache 2 HTTP server, an
Erlang based SIP-Proxy used for session management and some benchmarks testing
various aspects of the Erlang virtual machine itself. What SIP and a SIP-Proxy is will
be covered as well as Erlang.
    In order to evaluate how well a cluster of the ARM Cortex-A8 and Cortex-A9
MPCore processors are suited to replace processors used in todays servers the perfor-
mance of single processors must first be evaluated. It is possible to determine how
the energy efficiency compares between the different architectures by running com-
parison benchmarks with machines that are built using processors based on the x86
architecture. The performance of the processor architecture will be better shown by
using two different Cortex-A9 MPCore processors compared to using only one. As the
two Cortex-A9 MPCore machines have different clock frequencies as well as differ-
ent number of cores, the scaling properties for the two performance increasing options
can be evaluated. How the energy efficiency is affected by these factors must also be
evaluated. In practice evaluate, if increasing a processors clock frequency or adding
additional cores is more beneficial, when looking at the performance per watt. If the
results for a single ARM processor show worse energy efficiency compared to modern
server processors a cluster of the low power processors will then also have a worse
energy efficiency.


                                         15
3.1 Hardware

3.1.1    BeagleBoard
The BeagleBoard [3] is a low cost system based on the ARM Cortex-A8 processor
with low power requirements. The version of the BeagleBoard that was used for the
measurements is the C3. It is equipped with a TI-OMAP3530 chip with an ARM
Cortex-A8 processor running at 600MHz. The main storage device is a Micro SD-card
and there is 256MB DDR RAM available. A block diagram of the BeagleBoard is
shown in figure 3.1 and a block diagram of the OMAP3530 chip in figure 3.2. The
BeagleBoard that was used for the benchmarking had Ångström Linux installed with
kernel version 2.6.32.
    The first tests were run on a BeagleBoard B5. The B5 was later replaced by a C3
as it has double the amount of RAM compared to the B5, allowing for a wider range of
tests to be run. Neither model has an Ethernet port built in, a USB to Ethernet adapter
was therefore added to get Ethernet connectivity. An improvement from the B5 model
to the C3 model is a USB A-port in addition to the OTG mini USB port on the B5
board. Ethernet connectivity has not been built in before the new xM model and also
on the xM it is a USB based Ethernet solution [19]. A USB to Ethernet adapter was
found to be the best way to get network connectivity to the BeagleBoard. Due to the
USB to Ethernet adapter the maximum bandwidth is limited by the speed of USB 2.0
to 480 Mbps. This was not a serious limitation, due to the limited performance of the
BeagleBoard in the benchmarks.
    Although the BeagleBoard did give some indications on how the test programs
performed on an ARM based system, the tests were not conclusive. This, because of
the many differences compared to “normal” computer systems not just caused by the
processor architecture, but also from the small amount of RAM and the speed of the
RAM. The slow speed of the Micro SD-card used for main storage was also slowing
down the entire system. In the test with Erlang, a non SMP version of the Erlang run
time system (erts) was used, as the Cortex-A8 only has one core.


                                          16
Figure 3.1: BeagleBoard block diagram [3]


                     Figure 3.2: OMAP3530 block diagram [4]


3.1.2   Versatile Express
The Versatile Express [5] development platform that was used consisted of the Versa-
tile Express Motherboard (V2M-P1) with a CoreTile Express A9 MPCore [5] (V2P-
CA9) daughter board. In addition to the Quad Core Cortex-A9 MPCore the daughter
board has 1GB of DDR2 memory with a 266MHz clock frequency [5]. A block dia-


                                        17
gram of the Versatile Express can be seen in figure 3.3. The diagram shows a second
daughter board, a LogicTile Express, in addition to the CoreTile Express, the particular
machine used for the benchmarking did not have a LogicTile Express installed.


Figure 3.3: Block diagram of the Versatile Express with the Motherboard Express
µATX, CoreTile Express A9x4 and LogicTile Express [5]

   The ARM processor on the daughter board is a CA9 NEC [5] chip clocked at
400MHZ with limited power management functions. Power gating and DVFS are not


                                          18
supported on the chip [5], which needs to be noted when considering the power con-
sumption of the system. A top level view of the chip can be seen in figure 3.4. As
powering on and off cores is the main power reduction technique available on this
particular chip, the power consumption is not precisely matched to the required perfor-
mance. In a system where power gating and DVFS are available, the possibilities for
power proportional computing are better.
    The Versatile Express does, however, allow monitoring of both operating voltage
and power consumption. To use this functionality a kernel module was created and
loaded to the kernel on the V2P-CA9 to enable usage of the necessary registers for
collecting voltage, current and power consumption data. The registers used are VD10
_ S2 and VD10 _ S3. VD10 _ S3 is the power measurement device for the Cortex-
A9 system supply, cores, MPEs SCU and PL310 logic [5]. VD10 _ S3 is the most
interesting power measurement supply for this comparison. VD10 _ S2 is the current
measuring device for the PL310, L2 cache and SRAM cell supply. A program that read
the values for the voltage, current and power for both supplies once every second and
stored them for further use, was created. The use of the program allowed continuous
monitoring during benchmarking. Data logging at shorter intervals was also tested, but
was discontinued in order to reduce the interference caused by the data collecting, and
because the added value brought by it was negligible.
    Furthermore, several possibilities exist for changing settings on the chip, such as
the speed of the memory and the clock frequency for the cores. Suitable frequency
combinations for the different clocks must be carefully calculated in order for the sys-
tem to work properly. These changes must be done while the system is off line as the
settings are stored on a memory card on the Versatile Express Motherboard, and read
from there on startup. A Debian installation was provided with the Versatile Express.
The installation was provided with a 2.6.28 Linux kernel. Official support for the Ver-
satile Express in the Linux kernel was not added before version 2.6.33. To determine
the reasons for unexpected performance differences between the test platforms, mainly
between the CoreTile Express, and the Tegra 250, impacts of different parts of the test
platforms were examined. Kernel version 2.6.33 was used to evaluate if unexpected
performance differences were caused by the kernel version previously used. The main
reasons for choosing version 2.6.33 for the test, are that it supports the Versatile Ex-
press and is the closest possible version to the 2.6.32 used on the Tegra. Having the
Tegra 250, and the CoreTile Express using similar software is useful, in order to find


                                          19
differences caused by the hardware. The operating system was installed on a USB flash
drive, as the native memory card on the Versatile Express was significantly slower than
the USB flash drive.


Figure 3.4: Top level view of the main components of the CoreTile Express A9x4 and
with the CA9 NEC chip [5]


                                         20
3.1.3    Tegra
The Tegra [20] is a Tegra 200 series developer kit with a Tegra 250 system intended
to support software development. The Tegra 250 chip includes a dual core Cortex-A9
MPCore chip running at 1GHz. The board also contains 1GB of DDR2-667 RAM and
is equipped with a SMSC LAN9514 USB hub with integrated 10/100 Ethernet. The
used Tegra 250 board had an additional PCI express Gigabit Ethernet card isntalled in
order to avoid networking bottlenecks. Compared to the older chip on the Versatile
Express, the newer Cortex-A9 has both more advanced power management features
and a different networking implementation. By evaluating the performance of both
the Tegra and the CoreTile Express, the aim is to identify how varying number of
cores and difference in clock frequencies is reflected in the performance for running
different applications. Ubuntu 10.04 was installed on the board with a Linux kernel
version 2.6.32, which was provided by Nvidia. As the only compatible kernel version
available for the Tegra was the 2.6.32, and the Versatile Express was not supported
before 2.6.33, the two Cortex-A9 systems could not use the same kernel version. For
the benchmarks the Tegra 250 board was controlled through its serial port and the two
Ethernet ports.
    As information of the power consumption of either the parts of, or the entire Tegra
250 chip was not available, the values used are estimates derived from the information
released by ARM [21]. The Tegra 250 chip also includes several other specialized
processors in addition to the Cortex-A9 MPCore. This makes the process of measur-
ing the energy consumption of the Cortex-A9 even more challenging. There is little
information available for the exact configuration and manufacturing process for the
Tegra 250. According to ARM, a Dual Core Cortex-A9 built using the TSMC (Taiwan
Semiconductor Manufacturing Company) 40G process, which is a 40 nm manufactur-
ing process, in a speed optimized implementation uses 1.9 W at 2 GHz, resulting in
10000 DMIPS. A power optimized implementation uses 0.5W at 800 MHz providing
4000 DMIPS [21]. In this thesis the power consumption is estimated to be 1 W for the
Cortex-A9 in the Tegra 250.


3.1.4    Reference and client machines
In addition to the test machines with ARMv7-A processors other test machines with
x86 processors are needed to make a comparison between the energy efficiency of the


                                          21
processor architectures. A variety of machines were used during the benchmarking,
both to make comparisons possible but also to enable the benchmarking in both the
SIP-Proxy and the Apache HTTP server tests. The results that are presented for refer-
ence values originate mainly from three different machines. The first has a Dual Core
Intel E6600 processor, the second has two Intel Quad Core E5430 processors and the
third has two Quad Core Intel L5430 processors.
    According to the data sheet for the 5400 series [13], there are three different sub
series within the 5400 series, targeting different markets, the X5400, E5400 and L5400
sub-series. The X5400 series is described as a performance version and the E5400 as
a mainstream performance version. The L5400 is described as a lower voltage and
lower power version intended specifically for dual processor server blades. The listed
thermal dissipation power (TDP) for X5400, E5400 and L5400 series is 130 W, 80 W
and 50 W.


3.1.5    Network
The benchmarks that required interaction between several machines were connected
in a number of different ways, depending on the test in question, and partly by the
available resources. Due to the design of the test machines, Gigabit Ethernet, was not
always available. The BeagleBoards had the option of Ethernet over USB, or a USB
to Ethernet adapter. In order to make the tests more comparable, the USB to Ethernet
adapter option was used. Both the Versatile Express, and the Tegra 250 had 10/100
Mbps Ethernet capabilities. The Tegra had in addition to the built in fast Ethernet a
Gigabit Ethernet card.
    At first the machines that were to be benchmarked were connected directly to the
benchmarking machine without any switches. To increase the number of clients a fast
Ethernet switch was used in order to add up to six benchmarking machines. In order
to enable benchmarks by using a larger number of more powerful machines, a Gigabit
Ethernet LAN was used. Through this network ten client machines were controlled by
an eleventh machine. These machines were used to create the necessary traffic for the
benchmark. To avoid and detect problems caused by other users of the same network,
the tests were performed in the evenings outside office hours. Tests were also re done
later to confirm the results. As the network bandwidth was limited the file requested
in the test was small, in order to keep the bandwidth requirements as low as possible.
The theoretical maximum bandwidth for the LAN is a gigabit, or 131 072 KBps. The

                                          22
bandwidth of the network was not a problem for the ARM test machines. However,
for the machine used for the reference results, it was a potential bottleneck considering
the ability of the reference machines to serve tens of thousands of request per second.


3.2 Software

3.2.1    Erlang
Erlang [22] is a functional programming language and a Virtual Machine. The Erlang
syntax resembles that of prolog, not surprisingly, as it started out as a modified version
of prolog. The first version of Erlang was created at the Ericsson Computer Science
Laboratory by Joe Armstrong, Robert Virding and Mike Williams. The development of
Erlanf began in the eighties and Erlang is still used by Ericsson in telecommunication
applications [22]. It is designed to be highly concurrent and designed for fault tolerant
soft real-time systems [23]. The aim was to create a language that would be suitable
for creating telecommunication systems, consisting of millions of lines of code. These
systems are not only large, they are also meant to constantly be running. To be able
to run them continuously for as long times as possible, software upgrades must be
possible without stopping the system [24].
    Erlang/OTP is often implied when discussing Erlang. OTP is short of Open Tele-
com Platform. It contains tools, libraries and procedures for building Erlang appli-
cations. It provides readymade components, such as a complete web server and FTP
server. It is also useful when creating telecommunication applications. Both the Erlang
VM and OTP are open source licensed.
    The Erlang run time system (erts) implements its own lightweight processes and
garbage collection mechanism. Erlang is run as a single process in the host operating
system, and schedules the Erlang processes within it. SMP Erlang enables the use of
more than one CPU core on the host machine by using multiple schedulers. All sched-
ulers are run as separate processes in order to enable their simultaneous execution. In
general equally many schedulers are run as there are available CPU cores. From the
users perspective there is no difference if the cores are on the same CPU, or on differ-
ent CPUs in the same SMP machine. The number of schedulers that are used can vary,
but by default it is the same as the number of available CPU cores. There is no shared
memory between Erlang processes, which means that all communication is done using


                                           23
message passing, enabling the construction of distributed systems [23].


3.2.2    SIP-Proxy
SIP is short for Session Initialization Protocol, a standard defined by IETF [25]. IETF
or Internet Engineering Task Force is an organization that develops and promotes In-
ternet standards. IETF does not have any formal membership or membership require-
ments [25]. SIP is an application-layer protocol for controlling sessions with one or
more participants. It is used for creating, modifying and terminating sessions. The ses-
sions can be multimedia, including video or voice calls, and the session modification
possibilities include the ability to add or remove media and participants, and change
addresses. The protocol itself can be run on top of several different transport protocols,
such as Transmission Control Protocol (TCP) or User Datagram Protocol (UDP). SIP
includes features such as the possibility for a user to move around in a network, while
maintaining a single visible identifier. It is also possible to be connected to the net-
work from several different places, by for example using several different phones that
are associated with the same identifier. The SIP protocol does not provide services on
its own, it does, however, provide primitives that can be used to implement a variety of
services. There is a great variety of extensions for the SIP protocol to make it usable
for many use cases and environments.
     SIP enables the creation of an infrastructure, consisting of proxy servers that users
can use to access a service. A SIP-proxy is a server that helps route requests to the
current location of the user, and makes requests on behalf of the client, the proxy also
authenticates and authorizes users for the provided services. The protocol allows for
registration of the users locations to be used by the proxy servers.


3.3 Benchmarks
To evaluate the performance of our hardware, several benchmarks were used. First, the
performance of the Erlang rts is benchmarked to see how well it performs on the hard-
ware. This shows how well an application running on top of Erlang could be expected
to run. By benchmarking the SIP-Proxy, and Apache 2 server, the performance for
actual services is evaluated for all the hardware. More precise information about the
benchmark setups are presented in the following sections, and the results are presented
and analyzed in the following chapter.

                                           24
3.3.1   Apache 2
Apache 2.2 HTTP server was used to determine how well the Cortex-A9 MPCore
machines can perform with traditional server tasks. Apache 2.2 was chosen as it is both
freely available, open source and has been one of the most popular servers for a long
time. The Apache HTTP server is available for many platforms, such as Linux, Mac
OS/X and is used with a variety of architectures. As these benchmarks are targeting
the x86 and ARMv7-A architectures, the ability for the Apache HTTP server to run
on both is crucial. These tests are focusing on use cases with small static files. The
initial tests were run using Apache Bench (AB), a tool for quick performance testing.
The use of AB was later discontinued in favor of autobench, in order to produce more
reliable results.
    Autobench [26] was used to measure how well Apache performs on the different
machines and with different test parameters. Autobench is a tool that helps automate
the use of httperf. Httperf is a program for benchmarking the performance of a HTTP
server. It creates connections to a server, in order to fetch a file. During one connec-
tion, one or several requests for the file is made, depending on the test parameters. By
changing the rate the connections are created and the number of requests for each con-
nection, the load on the server varies. By running httperf several times with different
rates of connections the servers response to different load can be evaluated. By running
the test from several machines simultaneously, the load generating capabilities of the
test setup can be taken beyond that of a single machine, but the instances must be con-
trolled separately. The results from such tests must also generally be later combined
manually. To decrease the error caused by differences in the starting time for the test
from different test machines, the testing time should be relatively long [27].
    One of the most useful features of autobench is that it runs multiple tests while
steadily increasing the load on the server according to the users instructions. In order
to run autobench, a number of parameters must be set. The parameters can either be
set in a configuration file, or given as command line arguments when starting the test.
An example for benchmarking a single server giving the arguments from the command
line, looks like the following.
    autobench -single_host -host1 www.google.com -uri1 /10B
-quiet -low_rate 100 -high_rate 1000 -rate_step 20 -num_call
10 -num_conn 10000 -timeout 5 -file benchmarkresult.tsv
    Single host indicates that only one server is benchmarked. Host1 is the ad-


                                        25
dress to the server, in this case www.google.com. Uri1 is the file that is requested
in the test, a file called 10B, is used in this example. The quiet option must be
used if the results are expected to be sent to STDOUT, as it restricts the amount of
data that httperf produces. Too much output from httperf causes autobench to cre-
ate badly formatted report tables. The benchmarking stats from the point indicated by
low_rate, and continues to the upper limit given by high_rate using the step size
from rate_step. In this case the test starts from 100 connections and is run until
1000 connections per seconds is achieved, always adding 20 connections for each new
run. Num_call regulates how many requests for the particular file should be made
for each connection, 10 in this case. If the option to keep alive connections is disabled
on the server, the test will report a number of unsuccessful attempts at retrieving the
file. The number of attempted requests is calculated by multiplying the num_call
with the connection rate. Num_conn specifies the number of connections to create
for each step of requests. As the time taken to attempt a number of connections is
dependent on the rate the connections are created, a more convenient alternative is re-
placing num_conn with const_test_time. Const_test_time specifies how
long the test should continue, automatically calculating the value for the number of
connections for all request rates during the testing. Timeout sets the value in sec-
onds to how long a request is allowed to last before it is considered a failure. A longer
timeout value causes a greater fd (file descriptor) usage than a shorter, increasing
the risk for stability issues for the system under test. The file option simply specifies
the name of the file where the results are stored.
    In theory, almost any benchmarking program could have been run on several ma-
chines simultaneously, and then manually combine the results, autobench helps auto-
mate this process for httperf. Two programs are provided together with autobench:
autobench_admin and autobenchd. Their purpose is to make the usage of several ma-
chines for testing convenient. The idea with these programs is that autobenchd is run
on all client machines and one of them runs autobench_admin. Autobench_admin
distributes the required requests between all client machines. After the instances of
autobenchd have completed their part of the test, the results are collected and com-
bined by autobench_admin. With the basic configuration the requests are distributed
equally among all autobenchd instances. This has two implications. The first is that the
requested number of connections must be evenly dividable between all instances. The
second is that in order to get clean results, all client machines should only be requested


                                           26
to create a number of requests that the used machines are able to produce. The results
from a test where the client machine has not been able to produce enough request due
to limitations of its own, look similar to results where the server that is being tested is
not able to reply to the requests.
     In the results file, autobench stores the number of requests that were supposed to
be requested, followed by the number that actually was attempted and the number of
connections created. Statistics on what the minimum, mean and maximum number
of requests during the test is also provided. The amount of bandwidth used, and the
number of errors is also listed. As the tests are run several times, trends are easily
detectable. Especially short and sudden interference is generally obvious, interference
that remains constant is more difficult to detect. By running the tests several times, and
with an increasing load, more information is generated on how the server responds to
a varying number of connections and requests. Testing several times with similar test
parameters also gives an overview and helps verify if something has interfered with
the test.
     As illustrated in Figure 3.5, the test was set up so that the machines that were to
be benchmarked, were connected through Ethernet to the client machines that created
the requests. In order to make sure that the server was the bottleneck in the final
tests, i.e. that the data produced were meaningful; the test was run several times with
slight variations in the test parameters. To guarantee that the client machines were
able to create enough traffic, the same tests were run using an increasing number of
client machines. If the results remained close to the same, even if the number of client
machines was increased, the load created by the client machines was sufficient. The
number of served requests was set as the metric for performance. The only requirement
was that the requests being counted would be served within five seconds, the rest of the
responses were discarded. Any other quality of service aspects such as the number of
unanswered request were ignored, as the focus was on maximum performance rather
than quality of service.
     The original plan was to leave all installations of the Apache 2 http server in their
default configurations to get a generic comparison. It soon became clear that the de-
fault configurations for the Apache server installations were not identical. Although
the same version of Apache (Apache 2.2) was provided with all Linux distributions
that were used, the configurations varied. It was expected that there would be differ-
ences such as where configuration files were located on the different distributions, but


                                            27
not that the default configurations would differ. The main difference was that on the
Apache installation on the Fedora machine, the keep alive option was disabled, this
was changed to be enabled on all machines.
    By running the same static page fetching test, but using files of different sizes and
monitoring the bandwidth usage, it was decided if a file could be used safely without
getting problems with the available network bandwidth. Small file size was required as
the Versatile Express was equipped with only a 10/100 Mbps Ethernet card rather than
Gigabit Ethernet. The performance of the reference machine was expected to serve
a large number of requests resulting in a high bandwidth usage even with small files.
In tests where small files are used, the overhead caused by the underlying protocols
becomes significant.


                        Figure 3.5: Test setup for Apache test


3.3.2    Basic Erlang performance benchmarks
To evaluate the performance of the Erlang Virtual Machine (VM) running on the test
machines some general performance benchmarking was done. A set of micro bench-
marks running on the Erlang VM was used. Some of the benchmarks were able to
make use of more than one core on the host machine, while others did not gain any
notable benefit compared to running on just one core. The micro benchmarks are de-
signed to stress different parts of the VM. While these tests do not emulate a realistic
service producing scenario, they do give information of the general performance levels

                                          28
of different parts of the systems. This information can then be used to compare the
performance of the VMs running on different platforms, and provide a way to estimate
how well different applications could be expected to run. The results are included as
Appendix A. Due to reasons such as insufficient memory in the test hardware, not all
benchmarks were run on all available test platforms. If a benchmark was not able to
run on all machines, the results from the benchmark was also not analyzed for the rest
of the machines either.


3.3.3    SIP-Proxy
An Erlang based SIP-Proxy (Session Initiation Protocol Proxy) was tested to find out
how well an ARM Cortex-A9 would perform in telecom applications. The perfor-
mance of the SIP-Proxy was measured in the number of calls per second it could han-
dle. The metric for energy efficiency for the proxy was decided to be the number of
calls the proxy could handle for each Joule used. As the proxy is running on top of
Erlang, the results from this particular proxy reflect the result from the Erlang micro
benchmark. The value this benchmark brings comes from giving a performance and
energy efficiency evaluation for a realistic service, rather than just parts of the system
as the micro benchmarks did.
    To measure the performance of the proxy, two other machines were used as shown
in Figure 3.6. One machine was used to create the messages that should be passed and
the other was used as the receiver. Both of these machines were running SIPp, an open
source test and traffic generation tool made available by HP. The version used was 3.1
and was compiled from the source. The bandwidth required for the proxy running on a
machine capable of only a limited number of calls each second is not big, bandwidth,
was thereby not expected to be an issue here. The proxy had a fd leak and in order to
avoid issues caused by this, the maximum number of fd:s both system wide, and for
each user was increased. During the time the proxy was running there was constantly
a small increase in the memory used by the underlying erts. The total memory usage
of the system was, however, all in all modest. To get more reliable results and avoid as
much interference from the unwanted accumulative use of system resources caused by
the fd leak, the proxy was restarted between every test.
    In order to evaluate the performance of the proxy a definition for when the proxy
passed a test was needed. In the reference results provided by Ericsson the proxy had
been expected to run for a few minutes. The reference results used in this benchmark

                                           29
are from a machine with two Quad Core Intel Xeon L5430 processors and 8 GB of
RAM. As the testing focused on processors with lower performance more strict re-
quirements were set up. This was done to enable a more accurate comparison between
the different ARM Cortex-A9 MPCore processors that were to be tested.


                        Figure 3.6: Test setup SIP-Proxy test

    The test machines were required to be able to pass all requested messages for a two
minute period. The two minute requirement was as a result of two different factors.
The first was the requirement used by Ericsson that the new requirement would need
to be in line with. The second was caused by the way the proxy used system resources.
When running the proxy, the CPU utilization level of the system increased rapidly for a
while. After the rapid increase a very slow increase was observable for the entire time
the proxy was running. The rapid increase was observed to halt well before the two
minute mark for all the tested ARM Cortex-A9 MPCore systems. There was not much
need for discussion for an acceptable error rate, as a low sustainable error rate was
not encountered during the testing. If the load was not significantly decreased quickly
after a failed message caused by a high load, the fail rate would increase rapidly.
    The erts on both the Versatile Express and the Tegra 250 was recompiled to support
profiling using Gprof. Some optimizations had to be disabled from the make files for
the erts in order for Gprof to work. Gprof shows function calls executed by a specific
program, Oprofile was also used as it has the ability to perform system wide profiling.
To enable profiling using Oprofile the kernels on both machines were recompiled. As
the profiling has a negative effect on system performance the profiling enabled versions


                                          30
of both the erts and the kernels were not used when obtaining results for maximum
performance in any benchmarks. The versions that supported profiling were only used
to find reasons for unexpected anomalies and performance differences.


3.4 Summary
To evaluate the energy efficiency of the ARM Cortex-A8 and the Cortex-A9 MPCore,
compared to processors built on the x86-architecture for server tasks, a set of test hard-
ware has been used. To evaluate the performance of the Cortex-A8 a BeagleBoard
is used. Evaluating the Cortex-A9 is done using a Tegra 200 development kit with a
Tegra 250 chip, and a Versatile Express with a CoreTile Express. An Apache 2.2 HTTP
server is used to evaluate the energy efficiency of the Cortex-A9 MPCore processor,
compared to an Intel Xeon processor when serving static files to clients. The perfor-
mance for running the Erlang VM on the test machines is evaluated directly using a set
of micro benchmarks, as well as a Erlang based SIP-Proxy.


                                           31
4 P ERFORMANCE COMPARISON

This chapter explains the individual executions of the benchmarks. After each bench-
mark execution the corresponding results are presented. The results from the execu-
tions are followed by performance comparisons. After the pure performance compar-
isons the energy efficiencies will be compared. All energy efficiency comparisons in
this chapter focus on the energy consumption off the processors themselves, rather than
on the total consumption of the computers being benchmarked.


4.1 Apache results
After reaching its peak performance in this particular test the performance of the Ver-
satile Express dropped quickly, and in the end made the server unresponsive. This can
be seen in Figure 4.1. This happened sometimes before reaching full CPU utilization.
A reason for this could be the network implementation on the Versatile Express. If
enough interrupts are generated in order to handle TCP packets it eventually leads to
a situation where an increasing part of the runtime is used up by interrupts and thus
leaving a decreasing amount of resources available to actually provide the intended
service. This has not been proven to be the case here, but is a viable possibility. To
deal with the unresponsiveness the test machine was restarted between tests.
    When benchmarking the machine with the two Intel Quad Core Xeon E5430 pro-
cessors using the same test parameters as for the rest of the machines, the test proved to
not be CPU intensive enough as full CPU utilization was not achieved. In order to find
the bottleneck, the number of clients was increased. The test was run using both ten
and five client machines. As the results were the same in both tests the performance
of the client machines was not a bottleneck. The bandwidth was tested by redoing the
test using a larger file than the original. The result from the test with the larger file was
close to that of the original test, with the biggest difference being a higher bandwidth


                                            32
Figure 4.1: Comparison between CoreTile Express, Tegra and an Intel Pentium 4 pow-
ered machine running the Apache HTTP server.


usage. The system reported no shortage of available memory in any of the Apache
HTTP server benchmarks.
    The machine with the two Quad Core Xeons was able to serve 36000 requests
per second when a hundred requests were made for each connection. For ten requests
for each connection the result was only 6200 requests/s. The data transfer during the
test with 36000 requests per second was reported by Autobench to be 11600 KBps.
Compared to the theoretical maximum bandwidth for a gigabit network (131072 KBps)
the used bandwidth was less than 10 percent. Although the theoretical bandwidth is
generally not achieved in a real life network, more than 10 percent is achievable. In
addition, higher data transfer rates from the same server, using the same network was
achieved using a larger file. As the network seemed an unlikely bottleneck, other parts
of the test setup was inspected. The machine running the Apache server reported 60


                                         33
percent CPU utilization for the test with 36000 requests and 10 percent for the test with
6200 requests. If the CPU utilization level and web server performance would continue
having the same relation to each other, the performance in both cases is around 60000
requests per second with full CPU utilization. Figure 4.2 show the CPU utilization
at a few points during the Apache test for the dual E5430 machine. Assuming the
performance for one E5430 running at 100 percent is the same as the performance
of two running at 50 percent, the performance for one E5430 is 33000 requests per
second.


Figure 4.2: CPU utilization during test on machine with two Quad Core Intel Xeon
E5430 processors


    The results from the Apache test shown in Table 4.1 are from fetching a static file
of size 10 Bytes. 10 Calls per connection and 100 calls per connection were requested
in the tests. The better results from the two benchmarks were used. The performance
for the Tegra 250 was more or less the same when making ten or a hundred requests
for each connection. For the comparison machine with the two Xeon processors the
difference was approximately a multiple of ten. The better results were used for the

                                           34
Machine                                             Request / second Requests / Joule
 Quad Core Intel Xeon E5430 (2.66 GHz, 80 W)         33000               413
 Pentium 4 (2.8GHz)                                  7100                80
 Dual Core Cortex-A9 MPCore (1 GHz)                  4600                4600
 Quad Core Cortex-A9 MPCore (400 MHz)                3400                2833
 Cortex-A8 (600 MHz)                                 760                 760


Table 4.1: Ability of Apache 2.2 to serve a 10 byte static files using different hardware


comparison. The test results can be seen in Table 4.1. As it can be seen in the table the
Tegra 250 managed to serve 4600 requests per second and the Versatile Express 3400
requests per second. The performance difference of the Versatile Express compared
to the Tegra 250 is likely caused by both the slower clock frequency of the CPU and
the network implementation. The difference in combined clock frequencies between
the two processors on its own is slightly less than the performance difference. The
combined number of clock ticks for the Versatile Express is (400 * 4) 1600 and 2000
(1000 * 2) for the Tegra 250. Comparing these, the Versatile Express has 80 percent
of the clock ticks of the Tegra 250. The performance of the Versatile Express is in
comparison slightly less, 74 percent of that of the Tegra 250.
    The results from the Apache tests were mainly compared against a machine with
two Intel Quad Core Xeon processors running at 2.66 GHz. To provide a more com-
prehensive comparison, and more reference points a machine with a Pentium 4 (2.8
GHz) was also benchmarked. While the machine that has the more traditional server
processors outperforms the tested Cortex-A9 processors, the Cortex-A9 processors do
well taking their energy consumption into account. The Intel Xeon processor (E5430)
that was used in the reference machine has a reported maximum thermal design power
(TDP) of 80 W, while the Quad Core Cortex-A9 according to performed tests has a
maximum measured power consumption of 1.2 W.
    The rightmost column in table 4.1 shows the number of answered calls produced
per Joule used. A clear improvement in energy efficiency is visible, starting from the
Pentium 4 to the Dual Core ARM Cortex-A9 MPCore. Figure 4.3 shows the energy
efficiency comparison as a bar diagram.
    Figure 4.3 indicates a energy efficiency of about 6,9 times the performance per


                                           35
Joule for the Versatile Express compared to the Intel Xeon. The results can be assumed
to be a bit better for the Intel Xeon in practice when its actual power consumption is
taken into account. The actual power dissipation of the Quad Core ARM was, however,
also below 1 W during the test rather than the measured maximum of 1.2 Watts that
was used for the calculations. As there are no actual numbers available for the power
consumption of the CPU on the Tegra 250 board the estimate of 1 W is used for its
power consumption. For the Tegra 250 the energy efficiency compared to the reference
Intel Xeon processor was approximately 11,1 times better. A clear improvement in
energy efficiency is also visible between the Pentium 4 processor and the Xeon. This
improvement is an indication on the energy efficiency improvement for Intel’s x86
based processors. One of the major improvements from the Pentium 4 to the Xeon
L5430 is the manufacturing technology that has improved from 90 nm to 45 nm.


      Figure 4.3: Number of requests handled for each Joule used by the CPU


4.2 Emark results
A set of benchmarks called Emark was used to evaluate the performance of the erts.
The benchmarks are meant to be used for evaluating Erts and its performance on par-
ticular hardware. The tests packet included a set of baseline results for comparison.

                                         36
The benchmarks can be used to test the performance of either different erts implemen-
tations or to compare different hardware against each other. In the results the same
versions of the erts was used in order to make the results as much dependent on the
differences in hardware as possible, rather than differences in software. The different
benchmarks returns results using different metrics, some measure time while other the
number of transactions and the Stones test gives the results in “stones”. All the results
shown here are a comparison to the baseline results if not something else is mentioned.
They are to be interpreted as how many times worse the tested systems performed than
the baseline. Regardless of the metrics in the original benchmarks. A lower score in
these results is always better and should be interpreted as how many of these machines
would theoretically, in a perfect world, and without any overhead be needed to replace
the baseline machine in the particular test. The machine used for the baseline has a
Dual Core Intel E6600. The chip is built using a 65 nm technology and has a TDP of
65 W [28].
    Among the tests that were run was a message passing test called “big bang”. It
creates a thousand processes and every process sends a “ping” message to every other
process, every process that receives a “ping” responds with a “pong” message. An
advantage to the message passing test in the Stones benchmark is that it is capable of
using more than one core. The inability to effectively use more than one core at a time
is something that holds true for all the tests in the Stones benchmarks. This can easily
be seen in Appendix A. Table 4.2 shows how the different machines performed in
the benchmark compared to the baseline results. All results in the table are measured
using as many OS processes as there are available cores on the particular test machine.
The BeagleBoard uses an erts implementation without SMP support and the others
runs SMP enabled erts implementations. Most of the benchmarks here have been run
several times with different parameters and the results in the table are average values.
If results for some test was not available the results from the corresponding test on
the other machines has also been omitted. Short explanations of what the different
benchmarks test are given in Table 4.3.
    Most of the benchmarks in Table 4.3 gets better results when using more than
one scheduler, there are, however, some exceptions. The results show that the bench-
marks codec, containers and Msgq does not gain any benefit from using more than one
scheduler.


                                           37
Test              BeagleBoard CoreTile Express Tegra 250
       Bang              17.8            14.2              6.7
       Big               38.8            12.3              9.7
       Chameneosredux    5.6             17.3              6.7
       Codec             19.4            19.9              7.0
       Containers        34.4            30.2              14.1
       Ets _ test        10.7            5.9               3.7
       Genstress         17.6            14.4              7.6
       Mbrot             40.3            12.9              8.5
       Msgq              1.0             1.5               0.9
       Netio             29.3            12.4              12.6

Table 4.2: Performance of ARM test machines compared to Baseline results


Test               Explanation
Bang               All to one message passing
Big                All to all message passing
Chameneosredux     Shake hands with everyone
Codec              Encode Decode binaries (test binary to term)
Containers         Adds and lookups in containers (ADT’s)
Ets _ test         Ets insert/lookup (also in parallel)
Genstress          Genserver test
Mbrot              Mandelbrot calculations (concurrent, number crunching)
Msgq               Message queue bashing
Netio              TCP messages

          Table 4.3: Explanations on what the benchmarks evaluate


                                    38
SMP1      SMP2       SMP3      SMP4
                 Baseline        12998 10820
                 BeagleBoard     284375
                 V2P-CA9         248217 141691 105538 106230
                 Tegra 250       102404 102403

                       Table 4.4: Results from Netio benchmark


    The benchmark named Netio that tests TCP messages shows an interesting behav-
ior. The results from the benchmark are visible in table 4.4. As a difference to table
4.2 the results in this table are the direct output from the benchmark. According to the
source code for the benchmark the values represents milliseconds. A lower result is
better. In this particular test run the following test parameters were used. 200 Connec-
tions, 1000 packets and a packet size of 10000. There is a clear increase in performance
when adding more schedulers from one to three for the V2P-CA9. Between three and
four schedulers the test shows no further improvement, it actually show a decrease.
The decrease is still small enough to be discarded, due to the fact that the test results
differ slightly between the different test runs. For the Tegra 250 the results for one and
two schedulers are basically identical. The difference between the best results for the
CoreTile Express and the Tegra 250 is only three percent. The benchmark is designed
to stress the packet receive and accept processes and is not affected by external factors,
as it is not dependent on I/O.
    The results from the Stones benchmark is shown in Table 4.5. The table shows that
the performance of the Tegra 250 is consistently better than the one of the V2P-CA9.
The interesting thing is that the BeagleBoard outperforms not just the CoreTile Express
but also the Tegra 250 in some of the benchmarks. As only the Links benchmark is able
to gain any benefit of using more than one core the BeagleBoard has an advantage over
the CoreTile Express with its higher clock frequency in the rest of the benchmarks. In
the small and medium message passing benchmark, it is even faster than the Tegra 250.


                                           39
Test                                 BeagleBoard CoreTile Express Tegra 250

List manipulation                    26             25                 11
Small messages (message passing)     10             35                 14
Medium messages                      13             34                 14
Huge messages                        17             28                 11
Pattern matching                     32             30                 14
Traverse                             35             27                 13
Work with large dataset              32             26                 12
Work with large local dataset        35             28                 13
Alloc and dealloc                    22             23                 10
Bif dispatch                         11             18                 7
Binary handling                      15             27                 11
Ets datadictionary                   27             46                 19
Generic server (with timeout)        15             37                 15
Small Integer arithmetic             30             23                 12
Float arithmetic                     31             37                 9
Function calls                       38             30                 13
Timers                               10             26                 8
Links                                18             9                  8

       Table 4.5: Results from the Stones benchmark compared to the baseline


                                          40
4.3 SIP-Proxy results
Ericsson provided reference results for the benchmark. The machine used for this
comparison has two Quad-Core Intel Xeon L5430 processors running at 2.66GHz.
The test result for the reference machine is presented in table 4.7. If the CPU is
the bottleneck the performance increase is approximately dependent on the amount of
CPU resources available, in this case, the number of cores. As visible in Table 4.7
this is not the case. There is a significant performance improvement all the way from
one scheduler (SMP1) to four schedulers (SMP4). When the number of schedulers
is increased from four to eight, there is only an increase of 50 calls/s, although the
number of available schedulers, and thereby cores, has doubled. This indicates that
the results are dependent on something else than the pure processing power of the
processors. As the focus is on processor performance and energy efficiency, results
that are not dependent on the processors themselves, is to be avoided. Only the results
from one to four cores will be used, in practice considering the reference machine as
having only one Quad-Core processor, using only the energy required by one, rather
than two processors. An issue with comparing the energy efficient in this test is that
the only energy consumption data available is the TDP information provided by the
manufacturer. According to the information available on Intel web page the maximum
TDP of the L5430 is 50W and that it is manufactured using a 45 nm process [14]. In
the datasheet for the 5400 series on page 87 however, it is stated that the TDP for the
L5400 series is also 50 W [13].
    When evaluating the performance of the SIP-Proxy the Versatile express was able
to handle 30 calls/s. The reference machine with its Intel Xeon L5430 was able to
handle 350 calls/s. Both machines were tested using different numbers of schedulers
(1-4), these results can be seen in Table 4.8. By taking into account that the CPU of
the reference machine has a maximum TDP of 50 W compared to the measured maxi-
mum consumption of 1.2 W used by the Cortex-A9, the Cortex-A9 performs well. By
comparing the throughputs and the power consumptions, it can be seen that the Cortex-
A9 can handle 3.5 times more traffic for each watt it dissipates compared to the Intel
Xeon. An issue in this comparison is that the energy consumption listed for the Xeon
is according to the manufacturer rated TDP, and not actual measured maximum energy
consumption. To compensate for this the maximum measured energy consumption for
the Quad Core Cortex-A9 is also used for comparison. The power consumption during
the benchmark was measured using the VD10_S3 register on the CoreTile Express,

                                          41
Calls/s CPU utilization Power avg
                        1         19                 0.54
                        5         38                 0.65
                        10        51                 0.66
                        15        66                 0.85
                        25        88                 0.91
                        30        98                 0.95

Table 4.6: CPU utilization and average CPU power consumption for the CoreTile Ex-
press during SIP-Proxy benchmark


                                    SMP1 SMP2 SMP4 SMP8
                  Calls / Second 130         240      350      400

Table 4.7: Performance of reference machine with two Quad Core Xeons with different
numbers of schedulers


and the average values are shown in Table 4.6, together with the CPU utilization and
the number of calls the proxy was subjected to. During this particular test where the
energy consumption was measured, SMP 8 was used. The power consumption is also
presented in graph 4.5. It is noteworthy that no DVFS is available on the CoreTile Ex-
press reducing the possibilities for precise reduction of energy consumption in relation
to the load.
    As the erts does not generally benefit from using more schedulers than there are
available CPU cores on the host machine, the results for those tests are not listed here.
The strange thing about these test results is that the Tegra 250 performs significantly
worse than the Versatile Express. In other benchmarks the Tegra 250 has consistently
over performed the CoreTile Express, except in this and the TCP message benchmark,
that is part of the basic Erlang benchmarking presented previously in this chapter.
While the Versatile has the advantage of having double the number of CPU cores the

                                           42
Figure 4.4: Graph showing the CPU utilization for CoreTile Express during SIP-Proxy
benchmark


Tegra 250 has more than double the clock frequency on its cores. As visible in Table
4.8, the performance for the Versatile Express and the Tegra 250 is very similar when
using the same number of cores. When using one core the difference could be due
to a static overhead of running the proxy but the results from using two cores are not
as easily dismissible. The main question here is why an almost identical performance
increase is achieved when adding a core running at 400 MHz and one at 1000 MHz.
If the test machine running at 1 GHz would not report almost full CPU utilization, it
would be clear that the CPU is not the bottleneck, but this is not the case here.
    As the performance of the proxy when running on the Tegra 250 was not as ex-
pected from the technical data available and our previous benchmarks, additional steps
to certify the results were taken. The erts on both the Tegra 250 and the CoreTile Ex-
press was recompiled from the same source in the same way using the same version of
GCC and using the same version of the libatomic library (7.2 alpha 4). As this did not
cause any difference in the results the erts was again recompiled with a few changes
to support profiling using Gprof. The performance on the CoreTile Express was af-

                                         43
Figure 4.5: Power consumption for the CPU in CoreTile Express during SIP-Proxy
test


fected more by running Gprof than the Tegra 250. With the profiling enabled the Tegra
250 could handle nine calls per second, while the CoreTile Express could handle six
for a two minute period using SMP2, as can be seen in table 4.9. A test was then
performed using five calls per second and SMP2 for two minutes on both machines,
while profiling using Gprof. The biggest difference between the number of function
calls and time spent in different functions, was in functions that have to do with atomic
read functions. This is caused by the fact that the schedulers are frequently left without
work, and at that point, in an attempt to optimize, spins over a variable to check for
more work. To match the throughput between the two test machines the Tegra was
not under maximum load causing the schedulers to be without work more often than
on the V2P-CA9. Other significant differences were not observed. In order to profile
system wide rather than just the erts the kernels on both the Tegra 250 and the CoreTile
Express was recompiled to support Oprofile. Oprofile showed that when running on as
high load as possible the Tegra 250 spent 31,6 % of its time running vmlinux, while
the CoreTile Express spent 20,6 %. The times spent running the erts were 65 % and

                                           44
Figure 4.6: Graph showing performance of reference machine with two Quad Core
Xeons using an increasing number of schedulers


67 %.
    To make sure the issue was not caused by problems with the OS the installation on
the Tegra 250 was replaced by a backup of a older version of Ubuntu that the board
had originally been tested with, before the evaluation started, and thereby the changes
possibly caused by it. The results remained the same from the previous tests. Being
unable to find a reason for the benchmark results even after great effort ARM agreed
to redo the measurements. They same erts was used and the same installation of the
proxy-server. The kernels used were also compiled separately although both were of
version 2.6.32. ARM reported the same results as produced earlier with the Tegra 250.
The cause for the unexpected performance difference is still unknown.
    The energy efficiency for the SIP-Proxy is shown in Figure 4.7. The energy ef-
ficiency difference between the Versatile Express and the Tegra 250 is close to the
performance difference, around half. Compared to the Versatile Express the Xeon uses
approximately 3.6 times more energy for each call. Compared to the Tegra 250 the

                                          45
SMP Intel Xeon Quad Core Cortex-A9 Dual Core Cortex-A9
             (2.66GHz) MPCore (400MHz)      MPCore (1 GHz)
         1      130          5                        5
         2      240          12                       13
         4      350          30                       13

Table 4.8: How many calls the SIP-Proxy can handle using different hardware and
number of schedulers


                      SMP      CoreTile Express Tegra 250
                      SMP4 10                     9
                      SMP2 6

Table 4.9: How many calls the SIP-Proxy on can handle on the CoreTile Express and
Tegra 250 while profiling using Gprof


        Figure 4.7: Number of calls handled for each Joule used by the CPU


energy consumption is approximately 1.9 higher for the Xeon.


                                        46
4.4 Summary
The performance of the test machines with the ARMv7 -architecture based processors
have been compared to machines with x86 -architecture based processors. While the
individual performance of the more energy efficient ARM processors is lower than that
for the processors traditionally used in servers, the energy efficiency is better. In the
Apache HTTP server benchmark the energy efficiency of the Dual Core Cortex-A9
processor was over 11 times that of the Intel Xeon E5430. The processor with the best
energy efficiency in the SIP-Proxy benchmark was the Quad Core Cortex-A9 with a
3.5 times better energy efficiency compared to the Intel Xeon L5430.


                                          47
ENERGY EFFICIENCY OF ARM ARCHITECTURES FOR CLOUD COMPUTING APPLICATIONS

More Related Content

What's hot

Deployment guide series ibm tivoli composite application manager for web reso...
Deployment guide series ibm tivoli composite application manager for web reso...Deployment guide series ibm tivoli composite application manager for web reso...
Deployment guide series ibm tivoli composite application manager for web reso...Banking at Ho Chi Minh city
 
D3.1. Specification of Functional Requirements Satisfying User Information Needs
D3.1. Specification of Functional Requirements Satisfying User Information NeedsD3.1. Specification of Functional Requirements Satisfying User Information Needs
D3.1. Specification of Functional Requirements Satisfying User Information NeedsLinkedTV
 
No SQL Databases (a thorough analysis)
No SQL Databases (a thorough analysis)No SQL Databases (a thorough analysis)
No SQL Databases (a thorough analysis)catprasanna
 
Spring data-keyvalue-reference
Spring data-keyvalue-referenceSpring data-keyvalue-reference
Spring data-keyvalue-referencedragos142000
 
Solution deployment guide for ibm tivoli composite application manager for we...
Solution deployment guide for ibm tivoli composite application manager for we...Solution deployment guide for ibm tivoli composite application manager for we...
Solution deployment guide for ibm tivoli composite application manager for we...Banking at Ho Chi Minh city
 
Aidan_O_Mahony_Project_Report
Aidan_O_Mahony_Project_ReportAidan_O_Mahony_Project_Report
Aidan_O_Mahony_Project_ReportAidan O Mahony
 
BE Project Final Report on IVRS
BE Project Final Report on IVRSBE Project Final Report on IVRS
BE Project Final Report on IVRSAbhishek Nadkarni
 
Tree structured partitioning into transform blocks and units and interpicture...
Tree structured partitioning into transform blocks and units and interpicture...Tree structured partitioning into transform blocks and units and interpicture...
Tree structured partitioning into transform blocks and units and interpicture...LainAcarolu
 
D2.1. Specification of The Media Fragment URI Scheme
D2.1. Specification of The Media Fragment URI SchemeD2.1. Specification of The Media Fragment URI Scheme
D2.1. Specification of The Media Fragment URI SchemeLinkedTV
 
Implementing tws extended agent for tivoli storage manager sg246030
Implementing tws extended agent for tivoli storage manager   sg246030Implementing tws extended agent for tivoli storage manager   sg246030
Implementing tws extended agent for tivoli storage manager sg246030Banking at Ho Chi Minh city
 
D2.2. Specification of lightweight metadata models for multimedia annotation
D2.2. Specification of lightweight metadata models for multimedia annotationD2.2. Specification of lightweight metadata models for multimedia annotation
D2.2. Specification of lightweight metadata models for multimedia annotationLinkedTV
 
Deployment guide series ibm tivoli ccmdb overview and deployment planning sg2...
Deployment guide series ibm tivoli ccmdb overview and deployment planning sg2...Deployment guide series ibm tivoli ccmdb overview and deployment planning sg2...
Deployment guide series ibm tivoli ccmdb overview and deployment planning sg2...Banking at Ho Chi Minh city
 
Dbe emailer software documentation user guide
Dbe emailer software documentation user guideDbe emailer software documentation user guide
Dbe emailer software documentation user guideaxegrinder67
 

What's hot (18)

Deployment guide series ibm tivoli composite application manager for web reso...
Deployment guide series ibm tivoli composite application manager for web reso...Deployment guide series ibm tivoli composite application manager for web reso...
Deployment guide series ibm tivoli composite application manager for web reso...
 
iPDC Report Kedar
iPDC Report KedariPDC Report Kedar
iPDC Report Kedar
 
D3.1. Specification of Functional Requirements Satisfying User Information Needs
D3.1. Specification of Functional Requirements Satisfying User Information NeedsD3.1. Specification of Functional Requirements Satisfying User Information Needs
D3.1. Specification of Functional Requirements Satisfying User Information Needs
 
No SQL Databases (a thorough analysis)
No SQL Databases (a thorough analysis)No SQL Databases (a thorough analysis)
No SQL Databases (a thorough analysis)
 
Spring data-keyvalue-reference
Spring data-keyvalue-referenceSpring data-keyvalue-reference
Spring data-keyvalue-reference
 
Solution deployment guide for ibm tivoli composite application manager for we...
Solution deployment guide for ibm tivoli composite application manager for we...Solution deployment guide for ibm tivoli composite application manager for we...
Solution deployment guide for ibm tivoli composite application manager for we...
 
Aidan_O_Mahony_Project_Report
Aidan_O_Mahony_Project_ReportAidan_O_Mahony_Project_Report
Aidan_O_Mahony_Project_Report
 
BE Project Final Report on IVRS
BE Project Final Report on IVRSBE Project Final Report on IVRS
BE Project Final Report on IVRS
 
Tree structured partitioning into transform blocks and units and interpicture...
Tree structured partitioning into transform blocks and units and interpicture...Tree structured partitioning into transform blocks and units and interpicture...
Tree structured partitioning into transform blocks and units and interpicture...
 
Performance tuning for content manager sg246949
Performance tuning for content manager sg246949Performance tuning for content manager sg246949
Performance tuning for content manager sg246949
 
final (1)
final (1)final (1)
final (1)
 
Sdr
SdrSdr
Sdr
 
D2.1. Specification of The Media Fragment URI Scheme
D2.1. Specification of The Media Fragment URI SchemeD2.1. Specification of The Media Fragment URI Scheme
D2.1. Specification of The Media Fragment URI Scheme
 
Implementing tws extended agent for tivoli storage manager sg246030
Implementing tws extended agent for tivoli storage manager   sg246030Implementing tws extended agent for tivoli storage manager   sg246030
Implementing tws extended agent for tivoli storage manager sg246030
 
D2.2. Specification of lightweight metadata models for multimedia annotation
D2.2. Specification of lightweight metadata models for multimedia annotationD2.2. Specification of lightweight metadata models for multimedia annotation
D2.2. Specification of lightweight metadata models for multimedia annotation
 
Deployment guide series ibm tivoli ccmdb overview and deployment planning sg2...
Deployment guide series ibm tivoli ccmdb overview and deployment planning sg2...Deployment guide series ibm tivoli ccmdb overview and deployment planning sg2...
Deployment guide series ibm tivoli ccmdb overview and deployment planning sg2...
 
My PhD Thesis
My PhD Thesis My PhD Thesis
My PhD Thesis
 
Dbe emailer software documentation user guide
Dbe emailer software documentation user guideDbe emailer software documentation user guide
Dbe emailer software documentation user guide
 

Viewers also liked

SFO15-407: Performance Overhead of ARM Virtualization
SFO15-407: Performance Overhead of ARM VirtualizationSFO15-407: Performance Overhead of ARM Virtualization
SFO15-407: Performance Overhead of ARM VirtualizationLinaro
 
Shoot4U: Using VMM Assists to Optimize TLB Operations on Preempted vCPUs
Shoot4U: Using VMM Assists to Optimize TLB Operations on Preempted vCPUsShoot4U: Using VMM Assists to Optimize TLB Operations on Preempted vCPUs
Shoot4U: Using VMM Assists to Optimize TLB Operations on Preempted vCPUsJiannan Ouyang, PhD
 
Achieving Performance Isolation with Lightweight Co-Kernels
Achieving Performance Isolation with Lightweight Co-KernelsAchieving Performance Isolation with Lightweight Co-Kernels
Achieving Performance Isolation with Lightweight Co-KernelsJiannan Ouyang, PhD
 
Denser, cooler, faster, stronger: PHP on ARM microservers
Denser, cooler, faster, stronger: PHP on ARM microserversDenser, cooler, faster, stronger: PHP on ARM microservers
Denser, cooler, faster, stronger: PHP on ARM microserversJez Halford
 
LinuxCon2009: 10Gbit/s Bi-Directional Routing on standard hardware running Linux
LinuxCon2009: 10Gbit/s Bi-Directional Routing on standard hardware running LinuxLinuxCon2009: 10Gbit/s Bi-Directional Routing on standard hardware running Linux
LinuxCon2009: 10Gbit/s Bi-Directional Routing on standard hardware running Linuxbrouer
 
Preemptable ticket spinlocks: improving consolidated performance in the cloud
Preemptable ticket spinlocks: improving consolidated performance in the cloudPreemptable ticket spinlocks: improving consolidated performance in the cloud
Preemptable ticket spinlocks: improving consolidated performance in the cloudJiannan Ouyang, PhD
 
Balance, Flexibility, and Partnership: An ARM Approach to Future HPC Node Arc...
Balance, Flexibility, and Partnership: An ARM Approach to Future HPC Node Arc...Balance, Flexibility, and Partnership: An ARM Approach to Future HPC Node Arc...
Balance, Flexibility, and Partnership: An ARM Approach to Future HPC Node Arc...Eric Van Hensbergen
 
SDN - OpenFlow + OpenVSwitch + Quantum
SDN - OpenFlow + OpenVSwitch + QuantumSDN - OpenFlow + OpenVSwitch + Quantum
SDN - OpenFlow + OpenVSwitch + QuantumThe Linux Foundation
 
Effect of Virtualization on OS Interference
Effect of Virtualization on OS InterferenceEffect of Virtualization on OS Interference
Effect of Virtualization on OS InterferenceEric Van Hensbergen
 
Q2.12: Research Update on big.LITTLE MP Scheduling
Q2.12: Research Update on big.LITTLE MP SchedulingQ2.12: Research Update on big.LITTLE MP Scheduling
Q2.12: Research Update on big.LITTLE MP SchedulingLinaro
 
DOXLON November 2016: Facebook Engineering on cgroupv2
DOXLON November 2016: Facebook Engineering on cgroupv2DOXLON November 2016: Facebook Engineering on cgroupv2
DOXLON November 2016: Facebook Engineering on cgroupv2Outlyer
 
reference_guide_Kernel_Crash_Dump_Analysis
reference_guide_Kernel_Crash_Dump_Analysisreference_guide_Kernel_Crash_Dump_Analysis
reference_guide_Kernel_Crash_Dump_AnalysisBuland Singh
 
Linux Device Driver parallelism using SMP and Kernel Pre-emption
Linux Device Driver parallelism using SMP and Kernel Pre-emptionLinux Device Driver parallelism using SMP and Kernel Pre-emption
Linux Device Driver parallelism using SMP and Kernel Pre-emptionHemanth Venkatesh
 
Memory Barriers in the Linux Kernel
Memory Barriers in the Linux KernelMemory Barriers in the Linux Kernel
Memory Barriers in the Linux KernelDavidlohr Bueso
 
How Ceph performs on ARM Microserver Cluster
How Ceph performs on ARM Microserver ClusterHow Ceph performs on ARM Microserver Cluster
How Ceph performs on ARM Microserver ClusterAaron Joue
 
Linux cgroups and namespaces
Linux cgroups and namespacesLinux cgroups and namespaces
Linux cgroups and namespacesLocaweb
 
Smarter Scheduling (Priorities, Preemptive Priority Scheduling, Lottery and S...
Smarter Scheduling (Priorities, Preemptive Priority Scheduling, Lottery and S...Smarter Scheduling (Priorities, Preemptive Priority Scheduling, Lottery and S...
Smarter Scheduling (Priorities, Preemptive Priority Scheduling, Lottery and S...David Evans
 
SFO15-BFO2: Reducing the arm linux kernel size without losing your mind
SFO15-BFO2: Reducing the arm linux kernel size without losing your mindSFO15-BFO2: Reducing the arm linux kernel size without losing your mind
SFO15-BFO2: Reducing the arm linux kernel size without losing your mindLinaro
 

Viewers also liked (20)

SFO15-407: Performance Overhead of ARM Virtualization
SFO15-407: Performance Overhead of ARM VirtualizationSFO15-407: Performance Overhead of ARM Virtualization
SFO15-407: Performance Overhead of ARM Virtualization
 
Shoot4U: Using VMM Assists to Optimize TLB Operations on Preempted vCPUs
Shoot4U: Using VMM Assists to Optimize TLB Operations on Preempted vCPUsShoot4U: Using VMM Assists to Optimize TLB Operations on Preempted vCPUs
Shoot4U: Using VMM Assists to Optimize TLB Operations on Preempted vCPUs
 
Achieving Performance Isolation with Lightweight Co-Kernels
Achieving Performance Isolation with Lightweight Co-KernelsAchieving Performance Isolation with Lightweight Co-Kernels
Achieving Performance Isolation with Lightweight Co-Kernels
 
Denser, cooler, faster, stronger: PHP on ARM microservers
Denser, cooler, faster, stronger: PHP on ARM microserversDenser, cooler, faster, stronger: PHP on ARM microservers
Denser, cooler, faster, stronger: PHP on ARM microservers
 
Docker by demo
Docker by demoDocker by demo
Docker by demo
 
Cache profiling on ARM Linux
Cache profiling on ARM LinuxCache profiling on ARM Linux
Cache profiling on ARM Linux
 
LinuxCon2009: 10Gbit/s Bi-Directional Routing on standard hardware running Linux
LinuxCon2009: 10Gbit/s Bi-Directional Routing on standard hardware running LinuxLinuxCon2009: 10Gbit/s Bi-Directional Routing on standard hardware running Linux
LinuxCon2009: 10Gbit/s Bi-Directional Routing on standard hardware running Linux
 
Preemptable ticket spinlocks: improving consolidated performance in the cloud
Preemptable ticket spinlocks: improving consolidated performance in the cloudPreemptable ticket spinlocks: improving consolidated performance in the cloud
Preemptable ticket spinlocks: improving consolidated performance in the cloud
 
Balance, Flexibility, and Partnership: An ARM Approach to Future HPC Node Arc...
Balance, Flexibility, and Partnership: An ARM Approach to Future HPC Node Arc...Balance, Flexibility, and Partnership: An ARM Approach to Future HPC Node Arc...
Balance, Flexibility, and Partnership: An ARM Approach to Future HPC Node Arc...
 
SDN - OpenFlow + OpenVSwitch + Quantum
SDN - OpenFlow + OpenVSwitch + QuantumSDN - OpenFlow + OpenVSwitch + Quantum
SDN - OpenFlow + OpenVSwitch + Quantum
 
Effect of Virtualization on OS Interference
Effect of Virtualization on OS InterferenceEffect of Virtualization on OS Interference
Effect of Virtualization on OS Interference
 
Q2.12: Research Update on big.LITTLE MP Scheduling
Q2.12: Research Update on big.LITTLE MP SchedulingQ2.12: Research Update on big.LITTLE MP Scheduling
Q2.12: Research Update on big.LITTLE MP Scheduling
 
DOXLON November 2016: Facebook Engineering on cgroupv2
DOXLON November 2016: Facebook Engineering on cgroupv2DOXLON November 2016: Facebook Engineering on cgroupv2
DOXLON November 2016: Facebook Engineering on cgroupv2
 
reference_guide_Kernel_Crash_Dump_Analysis
reference_guide_Kernel_Crash_Dump_Analysisreference_guide_Kernel_Crash_Dump_Analysis
reference_guide_Kernel_Crash_Dump_Analysis
 
Linux Device Driver parallelism using SMP and Kernel Pre-emption
Linux Device Driver parallelism using SMP and Kernel Pre-emptionLinux Device Driver parallelism using SMP and Kernel Pre-emption
Linux Device Driver parallelism using SMP and Kernel Pre-emption
 
Memory Barriers in the Linux Kernel
Memory Barriers in the Linux KernelMemory Barriers in the Linux Kernel
Memory Barriers in the Linux Kernel
 
How Ceph performs on ARM Microserver Cluster
How Ceph performs on ARM Microserver ClusterHow Ceph performs on ARM Microserver Cluster
How Ceph performs on ARM Microserver Cluster
 
Linux cgroups and namespaces
Linux cgroups and namespacesLinux cgroups and namespaces
Linux cgroups and namespaces
 
Smarter Scheduling (Priorities, Preemptive Priority Scheduling, Lottery and S...
Smarter Scheduling (Priorities, Preemptive Priority Scheduling, Lottery and S...Smarter Scheduling (Priorities, Preemptive Priority Scheduling, Lottery and S...
Smarter Scheduling (Priorities, Preemptive Priority Scheduling, Lottery and S...
 
SFO15-BFO2: Reducing the arm linux kernel size without losing your mind
SFO15-BFO2: Reducing the arm linux kernel size without losing your mindSFO15-BFO2: Reducing the arm linux kernel size without losing your mind
SFO15-BFO2: Reducing the arm linux kernel size without losing your mind
 

Similar to ENERGY EFFICIENCY OF ARM ARCHITECTURES FOR CLOUD COMPUTING APPLICATIONS

I Pdc V1.3.0 A Complete Technical Report Including I Pdc, Pmu Simulator, An...
I Pdc V1.3.0   A Complete Technical Report Including I Pdc, Pmu Simulator, An...I Pdc V1.3.0   A Complete Technical Report Including I Pdc, Pmu Simulator, An...
I Pdc V1.3.0 A Complete Technical Report Including I Pdc, Pmu Simulator, An...Nitesh Pandit
 
The Dissertation
The DissertationThe Dissertation
The Dissertationphooji
 
Thesis: Slicing of Java Programs using the Soot Framework (2006)
Thesis:  Slicing of Java Programs using the Soot Framework (2006) Thesis:  Slicing of Java Programs using the Soot Framework (2006)
Thesis: Slicing of Java Programs using the Soot Framework (2006) Arvind Devaraj
 
Matlab tutorial by manish myst, ssgbcoet
Matlab tutorial by manish myst, ssgbcoetMatlab tutorial by manish myst, ssgbcoet
Matlab tutorial by manish myst, ssgbcoetManish Myst
 
Migrating to netcool precision for ip networks --best practices for migrating...
Migrating to netcool precision for ip networks --best practices for migrating...Migrating to netcool precision for ip networks --best practices for migrating...
Migrating to netcool precision for ip networks --best practices for migrating...Banking at Ho Chi Minh city
 
Deployment guide series ibm tivoli composite application manager for web reso...
Deployment guide series ibm tivoli composite application manager for web reso...Deployment guide series ibm tivoli composite application manager for web reso...
Deployment guide series ibm tivoli composite application manager for web reso...Banking at Ho Chi Minh city
 
Deployment guide series ibm tivoli compliance insight manager sg247531
Deployment guide series ibm tivoli compliance insight manager sg247531Deployment guide series ibm tivoli compliance insight manager sg247531
Deployment guide series ibm tivoli compliance insight manager sg247531Banking at Ho Chi Minh city
 
A Multi-Dimensional Compositional Approach for Business Process Engineering
A Multi-Dimensional Compositional Approach for Business Process EngineeringA Multi-Dimensional Compositional Approach for Business Process Engineering
A Multi-Dimensional Compositional Approach for Business Process EngineeringAng Chen
 
Avances Base Radial
Avances Base RadialAvances Base Radial
Avances Base RadialESCOM
 
Deployment guide series ibm tivoli usage and accounting manager v7.1 sg247569
Deployment guide series ibm tivoli usage and accounting manager v7.1 sg247569Deployment guide series ibm tivoli usage and accounting manager v7.1 sg247569
Deployment guide series ibm tivoli usage and accounting manager v7.1 sg247569Banking at Ho Chi Minh city
 

Similar to ENERGY EFFICIENCY OF ARM ARCHITECTURES FOR CLOUD COMPUTING APPLICATIONS (20)

I Pdc V1.3.0 A Complete Technical Report Including I Pdc, Pmu Simulator, An...
I Pdc V1.3.0   A Complete Technical Report Including I Pdc, Pmu Simulator, An...I Pdc V1.3.0   A Complete Technical Report Including I Pdc, Pmu Simulator, An...
I Pdc V1.3.0 A Complete Technical Report Including I Pdc, Pmu Simulator, An...
 
Home automation
Home automationHome automation
Home automation
 
The Dissertation
The DissertationThe Dissertation
The Dissertation
 
Thesis: Slicing of Java Programs using the Soot Framework (2006)
Thesis:  Slicing of Java Programs using the Soot Framework (2006) Thesis:  Slicing of Java Programs using the Soot Framework (2006)
Thesis: Slicing of Java Programs using the Soot Framework (2006)
 
Master_Thesis
Master_ThesisMaster_Thesis
Master_Thesis
 
phd thesis
phd thesisphd thesis
phd thesis
 
Matlab tutorial by manish myst, ssgbcoet
Matlab tutorial by manish myst, ssgbcoetMatlab tutorial by manish myst, ssgbcoet
Matlab tutorial by manish myst, ssgbcoet
 
Migrating to netcool precision for ip networks --best practices for migrating...
Migrating to netcool precision for ip networks --best practices for migrating...Migrating to netcool precision for ip networks --best practices for migrating...
Migrating to netcool precision for ip networks --best practices for migrating...
 
Report-V1.5_with_comments
Report-V1.5_with_commentsReport-V1.5_with_comments
Report-V1.5_with_comments
 
diss
dissdiss
diss
 
Deployment guide series ibm tivoli composite application manager for web reso...
Deployment guide series ibm tivoli composite application manager for web reso...Deployment guide series ibm tivoli composite application manager for web reso...
Deployment guide series ibm tivoli composite application manager for web reso...
 
Knapp_Masterarbeit
Knapp_MasterarbeitKnapp_Masterarbeit
Knapp_Masterarbeit
 
Di11 1
Di11 1Di11 1
Di11 1
 
Deployment guide series ibm tivoli compliance insight manager sg247531
Deployment guide series ibm tivoli compliance insight manager sg247531Deployment guide series ibm tivoli compliance insight manager sg247531
Deployment guide series ibm tivoli compliance insight manager sg247531
 
Deployment guide series ibm tivoli compliance insight manager sg247531
Deployment guide series ibm tivoli compliance insight manager sg247531Deployment guide series ibm tivoli compliance insight manager sg247531
Deployment guide series ibm tivoli compliance insight manager sg247531
 
Matconvnet manual
Matconvnet manualMatconvnet manual
Matconvnet manual
 
A Multi-Dimensional Compositional Approach for Business Process Engineering
A Multi-Dimensional Compositional Approach for Business Process EngineeringA Multi-Dimensional Compositional Approach for Business Process Engineering
A Multi-Dimensional Compositional Approach for Business Process Engineering
 
test6
test6test6
test6
 
Avances Base Radial
Avances Base RadialAvances Base Radial
Avances Base Radial
 
Deployment guide series ibm tivoli usage and accounting manager v7.1 sg247569
Deployment guide series ibm tivoli usage and accounting manager v7.1 sg247569Deployment guide series ibm tivoli usage and accounting manager v7.1 sg247569
Deployment guide series ibm tivoli usage and accounting manager v7.1 sg247569
 

More from Stephan Cadene

Linux Kernel and Driver Development Training
Linux Kernel and Driver Development TrainingLinux Kernel and Driver Development Training
Linux Kernel and Driver Development TrainingStephan Cadene
 
Embedded Market March 2013
Embedded Market March 2013Embedded Market March 2013
Embedded Market March 2013Stephan Cadene
 
Exceptions and Interrupts on Cortex-M
Exceptions and Interrupts on Cortex-MExceptions and Interrupts on Cortex-M
Exceptions and Interrupts on Cortex-MStephan Cadene
 
Cloudy with a chance of arm
Cloudy with a chance of armCloudy with a chance of arm
Cloudy with a chance of armStephan Cadene
 
ARM procedure calling conventions and recursion
ARM procedure calling conventions and recursionARM procedure calling conventions and recursion
ARM procedure calling conventions and recursionStephan Cadene
 
Arm assembly language by Bournemouth Unversity
Arm assembly language by Bournemouth UnversityArm assembly language by Bournemouth Unversity
Arm assembly language by Bournemouth UnversityStephan Cadene
 
120319 m2m-tutorial-dohler-alonso-ec-2012-final-24630
120319 m2m-tutorial-dohler-alonso-ec-2012-final-24630120319 m2m-tutorial-dohler-alonso-ec-2012-final-24630
120319 m2m-tutorial-dohler-alonso-ec-2012-final-24630Stephan Cadene
 
What is a microcontroller
What is a microcontrollerWhat is a microcontroller
What is a microcontrollerStephan Cadene
 
2010-2013 Semiconductor Market Forecast Seizing the economic & political ...
2010-2013 Semiconductor Market Forecast Seizing the economic & political ...2010-2013 Semiconductor Market Forecast Seizing the economic & political ...
2010-2013 Semiconductor Market Forecast Seizing the economic & political ...Stephan Cadene
 

More from Stephan Cadene (9)

Linux Kernel and Driver Development Training
Linux Kernel and Driver Development TrainingLinux Kernel and Driver Development Training
Linux Kernel and Driver Development Training
 
Embedded Market March 2013
Embedded Market March 2013Embedded Market March 2013
Embedded Market March 2013
 
Exceptions and Interrupts on Cortex-M
Exceptions and Interrupts on Cortex-MExceptions and Interrupts on Cortex-M
Exceptions and Interrupts on Cortex-M
 
Cloudy with a chance of arm
Cloudy with a chance of armCloudy with a chance of arm
Cloudy with a chance of arm
 
ARM procedure calling conventions and recursion
ARM procedure calling conventions and recursionARM procedure calling conventions and recursion
ARM procedure calling conventions and recursion
 
Arm assembly language by Bournemouth Unversity
Arm assembly language by Bournemouth UnversityArm assembly language by Bournemouth Unversity
Arm assembly language by Bournemouth Unversity
 
120319 m2m-tutorial-dohler-alonso-ec-2012-final-24630
120319 m2m-tutorial-dohler-alonso-ec-2012-final-24630120319 m2m-tutorial-dohler-alonso-ec-2012-final-24630
120319 m2m-tutorial-dohler-alonso-ec-2012-final-24630
 
What is a microcontroller
What is a microcontrollerWhat is a microcontroller
What is a microcontroller
 
2010-2013 Semiconductor Market Forecast Seizing the economic & political ...
2010-2013 Semiconductor Market Forecast Seizing the economic & political ...2010-2013 Semiconductor Market Forecast Seizing the economic & political ...
2010-2013 Semiconductor Market Forecast Seizing the economic & political ...
 

ENERGY EFFICIENCY OF ARM ARCHITECTURES FOR CLOUD COMPUTING APPLICATIONS

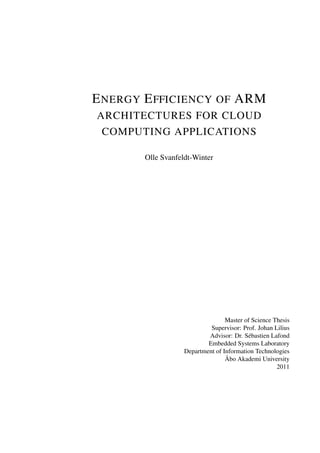
  • 1. E NERGY E FFICIENCY OF ARM ARCHITECTURES FOR CLOUD COMPUTING APPLICATIONS Olle Svanfeldt-Winter Master of Science Thesis Supervisor: Prof. Johan Lilius Advisor: Dr. Sébastien Lafond Embedded Systems Laboratory Department of Information Technologies Åbo Akademi University 2011
  • 2. A BSTRACT This thesis evaluates how the energy efficiency of the ARMv7 architecture based pro- cessors Cortex-A9 MPCpre and Cortex-A8 compare in applications such as a SIP- Proxy and a web server compared to Intel Xeon processors. The focus is on com- paring the energy efficiency between the two architectures rather than just the perfor- mance. As the processors used in servers today have more computational power than the Cortex-A9 MPCore, several of these slower but more energy efficient processors are needed. Depending on the application, benchmarks indicate energy efficiency of 3-11 times greater for the ARM Cortex-A9 in comparison to the Intel Xeon. The top- ics of interconnects between processors and overhead caused by using an increasing number of processors, are left for later research. Keywords: Cloud Computing, Energy Efficiency, ARM, Erlang, SIP-Proxy, Apache i
  • 3. C ONTENTS Abstract i Contents ii List of Figures iv Glossary vi 1 Introduction 1 1.1 Purpose of this thesis . . . . . . . . . . . . . . . . . . . . . . . . . . 2 1.2 Cloud Software project . . . . . . . . . . . . . . . . . . . . . . . . . 3 1.3 Thesis structure . . . . . . . . . . . . . . . . . . . . . . . . . . . . . 3 2 Energy efficiency of servers 5 2.1 Throughput and latency . . . . . . . . . . . . . . . . . . . . . . . . . 5 2.2 Energy . . . . . . . . . . . . . . . . . . . . . . . . . . . . . . . . . . 6 2.3 Large scale energy consumption . . . . . . . . . . . . . . . . . . . . 7 2.4 Reducing energy consumption . . . . . . . . . . . . . . . . . . . . . 9 2.5 Energy proportional computing . . . . . . . . . . . . . . . . . . . . . 11 2.6 Energy efficient low power processors . . . . . . . . . . . . . . . . . 13 2.7 Summary . . . . . . . . . . . . . . . . . . . . . . . . . . . . . . . . 14 3 Evaluated computing platforms 15 3.1 Hardware . . . . . . . . . . . . . . . . . . . . . . . . . . . . . . . . 16 3.2 Software . . . . . . . . . . . . . . . . . . . . . . . . . . . . . . . . . 23 3.3 Benchmarks . . . . . . . . . . . . . . . . . . . . . . . . . . . . . . . 24 3.4 Summary . . . . . . . . . . . . . . . . . . . . . . . . . . . . . . . . 31 4 Performance comparison 32 4.1 Apache results . . . . . . . . . . . . . . . . . . . . . . . . . . . . . . 32 4.2 Emark results . . . . . . . . . . . . . . . . . . . . . . . . . . . . . . 36 4.3 SIP-Proxy results . . . . . . . . . . . . . . . . . . . . . . . . . . . . 41 4.4 Summary . . . . . . . . . . . . . . . . . . . . . . . . . . . . . . . . 47 ii
  • 4. 5 Conclusions and future work 48 5.1 Conclusions . . . . . . . . . . . . . . . . . . . . . . . . . . . . . . . 48 5.2 Future work . . . . . . . . . . . . . . . . . . . . . . . . . . . . . . . 51 Bibliography 52 Swedish Summary 55 6 Energieffektivitet hos ARM-arkitektur för applikationer i datormoln 55 6.1 Introduktion . . . . . . . . . . . . . . . . . . . . . . . . . . . . . . . 55 6.2 Energiförbrukning . . . . . . . . . . . . . . . . . . . . . . . . . . . . 55 6.3 Förbättring av energieffektivitet . . . . . . . . . . . . . . . . . . . . 56 6.4 Mätningar . . . . . . . . . . . . . . . . . . . . . . . . . . . . . . . . 58 6.5 Slutsatser . . . . . . . . . . . . . . . . . . . . . . . . . . . . . . . . 59 A Results from Erlang benchmarking 60 iii
  • 5. L IST OF F IGURES 2.1 Monthly costs for server, power and infrastructure [1] . . . . . . . . . 9 2.2 CPU contribution to total server power usage for two generations of Google servers. The rightmost bar shows the newer server when idling [2] . . . . . . . . . . . . . . . . . . . . . . . . . . . . . . . . . . . . 12 3.1 BeagleBoard block diagram [3] . . . . . . . . . . . . . . . . . . . . . 17 3.2 OMAP3530 block diagram [4] . . . . . . . . . . . . . . . . . . . . . 17 3.3 Block diagram of the Versatile Express with the Motherboard Express µATX, CoreTile Express A9x4 and LogicTile Express [5] . . . . . . . 18 3.4 Top level view of the main components of the CoreTile Express A9x4 and with the CA9 NEC chip [5] . . . . . . . . . . . . . . . . . . . . 20 3.5 Test setup for Apache test . . . . . . . . . . . . . . . . . . . . . . . . 28 3.6 Test setup SIP-Proxy test . . . . . . . . . . . . . . . . . . . . . . . . 30 4.1 Comparison between CoreTile Express, Tegra and an Intel Pentium 4 powered machine running the Apache HTTP server. . . . . . . . . . . 33 4.2 CPU utilization during test on machine with two Quad Core Intel Xeon E5430 processors . . . . . . . . . . . . . . . . . . . . . . . . . . . . 34 4.3 Number of requests handled for each Joule used by the CPU . . . . . 36 4.4 Graph showing the CPU utilization for CoreTile Express during SIP- Proxy benchmark . . . . . . . . . . . . . . . . . . . . . . . . . . . . 43 4.5 Power consumption for the CPU in CoreTile Express during SIP-Proxy test . . . . . . . . . . . . . . . . . . . . . . . . . . . . . . . . . . . . 44 4.6 Graph showing performance of reference machine with two Quad Core Xeons using an increasing number of schedulers . . . . . . . . . . . . 45 4.7 Number of calls handled for each Joule used by the CPU . . . . . . . 46 iv
  • 6. 5.1 Achievable energy dissipation reduction by the usage of more efficient processors . . . . . . . . . . . . . . . . . . . . . . . . . . . . . . . . 49 5.2 Achievable energy dissipation reduction when moving to more effi- cient processors . . . . . . . . . . . . . . . . . . . . . . . . . . . . . 50 v
  • 7. G LOSSARY SMP In symmetric multiprocessing two or more processors are connected to the same main memory. DVF Dynamic Voltage and Frequency regulation is used to adjust the input voltage and clock frequency according to the momentary need in order to avoid unnec- essary energy consumption Power gating Cutting power to parts of a chip when the particular part is not needed. Data center Facility that houses computer systems Server farm A server farm is a collection of servers. They are used when a single server is not capable of providing the required service CPU Central processing unit. Cloud Platform for computational and data access services where details of physical location of the hardware is not necessarily of concern for the end user Granularity Granularity describes the extent a system is broken down into smaller parts DMIPS Dhrystone MIPS. Obtained when dividing a Dhrystone benchmark score by 1757 vi
  • 8. 1 I NTRODUCTION Cloud computing systems often use large server farms in order to provide services. These server farms have high energy consumption. The energy is not only needed to run the servers themselves but also for the systems that keep them cool. Energy con- sumption is seen as both an economical and ecological issue. Regardless of whether one wants to save money or to cause less strain on the environment, the solution is the same; to reduce the energy consumption. The approach presented in this thesis to reduce the power dissipated by server farms is to replace their processors with ones that are more energy efficient. The architecture of processors used in smartphones and embedded systems have been designed with energy efficiency in mind from the beginning, something that has not been the case with the x86 architecture usually found in servers. This makes the processors used in embedded systems interesting candidates when looking for replacements for regular x86 architecture based server processors. Although the processors used in mobile devices use less energy for executing a sin- gle instruction, the execution of a single instruction is often not directly comparable to an instruction execution on a regular server processor, due to factors such as differences in the instruction sets. Also the computational power for a single low power processor is generally modest compared to traditional desktop and server processors. Moving to processors with lower individual performance increases the number of processors needed to provide the same service as before. Distributing work on a larger number of processors increases the importance of parallelism on the software side. Applica- tions that use a lot of I/O operations will get less of a performance drop than those that are more computationally intensive, when switching to processors with lower in- dividual performance, as the speed of I/O is dependent on other components than just the CPU. Applications designed to be run on server farms are already designed to be distributable in order to use the added resources from a server farm, compared to that of a single server. 1
  • 9. Applications such as gateways in telecommunication have a large number of re- quests to serve but the requests are light and generally independent of each other. Also tasks performed by web servers such as serving static webpages are suitable candidates to be run in clouds of low power processors, as the services provided are not CPU in- tensive. The suitability to provide services using low power energy efficient processors will be evaluated using benchmarks. General performance benchmarks for the Erlang virtual machine (VM) will be used in addition to Apache benchmarking and a SIP-Proxy running on top of Erlang. Gen- eral performance benchmarks will be used to evaluate the performance of the Erlang run time system (erts) for a variety of tasks such as message passing and pure number crunching thereby comparing the performance between the different architectures. The obtained results are used to evaluate why some tasks run better on some hardware than others and explain the performance differences for realistic applications. The extent of this thesis is limited to how well a single Cortex-A9 MPCore and a Cortex-A8 perform in comparison to processors such as the Intel Xeon. The topics of interconnects between processors and overhead caused by using an increasing number of processors are left for later research. 1.1 Purpose of this thesis The purpose of this thesis is to evaluate the energy efficiency of ARM Cortex-A9 MP- Core based processors compared to x86 based processors for telecom systems and other Cloud like services. In addition to the energy efficiency of the Cortex-A9 MP- Core processors single core Cortex-A8 processor will also be evaluated. To make an energy efficiency comparison possible the performance of the processors will first be evaluated. The main interest is the comparison between the energy efficiency for the two architectures rather than on the energy efficiency between certain processor mod- els. To achieve this, several processors based on the same underlying architecture will be evaluated. The ability to provide simple web services will also be evaluated on the same ARM based test machines. For testing how well the testmachines perform in providing simple web services Apache 2.2 will be used. The focus is on the ability to provide static web pages. For the telecommunication part the focus will be on a SIP-Proxy running on top of the Erlang VM. Micro benchmarks that stress different 2
  • 10. aspects of the Erlang VM are used to evaluate how efficient the ARM based processors can handle different tasks. The important metric is how much performance is achieved compared to the amount of energy used, rather than pure performance of the proces- sors. The potential for energy saving achieved from using ARMv7 based processors in servers compared to servers based on x86 processors will be evaluated. To make the comparison realistic only the efficiency of the processors will be considered. The potential for energy efficiency improvement for the rest of the components in the test machines are not considered. The impact to total data center infrastructure and power cost will be analyzed using a cost model for a hypothetical data center. 1.2 Cloud Software project The Cloud Software Program (2010-2013) is a SHOK-program financed through TEKES and coordinated by Tivit Oy. Its aim is to improve the competitive position of the Finnish software intensive industry in the global market [6]. The content of this thesis is part of the project. The research focus for the project in the Embedded Systems Laboratory at The Department of Information Technologies at Åbo Akademi is to evaluate the potential gain for energy efficiency by using low power nodes to provide services. In addition to energy efficiency the total cost of ownership for the cloud server infrastructure is in a central role. 1.3 Thesis structure Chapter 2 begins with the introduction of concepts such as energy and energy effi- ciency. Followed by why energy efficiency is an issue for cloud service providers and how much and where energy is consumed in data centers. Methods to reduce energy consumption as well as the concept of energy proportional computing are presented in chapter 2. The chapter ends with a discussion on the motivations and theories on why the usage of energy efficient low power processors is a viable option. Chapter 3 presents the hardware and software used in the evaluations as well as the benchmarks. Chapter 4 presents the results from the benchmarks presented in Chapter 3. Compar- isons between the results for the different test machines in the benchmarks are also presented in this chapter. Chapter 5 shows conclusions together with suggestions for 3
  • 12. 2 E NERGY EFFICIENCY OF SERVERS In this chapter concepts such as energy, energy efficiency and energy proportionality will be presented. Metrics necessary to evaluate energy efficiency will also be briefly discussed, continued by the subject of why energy consumption is both an economical and practical issue. An example of how much energy is being used by server farms and the cost associated with it is shown. Both direct energy cost and costs related to energy related infrastructure. The chapter ends by presenting methods used to decrease energy consumption and by discussing why using energy efficient low power nodes would be an option. 2.1 Throughput and latency It is important to notice that latency and throughput do not always correlate. Even if two systems have the same throughput the time to serve a single request is not nec- essarily the same. A system that uses one node to provide a certain service has to process the individual requests faster than one consisting of several units. If the num- ber of nodes used to provide a certain service is doubled, the requirements are naturally cut by half for each unit. The formula below shows the relation between throughput, latency and the number of nodes. T hroughput = Availablenodes ∗ (1/Latency) The unit of throughput can vary greatly. If the performance of a web server is eval- uated, the throughput can be defined as the number of requests served each second. The latency is the time taken to serve a request and the available nodes simply indi- cates how many nodes that are available to provide the service. The throughput can be kept on the same level even if the latency increases, provided that the number of nodes is increased to compensate. For example if one server with the ability to serve 5
  • 13. a hundred requests per second were be replaced by servers with the ability to serve 10 requests each, ten of the less powerful servers would be needed to achieve the same performance. It is implied that the minimum latency for the service cannot be lower than the minimum latency for a node. How long latency is acceptable depends on the service being provided: a phone call is likely to have stricter requirements for the response time than a service for downloading files. 2.2 Energy Energy is generally described as the ability to perform work. It can be of many forms such as kinetic, thermal or electric. In this thesis the focus is on electric and thermal energy as computers use electric energy and transform it to thermal energy. Power is the rate at which energy is being transformed into another form. In the case of computers the conversion is from electrical energy to thermal energy. The unit for power is Watt (W). Electric energy is measured in Joule (J) and is defined as power multiplied with time. Energy = AvgP ower ∗ T ime Energy efficiency is the amount of work done compared to the amount of energy used. The exact way to measure and compare energy efficiency varies depending on the particular application. When considering the energy efficiency for services provided by a cloud or a server it could be for example how many Joules is needed for a transaction, or retrieving a file from a web server. Depending on the application the metrics can greatly vary. As it is stated by the first law of thermodynamics, energy is never created or de- stroyed, only converted to other forms. All the energy that a computer, or part of a computer consumes will be converted into heat. Depending on the amount of energy the component consumes, the greater the problem with heat dissipation becomes. The ability to dissipate heat is dependent on many factors, such as surface area and ma- terial. Heat sinks are often used to increase the ability of the component in question to dissipate heat. Regardless of thermal dissipation capabilities and the amount of thermal energy dissipated, the heat has to be transferred somewhere in order to avoid overheating issues. 6
  • 14. 2.3 Large scale energy consumption Small computer systems such as personal computers can generally be cooled by a few fans as the space they are kept in is relatively large in comparison to the amount of heat that is generated. When having a large number of servers in the same place the amount of heat builds adds up. Also the modest energy consumption of a regular home computer is often not a great economical issue as the power needed is on the same scale of magnitude as a few incandescent light bulbs. The more densely hardware is stacked in order to fit as much equipment as possible in the smallest possible space; the more heat is also produced in the same space. The biggest consumer of energy in a server is the CPU with approximately 45 percent of the total consumption [2]. The energy consumption ratios between different components vary depending on the configuration of the server. In servers where several disk drives are used for data storage the energy consumption of the disk drives also becomes significant [7]. According to Schäppi et al. the total energy consumption of data centers has been increasing for years [8]. In 2006 the energy consumption of servers in Western Europe (EU 15 and Switzerland) was 14,7 TWh [8]; this does not include any energy consumed by the infrastructure such as cooling, lighting and UPS. Schnäppi et al. also states that the complete energy consumption for the data centers in the same region is 36,9 TWh. It is not uncommon for data center service providers to boast of high energy efficiency, both for their servers and for the data centers as a whole. Companies do not, however, generally present exact data on energy consumption and the technical specification of their centers for the public, making accurate estimates difficult. Several different metrics for energy efficiency on a data center scale are used. Power Usage Effectiveness (PUE) and DCiE are metrics defined by Green Grid in a white paper called “The green grid power efficiency metrics: PUE & DCiE“ [9]. The definitions on PUE and DCiE are shown below. P U E = T otalF acilityP ower/IT EquipmentP ower[9] DCiE = 1/P U E = IT EquipmentP ower/T otalF acilityP ower ∗ 100%[9] IT Equipment power includes the servers but also network equipment and equip- ment used to monitor and control the data center. Total facility power includes in 7
  • 15. addition to the IT equipment cooling, UPS, lighting and distribution losses external to the IT equipment [9]. In an ideal data center the PUE would be 1 and would mean that all power used by the center is used to power the IT equipment. According to "The green grid power efficiency metrics: PUE & DCiE“ preliminary data shows that many data centers have a PUI of 3.0 or greater [9]. Companies that provide cloud services need large amounts of computer resources. When using cloud computing the user does not need to worry about the resources locally, and many new data centers are being built to provide the required resources. Several companies including Google and Microsoft are building data centers [10] with increasing numbers of servers. Many of the centers are so large that instead of using a server rack as the basic unit shipping containers are used [10] [11]. For example Google uses shipping containers to house servers in their data centers. One container is reported to house 1160 servers, and the power consumption of just one container is reported to be up to 250 KW [11]. Using the reported values one server would use approximately 216 W. In 2008 Microsoft announced that they were building a data center containing 300 000 servers [12]. If the power consumption of the servers in Microsoft’s new server farm is the same as that reported by Google the power consumption of the servers in the farm is approximately 65 MW. The fact that the servers are packed tightly also means that the challenges for the cooling is increasing. The problem with large heat dissipation is being addressed in different ways, for example Intel provides energy efficient versions of some of its Xeon processors intended especially for high density blade servers [13]. The more energy efficient versions are generally more expensive. For example the Intel Xeon L5434 costs 562 e[14] and the E5430 costs 455 e[15]. Having to pay less for keeping the servers running and still providing the same services makes new business opportunities possible and increases the profit for current business areas. In order to evaluate the potential savings caused by a reduction of the energy con- sumption the total cost structure for a server farm must be analyzed. Hamilton [1] presents a cost analysis for a hypothetical data center. To enable the comparison be- tween cost elements such as infrastructure, hardware and power, amortization times are defined for the investments. The infrastructure in Hamilton’s hypothetical data center is designed to have a 15-year amortization time for infrastructure and a 3-year amorti- 8
  • 16. zation time for the servers. A five percent annual cost for the capital used to build the data center is assumed. The cost of power is set at $0.07/KWh for this example. The costs of the data center can be seen in the pie chart shown in Figure 2.1. The chart shows that the direct cost of power is 19 percent of the total cost. Hamilton contin- ues pointing out that for the hypothetical data center 82 percent of the infrastructure costs consist of power and cooling infrastructure, and that thereby the maximum power consumption of the servers is reflected in the infrastructure costs. In Hamilton´s hy- pothetical data center the combined cost of power and cooling infrastructure, and the actual power is 42 percent. Hamilton writes that the power consumption contribution is 23 percent of the total cost. The numbers in the graph do not support that statement. The contribution of power and cooling infrastructure to the total cost on the other hand is 23 percent and the cost of power is 19 percent, according to the graph. These are the values that will be used in chapter five. Figure 2.1: Monthly costs for server, power and infrastructure [1] 2.4 Reducing energy consumption In order to improve energy efficiency for a computer, the causes for the energy con- sumption must be known. Knowing the contributions of the main components in a modern computer helps to focus only on the critical components. Modern computer systems are built using CMOS circuits. The causes for energy consumption in a CMOS circuit are divided into Static power consumption and Active power consumption. The static power consumption is caused by unintended leakage currents within the circuits. 9
  • 17. The static power consumption can be reduced by bringing down the number of active transistors and turning parts of the chip off when not needed. Another factor that af- fects the static power consumption is the supply voltage. Active power consumption is caused by switching the states of the transistors and is thereby dependent of the usage of the circuit. The time taken to charge and discharge a capacitor is dependent on the voltage used. A higher voltage allows a shorter switching time and thereby a higher clock frequency. The lowest voltage possible should be used for the planned clock frequency in order to be energy efficient. Voltage and Frequency Scaling (DVFS) is a method to reduce the energy consumption of a processor at times when it is not required to run at full capacity. DVFS works by varying both the voltage and clock frequency of the processor, depending on the performance required at a specific time [16]. The number of transistors in a CPU has increased approximately as predicted by Moore’s law for the last forty years, which means doubling roughly every two years [17]. The number of transistors is reflected in chip performance. David A. Patterson points out that the bandwidth (performance) improvement of CPUs has been faster than for other components [18]. The annual improvements can be seen in Table 2.1. The performance increases shown in the table are without units as it only shows the annual improvement for the type of component in comparison to similar components from previous years. While the difference in improvement per year is not huge, the difference has been building up for many years. Patterson points out that bandwidth between components such as the CPU and memory can always be improved by adding more communications paths between them, but that it is costly and causes an increase in energy consumption and the size of the circuits. In addition to the un proportional increase in performance for the components in Table 2.1, Patterson raises concerns that latency has improved less than bandwidth. Patterson continues to point out that marketing has been one reason for this inbalance, that an increase in bandwidth is easier to sell than a decrease in latency. Finally Patterson reminds us that certain methods created to improve bandwidth, such as buffering, has a negative effect on latency [18]. The time it takes for a computer to execute a process is not only dependent on the speed of its CPU. Other components in a computer such as the random-access memory (RAM) are not as fast as the CPU. The speed difference causes the CPU to waste many clock cycles waiting for memory transactions. If data has to be fetched from a hard 10
  • 18. CPU DRAM LAN HDD 1.50 1.27 139 1.28 Table 2.1: Relative annual bandwidth improvement of different computer components during the last 20-25 years [18] drive disk (HDD) the waiting period is further increased. If there is more than one task running on the same system, and the tasks are running independently from each other, the system might well be able to execute other tasks while one is waiting for I/O. This works well if most tasks do not require I/O operations and access to memory. If the purpose of a system is to mainly run tasks that are I/O intensive and require lots of memory accesses, much time is potentially wasted for the CPU. As Hamilton [1] points out there are at least two ways of dealing with the perfor- mance inbalance problem. One is to simply invest in better bandwidth and commu- nication paths between the memory and CPU. Another way is to avoid the problem by using lower-powered and cheaper CPUs that does not need as fast memory [1]. Hamilton also points out that because server hardware is built with higher quality re- quirements, and in lower volumes than client hardware it is more expensive. Hamilton continues that ”When we replace servers well before they fail, we are effectively pay- ing for quality that we’re not using“[1]. The energy efficiency is in general better for newer hardware adding to the pressure to upgrade to newer servers. 2.5 Energy proportional computing According to Barroso and Holzle [2] a server is generally operating at 10 to 50 percent of its maximum capacity but is rarely completely idle. Having data on several servers improves the availability of the data; a side effect is, however, that more servers must be online. In a case where servers would be completely idle for significant times, powering down a part of the server farm would allow significant power savings. In practice some sort of load and task migration/management system would be needed to distribute tasks in a favorable manner between the available servers, in order to allow powering down a larger number of servers. Barroso and Holzle continue to state that even when a server is close to idle it still consumes about half of its peak 11
  • 19. power consumption. In a completely energy proportional server no energy would be used while the server is idle. Complete energy proportionality is not feasible with the manufacturing techniques and materials of today’s processors, due to leakage currents. Regardless of the average power consumption during standard operation, a data center must still have the infrastructure to support the maximum power that the servers can use, or are allowed to use. Reducing the peak power consumption also reduces the demand on the power and cooling infrastructure, the part of the infrastructure that is responsible for 82 percent of the total infrastructure costs [1]. The energy consumption of a server is not necessarily the same as the combined peak power of the components the server is built from [7]. The maximum peak power consumption measured for a server constructed for the example was less than 60 percent of the combined peak power consumption for its components. Fan et al. [7] continue to state that the power consumption is also application specific. From the tests performed in preparation for this thesis, it is clear that even if the system reported full CPU utilization the actual power consumption of the CPU can vary. Furthermore Fan et al. [7] state that in case of an actual data center the consumption is 72 percent of the actual peak power consumption. Figure 2.2: CPU contribution to total server power usage for two generations of Google servers. The rightmost bar shows the newer server when idling [2] Figure 2.2 from [2] shows the percentage of energy consumption that the CPU con- tributes to the total energy consumption of the server. The data are from two servers 12
  • 20. used by Google in 2005 and 2007. The graphs show that the contribution to the to- tal consumption is approximately 45 percent during its peak power consumption and approximately 27 percent when idle for the newer server. The power saving mech- anisms on the server is unknown but from the data provided in the graph the power saving works better on the processor itself than on the server as a whole because the contribution made by it is smaller when the server is idling. Barroso and Holzle also point out that they have experienced that the dynamic power ranges for DRAM are below 50 percent: 25 percent for disc drives and 15 for networking switches [2]. The observations are in line with the results in Figure 2.2. The authors in [7] claim that peak power consumption is the most important factor for guiding server deployment in data centers but that the power bill is defined by the average consumption. A lower peak power consumption for the servers allows for a larger number of servers within the same energy budget, leading to a higher utilization level of the cooling and power infrastructure and thereby a more effective use of the available resources and budget. The requirements for both cooling and power, including UPS are reduced with lower peak power consumption. 2.6 Energy efficient low power processors Servers have generally been constructed for high performance, using high performance processors rather than energy efficient ones. Processors that originate from embedded systems are in contrast mainly built for energy efficiency. This is due to both thermal constraints and power constraints from battery powered devices. This kind of proces- sors hardly ever needs active cooling, regardless of them having small physical size. By replacing an energy hungry high performance processor with a set of energy efficient processors originating from battery powered embedded systems, the energy consumption can be reduced. General purpose processors for embedded systems are produced in large numbers. To get the same amount of work done, a larger number of the slower processors is needed. When increasing the number of processors the gran- ularity of the power consumption also increases. In order to improve energy efficiency with the changing of processors, the processors used must be at least as energy efficient as the one that should be replaced. Processors used in battery powered devices where computational power is required, are ideal for the evaluating the energy saving poten- tial. ARM Cortex-A8 and the Cortex-A9 MPCore are tested for this purpose. When 13
  • 21. using DVFS to reduce the energy consumption of the processor the server continues in an operational state. A much greater energy reduction can, however, be achieved by entering a sleep state, where a processor is turned off and thereby not able to do any calculations until it is waken up. The time to enter and return from a sleep state is generally longer than when changing between power states using DVFS. In a server with multiple processors it could be possible to put the ones that are not needed at the moment in a sleep state, in order to reduce power consumption. In this case it is, how- ever, important to be able to predict how long time switching between different power states takes, and know if the service deadlines allow for such a latency. 2.7 Summary In a perfectly power proportional server the instantaneous energy consumption is pro- portional to the required service level. An idling server would not use any energy and a server functioning at half capacity would use half of the server’s peak power consumption. Techniques such as DVFS and power gating are used to increase en- ergy proportionality. In a modern computer based on CMOS circuits complete energy proportionality is not achievable due to leakage currents. While the average power consumption determines the amount of actual used energy, the peak power consump- tion is what defines the required capacity of the cooling and power infrastructure. The cost of power and cooling infrastructure combined with direct energy consumption in a data center is 42 percent, and approximately 45 percent of a server’s peak power consumption is caused by the server’s processor or processors. Processors intended for usage in embedded devices are designed for energy effi- ciency, in contrast to server processors that are designed for performance. The poten- tial benefit from replacing server grade processors based on the x86 -architecture, used in modern servers with more energy efficient ARM Cortex-A9 MPCore processors is evaluated in this thesis. 14
  • 22. 3 E VALUATED COMPUTING PLATFORMS This chapter describes the hardware and software that has been used for the bench- marking. The evaluated hardware uses the ARMv7 -architecture based Cortex-A8 and Cortex-A9 MPCore processors. The platforms that will be used for testing are the Bea- gleBoard, Versatile Express with a CoreTile Express A9 MPCore daughter board and a Tegra 250 development board. The benchmarks presented in this chapter are used to evaluate the performance of the following applications: Apache 2 HTTP server, an Erlang based SIP-Proxy used for session management and some benchmarks testing various aspects of the Erlang virtual machine itself. What SIP and a SIP-Proxy is will be covered as well as Erlang. In order to evaluate how well a cluster of the ARM Cortex-A8 and Cortex-A9 MPCore processors are suited to replace processors used in todays servers the perfor- mance of single processors must first be evaluated. It is possible to determine how the energy efficiency compares between the different architectures by running com- parison benchmarks with machines that are built using processors based on the x86 architecture. The performance of the processor architecture will be better shown by using two different Cortex-A9 MPCore processors compared to using only one. As the two Cortex-A9 MPCore machines have different clock frequencies as well as differ- ent number of cores, the scaling properties for the two performance increasing options can be evaluated. How the energy efficiency is affected by these factors must also be evaluated. In practice evaluate, if increasing a processors clock frequency or adding additional cores is more beneficial, when looking at the performance per watt. If the results for a single ARM processor show worse energy efficiency compared to modern server processors a cluster of the low power processors will then also have a worse energy efficiency. 15
  • 23. 3.1 Hardware 3.1.1 BeagleBoard The BeagleBoard [3] is a low cost system based on the ARM Cortex-A8 processor with low power requirements. The version of the BeagleBoard that was used for the measurements is the C3. It is equipped with a TI-OMAP3530 chip with an ARM Cortex-A8 processor running at 600MHz. The main storage device is a Micro SD-card and there is 256MB DDR RAM available. A block diagram of the BeagleBoard is shown in figure 3.1 and a block diagram of the OMAP3530 chip in figure 3.2. The BeagleBoard that was used for the benchmarking had Ångström Linux installed with kernel version 2.6.32. The first tests were run on a BeagleBoard B5. The B5 was later replaced by a C3 as it has double the amount of RAM compared to the B5, allowing for a wider range of tests to be run. Neither model has an Ethernet port built in, a USB to Ethernet adapter was therefore added to get Ethernet connectivity. An improvement from the B5 model to the C3 model is a USB A-port in addition to the OTG mini USB port on the B5 board. Ethernet connectivity has not been built in before the new xM model and also on the xM it is a USB based Ethernet solution [19]. A USB to Ethernet adapter was found to be the best way to get network connectivity to the BeagleBoard. Due to the USB to Ethernet adapter the maximum bandwidth is limited by the speed of USB 2.0 to 480 Mbps. This was not a serious limitation, due to the limited performance of the BeagleBoard in the benchmarks. Although the BeagleBoard did give some indications on how the test programs performed on an ARM based system, the tests were not conclusive. This, because of the many differences compared to “normal” computer systems not just caused by the processor architecture, but also from the small amount of RAM and the speed of the RAM. The slow speed of the Micro SD-card used for main storage was also slowing down the entire system. In the test with Erlang, a non SMP version of the Erlang run time system (erts) was used, as the Cortex-A8 only has one core. 16
  • 24. Figure 3.1: BeagleBoard block diagram [3] Figure 3.2: OMAP3530 block diagram [4] 3.1.2 Versatile Express The Versatile Express [5] development platform that was used consisted of the Versa- tile Express Motherboard (V2M-P1) with a CoreTile Express A9 MPCore [5] (V2P- CA9) daughter board. In addition to the Quad Core Cortex-A9 MPCore the daughter board has 1GB of DDR2 memory with a 266MHz clock frequency [5]. A block dia- 17
  • 25. gram of the Versatile Express can be seen in figure 3.3. The diagram shows a second daughter board, a LogicTile Express, in addition to the CoreTile Express, the particular machine used for the benchmarking did not have a LogicTile Express installed. Figure 3.3: Block diagram of the Versatile Express with the Motherboard Express µATX, CoreTile Express A9x4 and LogicTile Express [5] The ARM processor on the daughter board is a CA9 NEC [5] chip clocked at 400MHZ with limited power management functions. Power gating and DVFS are not 18
  • 26. supported on the chip [5], which needs to be noted when considering the power con- sumption of the system. A top level view of the chip can be seen in figure 3.4. As powering on and off cores is the main power reduction technique available on this particular chip, the power consumption is not precisely matched to the required perfor- mance. In a system where power gating and DVFS are available, the possibilities for power proportional computing are better. The Versatile Express does, however, allow monitoring of both operating voltage and power consumption. To use this functionality a kernel module was created and loaded to the kernel on the V2P-CA9 to enable usage of the necessary registers for collecting voltage, current and power consumption data. The registers used are VD10 _ S2 and VD10 _ S3. VD10 _ S3 is the power measurement device for the Cortex- A9 system supply, cores, MPEs SCU and PL310 logic [5]. VD10 _ S3 is the most interesting power measurement supply for this comparison. VD10 _ S2 is the current measuring device for the PL310, L2 cache and SRAM cell supply. A program that read the values for the voltage, current and power for both supplies once every second and stored them for further use, was created. The use of the program allowed continuous monitoring during benchmarking. Data logging at shorter intervals was also tested, but was discontinued in order to reduce the interference caused by the data collecting, and because the added value brought by it was negligible. Furthermore, several possibilities exist for changing settings on the chip, such as the speed of the memory and the clock frequency for the cores. Suitable frequency combinations for the different clocks must be carefully calculated in order for the sys- tem to work properly. These changes must be done while the system is off line as the settings are stored on a memory card on the Versatile Express Motherboard, and read from there on startup. A Debian installation was provided with the Versatile Express. The installation was provided with a 2.6.28 Linux kernel. Official support for the Ver- satile Express in the Linux kernel was not added before version 2.6.33. To determine the reasons for unexpected performance differences between the test platforms, mainly between the CoreTile Express, and the Tegra 250, impacts of different parts of the test platforms were examined. Kernel version 2.6.33 was used to evaluate if unexpected performance differences were caused by the kernel version previously used. The main reasons for choosing version 2.6.33 for the test, are that it supports the Versatile Ex- press and is the closest possible version to the 2.6.32 used on the Tegra. Having the Tegra 250, and the CoreTile Express using similar software is useful, in order to find 19
  • 27. differences caused by the hardware. The operating system was installed on a USB flash drive, as the native memory card on the Versatile Express was significantly slower than the USB flash drive. Figure 3.4: Top level view of the main components of the CoreTile Express A9x4 and with the CA9 NEC chip [5] 20
  • 28. 3.1.3 Tegra The Tegra [20] is a Tegra 200 series developer kit with a Tegra 250 system intended to support software development. The Tegra 250 chip includes a dual core Cortex-A9 MPCore chip running at 1GHz. The board also contains 1GB of DDR2-667 RAM and is equipped with a SMSC LAN9514 USB hub with integrated 10/100 Ethernet. The used Tegra 250 board had an additional PCI express Gigabit Ethernet card isntalled in order to avoid networking bottlenecks. Compared to the older chip on the Versatile Express, the newer Cortex-A9 has both more advanced power management features and a different networking implementation. By evaluating the performance of both the Tegra and the CoreTile Express, the aim is to identify how varying number of cores and difference in clock frequencies is reflected in the performance for running different applications. Ubuntu 10.04 was installed on the board with a Linux kernel version 2.6.32, which was provided by Nvidia. As the only compatible kernel version available for the Tegra was the 2.6.32, and the Versatile Express was not supported before 2.6.33, the two Cortex-A9 systems could not use the same kernel version. For the benchmarks the Tegra 250 board was controlled through its serial port and the two Ethernet ports. As information of the power consumption of either the parts of, or the entire Tegra 250 chip was not available, the values used are estimates derived from the information released by ARM [21]. The Tegra 250 chip also includes several other specialized processors in addition to the Cortex-A9 MPCore. This makes the process of measur- ing the energy consumption of the Cortex-A9 even more challenging. There is little information available for the exact configuration and manufacturing process for the Tegra 250. According to ARM, a Dual Core Cortex-A9 built using the TSMC (Taiwan Semiconductor Manufacturing Company) 40G process, which is a 40 nm manufactur- ing process, in a speed optimized implementation uses 1.9 W at 2 GHz, resulting in 10000 DMIPS. A power optimized implementation uses 0.5W at 800 MHz providing 4000 DMIPS [21]. In this thesis the power consumption is estimated to be 1 W for the Cortex-A9 in the Tegra 250. 3.1.4 Reference and client machines In addition to the test machines with ARMv7-A processors other test machines with x86 processors are needed to make a comparison between the energy efficiency of the 21
  • 29. processor architectures. A variety of machines were used during the benchmarking, both to make comparisons possible but also to enable the benchmarking in both the SIP-Proxy and the Apache HTTP server tests. The results that are presented for refer- ence values originate mainly from three different machines. The first has a Dual Core Intel E6600 processor, the second has two Intel Quad Core E5430 processors and the third has two Quad Core Intel L5430 processors. According to the data sheet for the 5400 series [13], there are three different sub series within the 5400 series, targeting different markets, the X5400, E5400 and L5400 sub-series. The X5400 series is described as a performance version and the E5400 as a mainstream performance version. The L5400 is described as a lower voltage and lower power version intended specifically for dual processor server blades. The listed thermal dissipation power (TDP) for X5400, E5400 and L5400 series is 130 W, 80 W and 50 W. 3.1.5 Network The benchmarks that required interaction between several machines were connected in a number of different ways, depending on the test in question, and partly by the available resources. Due to the design of the test machines, Gigabit Ethernet, was not always available. The BeagleBoards had the option of Ethernet over USB, or a USB to Ethernet adapter. In order to make the tests more comparable, the USB to Ethernet adapter option was used. Both the Versatile Express, and the Tegra 250 had 10/100 Mbps Ethernet capabilities. The Tegra had in addition to the built in fast Ethernet a Gigabit Ethernet card. At first the machines that were to be benchmarked were connected directly to the benchmarking machine without any switches. To increase the number of clients a fast Ethernet switch was used in order to add up to six benchmarking machines. In order to enable benchmarks by using a larger number of more powerful machines, a Gigabit Ethernet LAN was used. Through this network ten client machines were controlled by an eleventh machine. These machines were used to create the necessary traffic for the benchmark. To avoid and detect problems caused by other users of the same network, the tests were performed in the evenings outside office hours. Tests were also re done later to confirm the results. As the network bandwidth was limited the file requested in the test was small, in order to keep the bandwidth requirements as low as possible. The theoretical maximum bandwidth for the LAN is a gigabit, or 131 072 KBps. The 22
  • 30. bandwidth of the network was not a problem for the ARM test machines. However, for the machine used for the reference results, it was a potential bottleneck considering the ability of the reference machines to serve tens of thousands of request per second. 3.2 Software 3.2.1 Erlang Erlang [22] is a functional programming language and a Virtual Machine. The Erlang syntax resembles that of prolog, not surprisingly, as it started out as a modified version of prolog. The first version of Erlang was created at the Ericsson Computer Science Laboratory by Joe Armstrong, Robert Virding and Mike Williams. The development of Erlanf began in the eighties and Erlang is still used by Ericsson in telecommunication applications [22]. It is designed to be highly concurrent and designed for fault tolerant soft real-time systems [23]. The aim was to create a language that would be suitable for creating telecommunication systems, consisting of millions of lines of code. These systems are not only large, they are also meant to constantly be running. To be able to run them continuously for as long times as possible, software upgrades must be possible without stopping the system [24]. Erlang/OTP is often implied when discussing Erlang. OTP is short of Open Tele- com Platform. It contains tools, libraries and procedures for building Erlang appli- cations. It provides readymade components, such as a complete web server and FTP server. It is also useful when creating telecommunication applications. Both the Erlang VM and OTP are open source licensed. The Erlang run time system (erts) implements its own lightweight processes and garbage collection mechanism. Erlang is run as a single process in the host operating system, and schedules the Erlang processes within it. SMP Erlang enables the use of more than one CPU core on the host machine by using multiple schedulers. All sched- ulers are run as separate processes in order to enable their simultaneous execution. In general equally many schedulers are run as there are available CPU cores. From the users perspective there is no difference if the cores are on the same CPU, or on differ- ent CPUs in the same SMP machine. The number of schedulers that are used can vary, but by default it is the same as the number of available CPU cores. There is no shared memory between Erlang processes, which means that all communication is done using 23
  • 31. message passing, enabling the construction of distributed systems [23]. 3.2.2 SIP-Proxy SIP is short for Session Initialization Protocol, a standard defined by IETF [25]. IETF or Internet Engineering Task Force is an organization that develops and promotes In- ternet standards. IETF does not have any formal membership or membership require- ments [25]. SIP is an application-layer protocol for controlling sessions with one or more participants. It is used for creating, modifying and terminating sessions. The ses- sions can be multimedia, including video or voice calls, and the session modification possibilities include the ability to add or remove media and participants, and change addresses. The protocol itself can be run on top of several different transport protocols, such as Transmission Control Protocol (TCP) or User Datagram Protocol (UDP). SIP includes features such as the possibility for a user to move around in a network, while maintaining a single visible identifier. It is also possible to be connected to the net- work from several different places, by for example using several different phones that are associated with the same identifier. The SIP protocol does not provide services on its own, it does, however, provide primitives that can be used to implement a variety of services. There is a great variety of extensions for the SIP protocol to make it usable for many use cases and environments. SIP enables the creation of an infrastructure, consisting of proxy servers that users can use to access a service. A SIP-proxy is a server that helps route requests to the current location of the user, and makes requests on behalf of the client, the proxy also authenticates and authorizes users for the provided services. The protocol allows for registration of the users locations to be used by the proxy servers. 3.3 Benchmarks To evaluate the performance of our hardware, several benchmarks were used. First, the performance of the Erlang rts is benchmarked to see how well it performs on the hard- ware. This shows how well an application running on top of Erlang could be expected to run. By benchmarking the SIP-Proxy, and Apache 2 server, the performance for actual services is evaluated for all the hardware. More precise information about the benchmark setups are presented in the following sections, and the results are presented and analyzed in the following chapter. 24
  • 32. 3.3.1 Apache 2 Apache 2.2 HTTP server was used to determine how well the Cortex-A9 MPCore machines can perform with traditional server tasks. Apache 2.2 was chosen as it is both freely available, open source and has been one of the most popular servers for a long time. The Apache HTTP server is available for many platforms, such as Linux, Mac OS/X and is used with a variety of architectures. As these benchmarks are targeting the x86 and ARMv7-A architectures, the ability for the Apache HTTP server to run on both is crucial. These tests are focusing on use cases with small static files. The initial tests were run using Apache Bench (AB), a tool for quick performance testing. The use of AB was later discontinued in favor of autobench, in order to produce more reliable results. Autobench [26] was used to measure how well Apache performs on the different machines and with different test parameters. Autobench is a tool that helps automate the use of httperf. Httperf is a program for benchmarking the performance of a HTTP server. It creates connections to a server, in order to fetch a file. During one connec- tion, one or several requests for the file is made, depending on the test parameters. By changing the rate the connections are created and the number of requests for each con- nection, the load on the server varies. By running httperf several times with different rates of connections the servers response to different load can be evaluated. By running the test from several machines simultaneously, the load generating capabilities of the test setup can be taken beyond that of a single machine, but the instances must be con- trolled separately. The results from such tests must also generally be later combined manually. To decrease the error caused by differences in the starting time for the test from different test machines, the testing time should be relatively long [27]. One of the most useful features of autobench is that it runs multiple tests while steadily increasing the load on the server according to the users instructions. In order to run autobench, a number of parameters must be set. The parameters can either be set in a configuration file, or given as command line arguments when starting the test. An example for benchmarking a single server giving the arguments from the command line, looks like the following. autobench -single_host -host1 www.google.com -uri1 /10B -quiet -low_rate 100 -high_rate 1000 -rate_step 20 -num_call 10 -num_conn 10000 -timeout 5 -file benchmarkresult.tsv Single host indicates that only one server is benchmarked. Host1 is the ad- 25
  • 33. dress to the server, in this case www.google.com. Uri1 is the file that is requested in the test, a file called 10B, is used in this example. The quiet option must be used if the results are expected to be sent to STDOUT, as it restricts the amount of data that httperf produces. Too much output from httperf causes autobench to cre- ate badly formatted report tables. The benchmarking stats from the point indicated by low_rate, and continues to the upper limit given by high_rate using the step size from rate_step. In this case the test starts from 100 connections and is run until 1000 connections per seconds is achieved, always adding 20 connections for each new run. Num_call regulates how many requests for the particular file should be made for each connection, 10 in this case. If the option to keep alive connections is disabled on the server, the test will report a number of unsuccessful attempts at retrieving the file. The number of attempted requests is calculated by multiplying the num_call with the connection rate. Num_conn specifies the number of connections to create for each step of requests. As the time taken to attempt a number of connections is dependent on the rate the connections are created, a more convenient alternative is re- placing num_conn with const_test_time. Const_test_time specifies how long the test should continue, automatically calculating the value for the number of connections for all request rates during the testing. Timeout sets the value in sec- onds to how long a request is allowed to last before it is considered a failure. A longer timeout value causes a greater fd (file descriptor) usage than a shorter, increasing the risk for stability issues for the system under test. The file option simply specifies the name of the file where the results are stored. In theory, almost any benchmarking program could have been run on several ma- chines simultaneously, and then manually combine the results, autobench helps auto- mate this process for httperf. Two programs are provided together with autobench: autobench_admin and autobenchd. Their purpose is to make the usage of several ma- chines for testing convenient. The idea with these programs is that autobenchd is run on all client machines and one of them runs autobench_admin. Autobench_admin distributes the required requests between all client machines. After the instances of autobenchd have completed their part of the test, the results are collected and com- bined by autobench_admin. With the basic configuration the requests are distributed equally among all autobenchd instances. This has two implications. The first is that the requested number of connections must be evenly dividable between all instances. The second is that in order to get clean results, all client machines should only be requested 26
  • 34. to create a number of requests that the used machines are able to produce. The results from a test where the client machine has not been able to produce enough request due to limitations of its own, look similar to results where the server that is being tested is not able to reply to the requests. In the results file, autobench stores the number of requests that were supposed to be requested, followed by the number that actually was attempted and the number of connections created. Statistics on what the minimum, mean and maximum number of requests during the test is also provided. The amount of bandwidth used, and the number of errors is also listed. As the tests are run several times, trends are easily detectable. Especially short and sudden interference is generally obvious, interference that remains constant is more difficult to detect. By running the tests several times, and with an increasing load, more information is generated on how the server responds to a varying number of connections and requests. Testing several times with similar test parameters also gives an overview and helps verify if something has interfered with the test. As illustrated in Figure 3.5, the test was set up so that the machines that were to be benchmarked, were connected through Ethernet to the client machines that created the requests. In order to make sure that the server was the bottleneck in the final tests, i.e. that the data produced were meaningful; the test was run several times with slight variations in the test parameters. To guarantee that the client machines were able to create enough traffic, the same tests were run using an increasing number of client machines. If the results remained close to the same, even if the number of client machines was increased, the load created by the client machines was sufficient. The number of served requests was set as the metric for performance. The only requirement was that the requests being counted would be served within five seconds, the rest of the responses were discarded. Any other quality of service aspects such as the number of unanswered request were ignored, as the focus was on maximum performance rather than quality of service. The original plan was to leave all installations of the Apache 2 http server in their default configurations to get a generic comparison. It soon became clear that the de- fault configurations for the Apache server installations were not identical. Although the same version of Apache (Apache 2.2) was provided with all Linux distributions that were used, the configurations varied. It was expected that there would be differ- ences such as where configuration files were located on the different distributions, but 27
  • 35. not that the default configurations would differ. The main difference was that on the Apache installation on the Fedora machine, the keep alive option was disabled, this was changed to be enabled on all machines. By running the same static page fetching test, but using files of different sizes and monitoring the bandwidth usage, it was decided if a file could be used safely without getting problems with the available network bandwidth. Small file size was required as the Versatile Express was equipped with only a 10/100 Mbps Ethernet card rather than Gigabit Ethernet. The performance of the reference machine was expected to serve a large number of requests resulting in a high bandwidth usage even with small files. In tests where small files are used, the overhead caused by the underlying protocols becomes significant. Figure 3.5: Test setup for Apache test 3.3.2 Basic Erlang performance benchmarks To evaluate the performance of the Erlang Virtual Machine (VM) running on the test machines some general performance benchmarking was done. A set of micro bench- marks running on the Erlang VM was used. Some of the benchmarks were able to make use of more than one core on the host machine, while others did not gain any notable benefit compared to running on just one core. The micro benchmarks are de- signed to stress different parts of the VM. While these tests do not emulate a realistic service producing scenario, they do give information of the general performance levels 28
  • 36. of different parts of the systems. This information can then be used to compare the performance of the VMs running on different platforms, and provide a way to estimate how well different applications could be expected to run. The results are included as Appendix A. Due to reasons such as insufficient memory in the test hardware, not all benchmarks were run on all available test platforms. If a benchmark was not able to run on all machines, the results from the benchmark was also not analyzed for the rest of the machines either. 3.3.3 SIP-Proxy An Erlang based SIP-Proxy (Session Initiation Protocol Proxy) was tested to find out how well an ARM Cortex-A9 would perform in telecom applications. The perfor- mance of the SIP-Proxy was measured in the number of calls per second it could han- dle. The metric for energy efficiency for the proxy was decided to be the number of calls the proxy could handle for each Joule used. As the proxy is running on top of Erlang, the results from this particular proxy reflect the result from the Erlang micro benchmark. The value this benchmark brings comes from giving a performance and energy efficiency evaluation for a realistic service, rather than just parts of the system as the micro benchmarks did. To measure the performance of the proxy, two other machines were used as shown in Figure 3.6. One machine was used to create the messages that should be passed and the other was used as the receiver. Both of these machines were running SIPp, an open source test and traffic generation tool made available by HP. The version used was 3.1 and was compiled from the source. The bandwidth required for the proxy running on a machine capable of only a limited number of calls each second is not big, bandwidth, was thereby not expected to be an issue here. The proxy had a fd leak and in order to avoid issues caused by this, the maximum number of fd:s both system wide, and for each user was increased. During the time the proxy was running there was constantly a small increase in the memory used by the underlying erts. The total memory usage of the system was, however, all in all modest. To get more reliable results and avoid as much interference from the unwanted accumulative use of system resources caused by the fd leak, the proxy was restarted between every test. In order to evaluate the performance of the proxy a definition for when the proxy passed a test was needed. In the reference results provided by Ericsson the proxy had been expected to run for a few minutes. The reference results used in this benchmark 29
  • 37. are from a machine with two Quad Core Intel Xeon L5430 processors and 8 GB of RAM. As the testing focused on processors with lower performance more strict re- quirements were set up. This was done to enable a more accurate comparison between the different ARM Cortex-A9 MPCore processors that were to be tested. Figure 3.6: Test setup SIP-Proxy test The test machines were required to be able to pass all requested messages for a two minute period. The two minute requirement was as a result of two different factors. The first was the requirement used by Ericsson that the new requirement would need to be in line with. The second was caused by the way the proxy used system resources. When running the proxy, the CPU utilization level of the system increased rapidly for a while. After the rapid increase a very slow increase was observable for the entire time the proxy was running. The rapid increase was observed to halt well before the two minute mark for all the tested ARM Cortex-A9 MPCore systems. There was not much need for discussion for an acceptable error rate, as a low sustainable error rate was not encountered during the testing. If the load was not significantly decreased quickly after a failed message caused by a high load, the fail rate would increase rapidly. The erts on both the Versatile Express and the Tegra 250 was recompiled to support profiling using Gprof. Some optimizations had to be disabled from the make files for the erts in order for Gprof to work. Gprof shows function calls executed by a specific program, Oprofile was also used as it has the ability to perform system wide profiling. To enable profiling using Oprofile the kernels on both machines were recompiled. As the profiling has a negative effect on system performance the profiling enabled versions 30
  • 38. of both the erts and the kernels were not used when obtaining results for maximum performance in any benchmarks. The versions that supported profiling were only used to find reasons for unexpected anomalies and performance differences. 3.4 Summary To evaluate the energy efficiency of the ARM Cortex-A8 and the Cortex-A9 MPCore, compared to processors built on the x86-architecture for server tasks, a set of test hard- ware has been used. To evaluate the performance of the Cortex-A8 a BeagleBoard is used. Evaluating the Cortex-A9 is done using a Tegra 200 development kit with a Tegra 250 chip, and a Versatile Express with a CoreTile Express. An Apache 2.2 HTTP server is used to evaluate the energy efficiency of the Cortex-A9 MPCore processor, compared to an Intel Xeon processor when serving static files to clients. The perfor- mance for running the Erlang VM on the test machines is evaluated directly using a set of micro benchmarks, as well as a Erlang based SIP-Proxy. 31
  • 39. 4 P ERFORMANCE COMPARISON This chapter explains the individual executions of the benchmarks. After each bench- mark execution the corresponding results are presented. The results from the execu- tions are followed by performance comparisons. After the pure performance compar- isons the energy efficiencies will be compared. All energy efficiency comparisons in this chapter focus on the energy consumption off the processors themselves, rather than on the total consumption of the computers being benchmarked. 4.1 Apache results After reaching its peak performance in this particular test the performance of the Ver- satile Express dropped quickly, and in the end made the server unresponsive. This can be seen in Figure 4.1. This happened sometimes before reaching full CPU utilization. A reason for this could be the network implementation on the Versatile Express. If enough interrupts are generated in order to handle TCP packets it eventually leads to a situation where an increasing part of the runtime is used up by interrupts and thus leaving a decreasing amount of resources available to actually provide the intended service. This has not been proven to be the case here, but is a viable possibility. To deal with the unresponsiveness the test machine was restarted between tests. When benchmarking the machine with the two Intel Quad Core Xeon E5430 pro- cessors using the same test parameters as for the rest of the machines, the test proved to not be CPU intensive enough as full CPU utilization was not achieved. In order to find the bottleneck, the number of clients was increased. The test was run using both ten and five client machines. As the results were the same in both tests the performance of the client machines was not a bottleneck. The bandwidth was tested by redoing the test using a larger file than the original. The result from the test with the larger file was close to that of the original test, with the biggest difference being a higher bandwidth 32
  • 40. Figure 4.1: Comparison between CoreTile Express, Tegra and an Intel Pentium 4 pow- ered machine running the Apache HTTP server. usage. The system reported no shortage of available memory in any of the Apache HTTP server benchmarks. The machine with the two Quad Core Xeons was able to serve 36000 requests per second when a hundred requests were made for each connection. For ten requests for each connection the result was only 6200 requests/s. The data transfer during the test with 36000 requests per second was reported by Autobench to be 11600 KBps. Compared to the theoretical maximum bandwidth for a gigabit network (131072 KBps) the used bandwidth was less than 10 percent. Although the theoretical bandwidth is generally not achieved in a real life network, more than 10 percent is achievable. In addition, higher data transfer rates from the same server, using the same network was achieved using a larger file. As the network seemed an unlikely bottleneck, other parts of the test setup was inspected. The machine running the Apache server reported 60 33
  • 41. percent CPU utilization for the test with 36000 requests and 10 percent for the test with 6200 requests. If the CPU utilization level and web server performance would continue having the same relation to each other, the performance in both cases is around 60000 requests per second with full CPU utilization. Figure 4.2 show the CPU utilization at a few points during the Apache test for the dual E5430 machine. Assuming the performance for one E5430 running at 100 percent is the same as the performance of two running at 50 percent, the performance for one E5430 is 33000 requests per second. Figure 4.2: CPU utilization during test on machine with two Quad Core Intel Xeon E5430 processors The results from the Apache test shown in Table 4.1 are from fetching a static file of size 10 Bytes. 10 Calls per connection and 100 calls per connection were requested in the tests. The better results from the two benchmarks were used. The performance for the Tegra 250 was more or less the same when making ten or a hundred requests for each connection. For the comparison machine with the two Xeon processors the difference was approximately a multiple of ten. The better results were used for the 34
  • 42. Machine Request / second Requests / Joule Quad Core Intel Xeon E5430 (2.66 GHz, 80 W) 33000 413 Pentium 4 (2.8GHz) 7100 80 Dual Core Cortex-A9 MPCore (1 GHz) 4600 4600 Quad Core Cortex-A9 MPCore (400 MHz) 3400 2833 Cortex-A8 (600 MHz) 760 760 Table 4.1: Ability of Apache 2.2 to serve a 10 byte static files using different hardware comparison. The test results can be seen in Table 4.1. As it can be seen in the table the Tegra 250 managed to serve 4600 requests per second and the Versatile Express 3400 requests per second. The performance difference of the Versatile Express compared to the Tegra 250 is likely caused by both the slower clock frequency of the CPU and the network implementation. The difference in combined clock frequencies between the two processors on its own is slightly less than the performance difference. The combined number of clock ticks for the Versatile Express is (400 * 4) 1600 and 2000 (1000 * 2) for the Tegra 250. Comparing these, the Versatile Express has 80 percent of the clock ticks of the Tegra 250. The performance of the Versatile Express is in comparison slightly less, 74 percent of that of the Tegra 250. The results from the Apache tests were mainly compared against a machine with two Intel Quad Core Xeon processors running at 2.66 GHz. To provide a more com- prehensive comparison, and more reference points a machine with a Pentium 4 (2.8 GHz) was also benchmarked. While the machine that has the more traditional server processors outperforms the tested Cortex-A9 processors, the Cortex-A9 processors do well taking their energy consumption into account. The Intel Xeon processor (E5430) that was used in the reference machine has a reported maximum thermal design power (TDP) of 80 W, while the Quad Core Cortex-A9 according to performed tests has a maximum measured power consumption of 1.2 W. The rightmost column in table 4.1 shows the number of answered calls produced per Joule used. A clear improvement in energy efficiency is visible, starting from the Pentium 4 to the Dual Core ARM Cortex-A9 MPCore. Figure 4.3 shows the energy efficiency comparison as a bar diagram. Figure 4.3 indicates a energy efficiency of about 6,9 times the performance per 35
  • 43. Joule for the Versatile Express compared to the Intel Xeon. The results can be assumed to be a bit better for the Intel Xeon in practice when its actual power consumption is taken into account. The actual power dissipation of the Quad Core ARM was, however, also below 1 W during the test rather than the measured maximum of 1.2 Watts that was used for the calculations. As there are no actual numbers available for the power consumption of the CPU on the Tegra 250 board the estimate of 1 W is used for its power consumption. For the Tegra 250 the energy efficiency compared to the reference Intel Xeon processor was approximately 11,1 times better. A clear improvement in energy efficiency is also visible between the Pentium 4 processor and the Xeon. This improvement is an indication on the energy efficiency improvement for Intel’s x86 based processors. One of the major improvements from the Pentium 4 to the Xeon L5430 is the manufacturing technology that has improved from 90 nm to 45 nm. Figure 4.3: Number of requests handled for each Joule used by the CPU 4.2 Emark results A set of benchmarks called Emark was used to evaluate the performance of the erts. The benchmarks are meant to be used for evaluating Erts and its performance on par- ticular hardware. The tests packet included a set of baseline results for comparison. 36
  • 44. The benchmarks can be used to test the performance of either different erts implemen- tations or to compare different hardware against each other. In the results the same versions of the erts was used in order to make the results as much dependent on the differences in hardware as possible, rather than differences in software. The different benchmarks returns results using different metrics, some measure time while other the number of transactions and the Stones test gives the results in “stones”. All the results shown here are a comparison to the baseline results if not something else is mentioned. They are to be interpreted as how many times worse the tested systems performed than the baseline. Regardless of the metrics in the original benchmarks. A lower score in these results is always better and should be interpreted as how many of these machines would theoretically, in a perfect world, and without any overhead be needed to replace the baseline machine in the particular test. The machine used for the baseline has a Dual Core Intel E6600. The chip is built using a 65 nm technology and has a TDP of 65 W [28]. Among the tests that were run was a message passing test called “big bang”. It creates a thousand processes and every process sends a “ping” message to every other process, every process that receives a “ping” responds with a “pong” message. An advantage to the message passing test in the Stones benchmark is that it is capable of using more than one core. The inability to effectively use more than one core at a time is something that holds true for all the tests in the Stones benchmarks. This can easily be seen in Appendix A. Table 4.2 shows how the different machines performed in the benchmark compared to the baseline results. All results in the table are measured using as many OS processes as there are available cores on the particular test machine. The BeagleBoard uses an erts implementation without SMP support and the others runs SMP enabled erts implementations. Most of the benchmarks here have been run several times with different parameters and the results in the table are average values. If results for some test was not available the results from the corresponding test on the other machines has also been omitted. Short explanations of what the different benchmarks test are given in Table 4.3. Most of the benchmarks in Table 4.3 gets better results when using more than one scheduler, there are, however, some exceptions. The results show that the bench- marks codec, containers and Msgq does not gain any benefit from using more than one scheduler. 37
  • 45. Test BeagleBoard CoreTile Express Tegra 250 Bang 17.8 14.2 6.7 Big 38.8 12.3 9.7 Chameneosredux 5.6 17.3 6.7 Codec 19.4 19.9 7.0 Containers 34.4 30.2 14.1 Ets _ test 10.7 5.9 3.7 Genstress 17.6 14.4 7.6 Mbrot 40.3 12.9 8.5 Msgq 1.0 1.5 0.9 Netio 29.3 12.4 12.6 Table 4.2: Performance of ARM test machines compared to Baseline results Test Explanation Bang All to one message passing Big All to all message passing Chameneosredux Shake hands with everyone Codec Encode Decode binaries (test binary to term) Containers Adds and lookups in containers (ADT’s) Ets _ test Ets insert/lookup (also in parallel) Genstress Genserver test Mbrot Mandelbrot calculations (concurrent, number crunching) Msgq Message queue bashing Netio TCP messages Table 4.3: Explanations on what the benchmarks evaluate 38
  • 46. SMP1 SMP2 SMP3 SMP4 Baseline 12998 10820 BeagleBoard 284375 V2P-CA9 248217 141691 105538 106230 Tegra 250 102404 102403 Table 4.4: Results from Netio benchmark The benchmark named Netio that tests TCP messages shows an interesting behav- ior. The results from the benchmark are visible in table 4.4. As a difference to table 4.2 the results in this table are the direct output from the benchmark. According to the source code for the benchmark the values represents milliseconds. A lower result is better. In this particular test run the following test parameters were used. 200 Connec- tions, 1000 packets and a packet size of 10000. There is a clear increase in performance when adding more schedulers from one to three for the V2P-CA9. Between three and four schedulers the test shows no further improvement, it actually show a decrease. The decrease is still small enough to be discarded, due to the fact that the test results differ slightly between the different test runs. For the Tegra 250 the results for one and two schedulers are basically identical. The difference between the best results for the CoreTile Express and the Tegra 250 is only three percent. The benchmark is designed to stress the packet receive and accept processes and is not affected by external factors, as it is not dependent on I/O. The results from the Stones benchmark is shown in Table 4.5. The table shows that the performance of the Tegra 250 is consistently better than the one of the V2P-CA9. The interesting thing is that the BeagleBoard outperforms not just the CoreTile Express but also the Tegra 250 in some of the benchmarks. As only the Links benchmark is able to gain any benefit of using more than one core the BeagleBoard has an advantage over the CoreTile Express with its higher clock frequency in the rest of the benchmarks. In the small and medium message passing benchmark, it is even faster than the Tegra 250. 39
  • 47. Test BeagleBoard CoreTile Express Tegra 250 List manipulation 26 25 11 Small messages (message passing) 10 35 14 Medium messages 13 34 14 Huge messages 17 28 11 Pattern matching 32 30 14 Traverse 35 27 13 Work with large dataset 32 26 12 Work with large local dataset 35 28 13 Alloc and dealloc 22 23 10 Bif dispatch 11 18 7 Binary handling 15 27 11 Ets datadictionary 27 46 19 Generic server (with timeout) 15 37 15 Small Integer arithmetic 30 23 12 Float arithmetic 31 37 9 Function calls 38 30 13 Timers 10 26 8 Links 18 9 8 Table 4.5: Results from the Stones benchmark compared to the baseline 40
  • 48. 4.3 SIP-Proxy results Ericsson provided reference results for the benchmark. The machine used for this comparison has two Quad-Core Intel Xeon L5430 processors running at 2.66GHz. The test result for the reference machine is presented in table 4.7. If the CPU is the bottleneck the performance increase is approximately dependent on the amount of CPU resources available, in this case, the number of cores. As visible in Table 4.7 this is not the case. There is a significant performance improvement all the way from one scheduler (SMP1) to four schedulers (SMP4). When the number of schedulers is increased from four to eight, there is only an increase of 50 calls/s, although the number of available schedulers, and thereby cores, has doubled. This indicates that the results are dependent on something else than the pure processing power of the processors. As the focus is on processor performance and energy efficiency, results that are not dependent on the processors themselves, is to be avoided. Only the results from one to four cores will be used, in practice considering the reference machine as having only one Quad-Core processor, using only the energy required by one, rather than two processors. An issue with comparing the energy efficient in this test is that the only energy consumption data available is the TDP information provided by the manufacturer. According to the information available on Intel web page the maximum TDP of the L5430 is 50W and that it is manufactured using a 45 nm process [14]. In the datasheet for the 5400 series on page 87 however, it is stated that the TDP for the L5400 series is also 50 W [13]. When evaluating the performance of the SIP-Proxy the Versatile express was able to handle 30 calls/s. The reference machine with its Intel Xeon L5430 was able to handle 350 calls/s. Both machines were tested using different numbers of schedulers (1-4), these results can be seen in Table 4.8. By taking into account that the CPU of the reference machine has a maximum TDP of 50 W compared to the measured maxi- mum consumption of 1.2 W used by the Cortex-A9, the Cortex-A9 performs well. By comparing the throughputs and the power consumptions, it can be seen that the Cortex- A9 can handle 3.5 times more traffic for each watt it dissipates compared to the Intel Xeon. An issue in this comparison is that the energy consumption listed for the Xeon is according to the manufacturer rated TDP, and not actual measured maximum energy consumption. To compensate for this the maximum measured energy consumption for the Quad Core Cortex-A9 is also used for comparison. The power consumption during the benchmark was measured using the VD10_S3 register on the CoreTile Express, 41
  • 49. Calls/s CPU utilization Power avg 1 19 0.54 5 38 0.65 10 51 0.66 15 66 0.85 25 88 0.91 30 98 0.95 Table 4.6: CPU utilization and average CPU power consumption for the CoreTile Ex- press during SIP-Proxy benchmark SMP1 SMP2 SMP4 SMP8 Calls / Second 130 240 350 400 Table 4.7: Performance of reference machine with two Quad Core Xeons with different numbers of schedulers and the average values are shown in Table 4.6, together with the CPU utilization and the number of calls the proxy was subjected to. During this particular test where the energy consumption was measured, SMP 8 was used. The power consumption is also presented in graph 4.5. It is noteworthy that no DVFS is available on the CoreTile Ex- press reducing the possibilities for precise reduction of energy consumption in relation to the load. As the erts does not generally benefit from using more schedulers than there are available CPU cores on the host machine, the results for those tests are not listed here. The strange thing about these test results is that the Tegra 250 performs significantly worse than the Versatile Express. In other benchmarks the Tegra 250 has consistently over performed the CoreTile Express, except in this and the TCP message benchmark, that is part of the basic Erlang benchmarking presented previously in this chapter. While the Versatile has the advantage of having double the number of CPU cores the 42
  • 50. Figure 4.4: Graph showing the CPU utilization for CoreTile Express during SIP-Proxy benchmark Tegra 250 has more than double the clock frequency on its cores. As visible in Table 4.8, the performance for the Versatile Express and the Tegra 250 is very similar when using the same number of cores. When using one core the difference could be due to a static overhead of running the proxy but the results from using two cores are not as easily dismissible. The main question here is why an almost identical performance increase is achieved when adding a core running at 400 MHz and one at 1000 MHz. If the test machine running at 1 GHz would not report almost full CPU utilization, it would be clear that the CPU is not the bottleneck, but this is not the case here. As the performance of the proxy when running on the Tegra 250 was not as ex- pected from the technical data available and our previous benchmarks, additional steps to certify the results were taken. The erts on both the Tegra 250 and the CoreTile Ex- press was recompiled from the same source in the same way using the same version of GCC and using the same version of the libatomic library (7.2 alpha 4). As this did not cause any difference in the results the erts was again recompiled with a few changes to support profiling using Gprof. The performance on the CoreTile Express was af- 43
  • 51. Figure 4.5: Power consumption for the CPU in CoreTile Express during SIP-Proxy test fected more by running Gprof than the Tegra 250. With the profiling enabled the Tegra 250 could handle nine calls per second, while the CoreTile Express could handle six for a two minute period using SMP2, as can be seen in table 4.9. A test was then performed using five calls per second and SMP2 for two minutes on both machines, while profiling using Gprof. The biggest difference between the number of function calls and time spent in different functions, was in functions that have to do with atomic read functions. This is caused by the fact that the schedulers are frequently left without work, and at that point, in an attempt to optimize, spins over a variable to check for more work. To match the throughput between the two test machines the Tegra was not under maximum load causing the schedulers to be without work more often than on the V2P-CA9. Other significant differences were not observed. In order to profile system wide rather than just the erts the kernels on both the Tegra 250 and the CoreTile Express was recompiled to support Oprofile. Oprofile showed that when running on as high load as possible the Tegra 250 spent 31,6 % of its time running vmlinux, while the CoreTile Express spent 20,6 %. The times spent running the erts were 65 % and 44
  • 52. Figure 4.6: Graph showing performance of reference machine with two Quad Core Xeons using an increasing number of schedulers 67 %. To make sure the issue was not caused by problems with the OS the installation on the Tegra 250 was replaced by a backup of a older version of Ubuntu that the board had originally been tested with, before the evaluation started, and thereby the changes possibly caused by it. The results remained the same from the previous tests. Being unable to find a reason for the benchmark results even after great effort ARM agreed to redo the measurements. They same erts was used and the same installation of the proxy-server. The kernels used were also compiled separately although both were of version 2.6.32. ARM reported the same results as produced earlier with the Tegra 250. The cause for the unexpected performance difference is still unknown. The energy efficiency for the SIP-Proxy is shown in Figure 4.7. The energy ef- ficiency difference between the Versatile Express and the Tegra 250 is close to the performance difference, around half. Compared to the Versatile Express the Xeon uses approximately 3.6 times more energy for each call. Compared to the Tegra 250 the 45
  • 53. SMP Intel Xeon Quad Core Cortex-A9 Dual Core Cortex-A9 (2.66GHz) MPCore (400MHz) MPCore (1 GHz) 1 130 5 5 2 240 12 13 4 350 30 13 Table 4.8: How many calls the SIP-Proxy can handle using different hardware and number of schedulers SMP CoreTile Express Tegra 250 SMP4 10 9 SMP2 6 Table 4.9: How many calls the SIP-Proxy on can handle on the CoreTile Express and Tegra 250 while profiling using Gprof Figure 4.7: Number of calls handled for each Joule used by the CPU energy consumption is approximately 1.9 higher for the Xeon. 46
  • 54. 4.4 Summary The performance of the test machines with the ARMv7 -architecture based processors have been compared to machines with x86 -architecture based processors. While the individual performance of the more energy efficient ARM processors is lower than that for the processors traditionally used in servers, the energy efficiency is better. In the Apache HTTP server benchmark the energy efficiency of the Dual Core Cortex-A9 processor was over 11 times that of the Intel Xeon E5430. The processor with the best energy efficiency in the SIP-Proxy benchmark was the Quad Core Cortex-A9 with a 3.5 times better energy efficiency compared to the Intel Xeon L5430. 47