Decoding Digital Impact in FMCG - Google & BCG Study 2017 - Deck.pdf
•
0 likes•13 views

The impact of doing things in an environment which produces required results as expected.

Recommended
Recommended
More Related Content
Similar to Decoding Digital Impact in FMCG - Google & BCG Study 2017 - Deck.pdf
Similar to Decoding Digital Impact in FMCG - Google & BCG Study 2017 - Deck.pdf (20)
Recently uploaded
Recently uploaded (20)
Decoding Digital Impact in FMCG - Google & BCG Study 2017 - Deck.pdf
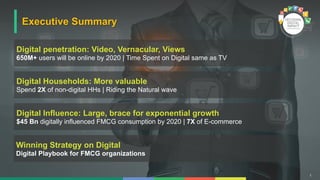
- 1. 1 Executive Summary Digital penetration: Video, Vernacular, Views 650M+ users will be online by 2020 | Time Spent on Digital same as TV Digital Influence: Large, brace for exponential growth $45 Bn digitally influenced FMCG consumption by 2020 | 7X of E-commerce Winning Strategy on Digital Digital Playbook for FMCG organizations Digital Households: More valuable Spend 2X of non-digital HHs | Riding the Natural wave
- 2. 2
- 3. 3 India's internet user base expected to surpass the population of G7 countries ~600–650 Million 650+ Million ~390 Million Population of G7 countries Internet users in India 2020 2020 2016 Sources: TRAI, March 2017, BCG CCI Digital Influence Study, 2016
- 4. 4 Time spent on digital is the same as time spent on TV in 2016 Video Vernacular Views Print Digital TV Time spent by urban internet users with digital access on various media channels (Hours/day) in 2016 Source: BCG CCI Digital Influence Study, 2016
- 5. 5 Digital Video has grown significantly over the past 2 years 60M 200M+ Digital Video Reach 2015 Digital Video Reach 2017 3X in 2 years 275M 2/3 of TV Reach Urban TV Reach 2017 Source: BARC Broadcast Survey of India 2016 (BARC Urban Universe 15+); BCG analysis
- 6. 6 Significant boom in Digital Video since last year Video calls 28% Video downloads 31% Video online 42% Gaming 11% Music downloads 14% Online music 24% Key activity being tried out for the first time on mobile by adopters on a new entrant's network Given as a % of users trying the mentioned activity for the first time Source: BCG TiE Billion Digital Volcano Study, 2017
- 7. 7 Consumers are increasingly searching, viewing and demanding content in their local language Growth in ‘Local language’ searches over the past 18 months Higher growth in Hindi content consumption on websites than English content Growth in watch time for ‘Regional’ content on YouTube 2X 5X 10X 88% of Indian language internet users are more likely to respond to a digital advertisement in their local language vis-à-vis English Sources: Google Internal Data, Indian Languages - Defining India’s Internet report 2017
- 8. 8 Consumers turn to digital to look for “Views” of Advocates On YouTube… Cooking Watch Time YoY Growth Beauty & Fashion Watch Time YoY Growth 6x 5x …and on Search 100 90 45 Food & Recipes Beauty & Personal Care Baby Care Home Care 5 Sources: Google Internal Data, YouTube Watch Time growth in H1’17 vs H1’16, Indexed Searches (Jul’16-Jun’17)
- 9. 9 Higher searches for “Problem Solutions” vs “Products” Hair Treatment Skin Treatment / Dark circles Whitening 5x 1.8x 7x Hair growth / fall Acne/ Pimple Pain / Ache 5x 1.9x 32x Hair style Home remedy for skin Ulcer 6x 6x 2x Hair oil Moisturizer Toothpaste 2x 1.6x x Shampoo Cream Toothbrush x x 2x 3x 0.6x Top searched brand Hair Care Skin Care Oral Care Top searched brand Top searched brand 4x Sources: Google Internal Data Jan’17-Jun’17; Relative Search Volume for different spaces
- 11. 11 Consumers with digital access spend more 2X more on FMCG than offline consumers Personal Care Food and Beverages Home Care 1.4 Air Freshener Floor Cleaner Washing Powder Detergent Bar 4.4 2.4 1.1 1.9 Soups Chocolates Milk Food Drinks Edible Oil 5.4 2.9 1.1 1.8 Deodorants Diapers Shampoo Hair Oil 3.7 2.8 1.2 Relative spends on purchased product in Online Household to Offline Household; Online Household defined as a household with access to internet via Desktop, Laptop, Tablet or Smartphone Source: IMRB Kantar Worldpanel 2016
- 12. 12 Consumers with digital access spend even more on Natural brands Shampoo Average Natural Brands 1.8 2.2 +22% Skin Cream Average Natural Brands 1.4 2.3 +64% Toothpaste Average Natural Brands 1.2 1.5 +25% Relative spends on purchased product in Online Household to Offline Household; Online Household defined as a household with access to internet via Desktop, Laptop, Tablet or Smartphone Source: IMRB Kantar Worldpanel 2016
- 14. 14 $45 Bn digitally influenced FMCG consumption by 2020 2016 2020 7-10 Billion (10-15%) 45 Billion (40%) 7X of E-commerce in 2020 E-commerce Digitally influenced spend $ 6-7 Billion $ 45 Billion* Digital influence is defined as the use of internet for conducting pre-purchase, purchase & post-purchase activities Sources: BCG CCI Digital Influence Study – 2016; BCG – RAI report: “Digital in Retail”, Feb 2017; *Constant currency
- 15. 15 Digital Influence by Category <25% Grocery Snacks Oral Care Household Care Baby care & Pediatric Health food Nutraceuticals Skin Care Male Grooming Hair care (Shampoo & conditioner) Fragrances 25-50% >50% Medium Low High to Very High Beverages Digital influence is defined as the use of internet for conducting pre-purchase, purchase & post-purchase activities Sources: BCG CCI Digital Influence Study – 2016
- 16. 16 28M Elite + Affluent HHs contribute 60% of digitally influenced consumption 16 Elite Affluent Aspirers Next Billion + Strugglers 10 (4%) 11 (4%) 20 (8%) 224 (84%) 31 (11%) 228 (80%) 15 (5%) 13 (5%) Type of HH basis annual income No. of HHs (Million) 2015 No. of HHs (Million) 2020 Consumption Contribution 2020 Digitally influenced FMCG consumption 2020 39% 22% 40% 18-20% 18-20% 60-65% 265 Mn 287 Mn TOTAL Sources: BCG CCI Digital Influence Study – 2016; BCG – RAI report: “Digital in Retail”, Feb 2017
- 17. 17 Higher digital influence observed in relatively underpenetrated categories Perfumes Baby care 2x Shampoo & Conditioner 2x Face cream, moisturizer Dietary supplements Health / nutrition food Underpenetrated categories Penetrated categories Hair Oil Grocery & staples Packaged food & bev. Washing powder Home cleaner 5x 5x 5x 3x 1.2x 1.5x 1.5x 1x 1x Personal care Food & Beverages Consumer health Home care Source: BCG CCI Digital Influence Study – 2016
- 18. 18
- 19. 19 Digital spends ≠ Time spent by consumers on digital Digital Others 10% 90% 2016 While costs of online video advertising reduced by 66% in last 2 years x 1/3x Share of advertising spend on different formats (%); Others includes Print, TV, Radio, Cinema and Outdoor. Sources: Pitch Madison Advertising Report – 2017; Google Internal YouTube Auction Data, 2017; BCG analysis
- 20. 20 Advertisers lagging due to multiple reasons (1/2) z z 13 13% Lack of awareness of importance of digital Intertia of current way of working/ traditional media Limited capability in the organization for digital Lack of clarity on what to do in digital / returns from digital 63% 13% 38% What stops you from spending more on digital? Source: BCG–Google CXO Survey, Aug-Sep 2017
- 21. 21 Advertisers lagging due to multiple reasons (2/2) Metrics in place but limited linkage to business results Clear understanding on returns on digital spend with defined metrics Limited understanding of returns from digital campaigns 75% 25% 0% Which of the following best represents your current state on digital impact measurement? Source: BCG–Google CXO Survey, Aug-Sep 2017
- 22. 22 Companies aware of importance but leadership not spending adequate time on driving digital 0 38 63 Top 3 75% <10% of the management committee's time >10% of the management committee's time 25% Do you see using digital as one of the top priorities for your business? Is the progress on digital strategy clearly monitored and discussed in the management committee? Source: BCG–Google CXO Survey, Aug-Sep 2017 Top 5 Top 10
- 23. 23 Magnitude and shape of digital influence varies significantly based on “intent” of consumption & category penetration… Penetrated categories Eg: Soap, Home cleaner, Edible oil etc. Intent: ‘Conventional’ Usage Intent: 'Solutions' space Under-penetrated categories Eg: Hand-wash, Deodorant, Conditioner etc. 'Problem solutions' space Eg: Weight loss, Natural breakfast, Hair style etc. Increasing order of digital influence
- 24. 24 …thus, brands can follow a simple approach to understand how best to approach digital Use digital as one more medium to engage the customer Think ‘digital first’ to target the right customers & create / adapt content specially for digital Drive association with trust, build familiarity, & use insights for innovation Penetrated categories Underpenetrated categories Remain relevant & capture attention Think digital first, invest in online for cat. creation Establish content destination backed by authority of trust Intent: ‘Conventional’ Usage Intent: 'Solutions' space Increasing order of digital influence 'Problem solutions' space
- 25. 25 Share of digital in ad spend for FMCG can potentially grow to ~30% by 2020 Digital Share of advertising spend on different formats (%) 25-30% Others 70% 2020 Can be significantly higher for select, premium spaces 50-75%
- 26. 26 Key implication for the FMCG Companies The New Reality Call for Action Institute the right measures of performance for digital spends and build capability in the org Leverage digital across touch points in consumer journey Actively create and shape the digital strategy around the 3’V’s Invest in 'data driven' marketing to win with these HHs Index the extent of digital basis relevant category; differentiated approach for different spaces Digitally influenced spend in FMCG likely to rise to $ 45 Bn by 2020 Significant growth of 3Vs – Video, vernacular, views Spends in digital under-indexed: organizations unclear on how to leverage digital effectively 10% of households to account for 60% of digitally influenced FMCG consumption by 2020 Extent & nature of digital influence depends upon the intent of consumption & category penetration
- 27. ARE "WE" READY TO MAKE THE SHIFT?