SlideShare a Scribd company logo
1 of 31
Phone   A survey to investigate

  for
        the most trending mobile
        phone brands


 you!                            Presented by:
                        Hp9girls.wordpress.com
Outline
Introduction
  What is a Mobile Phone?
  Our Hypothesis
  Survey's Objectives

Methodology
 Advantages of our chosen graph
 Graphs

Conclusion
Introduction
W hat is a mobile
phone?
A mobile phone is a por table
wireless device that wor ks the same
as a standar d wired telephone.

T he fir st mobile phone was invented
in 1973 by Mar tin Cooper who wor ks
for MOTOROLA.
Introduction
Mobile phones are necessary for university
students to keep up with their studies.

The investigation was carried out inside the
University Brunei Darussalam ground.

The people who participated in this survey
were only from the Unibridge’s students
intake August 2012.
hypotheses                   We assume that...


Every student owns a mobile phone.

iPhone is the most popular brand among the
Unibridge students.

The affordable price range of mobile phones is
around B$500.

Other than texting, phone calls and easy internet
access, Unibridge students buy a certain mobile
phone because of its features.
To find the most popular phone brand owned
currently and previously:
 - Overall Unibridge students
 - Male students
 - Female students

To find out the affordable price range of mobile
phones bought by the students.

To find the factor that affect an individual to choose
a certain brand.


                         objectives
Methodology
  We made a decision to use pie charts, bar graphs
  to show our data.

  Advantages of Pie Chart?
Pie chart displays data as a percentage of the whole.
Each pie section should have a label and percentage.
A total data number should be included.
It is also visually appealing and it also shows the
percent of total for each category.
Methodology

  Advantages of Bar Graph?
Bar graph is an excellent way to show the results
that are one time because it is not in a continuous
form.
From the graph shown below the data is in
categories which you can easily read and
understand.


.
n o . o f p a r tic ip a n ts
90
                                  81
80

70

60

50

                                              n o . o f p a r tic ip a n ts
40

30    26

20

10

 0
     M a le                    F e m a le
N o . o f U n ib r id g e S t u d e n t s
100
 90
                 93
 80
 70
 60
 50
 40                                                                 N o . o f U n ib r id g e S t u d e n t s
 30
 20
 10                                             14
  0
      o n e m o b ile p h o n e   m o r e t h a n o n e m o b ile
                                              phone
Figur e A : CURRENTLY (93 Number of
  Students own one mobile phone)

             P e r c e n t a g e o f U n ib r id g e S t u d e n t s

                          2%
        1%        9%


  1%    3%                                    25%
                                                                       N o k ia
                                                                       Sam su n g
   5%
                                                                       iP h o n e
                                                                       S o n y E r ic s s o n
                                                                       M o t o r o la
                                                                       LG
  17%                                                                  PDA
                                                                       O th e rs
                                                                       N o H andphone


                                       37%
Figur e B: PREVIOUSLY (93 Number of
   Students own one mobile phone)

                P e r c e n t a g e o f U n ib r id g e S t u d e n t s

                0%                                             M y c u r r e n t h a n d p h o n e is m y f ir s t
                     5%   3%                                   handphone
      1%   7%                                                  N o k ia


                                                               Sam su n g

 12%                                                           iP h o n e


                                                               S o n y E r ic s s o n

5%                                                             M o t o r o la

     5%                                                        LG
                                            62%

                                                               PDA


                                                               O th e rs
FIGUR C: Co m p a ris o n o f m o bile p ho ne s ' bra nd s a m o ng
     E
       Unibrid g e s tud e nts (s ing le bra nd o wne r)
FIGURE D

P e r c e n ta g e o f M a le S tu d e n ts O w n in g a ty p e o f M o b ile
                          B r a n d ( C U R R E N T LY )
                                                     N o H andphone
                                                            0%
                          PDA
                   LG
                           0%              O th e r s
                   0%
                                             10%
                                                                      N o k ia
                       M o t o r o la                                  25%
                           5%


           S o n y E r ic s s o n
                  10%


                                                                                 Sam su n g
                                                                                   10%


                                        iP h o n e
                                          40%
FIGURE E


P e r c e n ta g e o f F e m a le S tu d e n ts O w n in g a ty p e o f M o b ile
                             B r a n d ( C U R R E N T LY )

                                                    N o Handphone
                                                          3%

                                  PDA
                                  1%        O th e r s
                                              8%
               M o to r o la                                                     N o k ia
                   0%                  LG                                         25%
                                       4%
     S o n y E r ic s s o n
             4%


                          iP h o n e
                            11%


                                                                    Sam su n g
                                                                      44%
Pie Chart (Unibridge student who used more than one
            handphone – PREVIOUSLY)
       Total number of students involved - 14
Pie Chart (Unibridge student who using more than one
             handphone – CURRENTLY)
       Total number of students involved - 14
THE RESULT
In Fig 1
The pie chart shown in the PREVIOUS stastictics shows the
percentage of Unibridge student who owned more than one
handphone at the same time. The statistic shows the type of brand
that were most likely to be used by these multibrand phone owner.
From the result, we found out that 25% of the 14 participants own
NOKIA. 25% own SAMSUNG. Another 25% owned SONY ERICSSON.
The last 25% owned IPHONE.
Total number of students involved: 14 students
In Fig 2
The pie chart shown in the CURRENT stastictics shows the
percentage of Unibridge student who used more than one hand phone
at the same time. From the result, we have observed that 30% of the
student use NOKIA and SAMSUNG. 13% of the 14 student used SONY
ERICSSON. 7% used IPHONE and others. 3% used LG and none used
PDA.
Total number of students involved – 14 students
R e a s o n s fo r c h o o s in g th e b r a n d


          14
                                                      B e tte r fe a tu r e s
                                27
                                                      P r ic e c o m p e titiv e ly

                                                      L o v e th e b ra n d

31                                                    P e e r s a n d fa m ily u s e th is
                                           9
                                                      bran d
                                                      L a ste st m o d e l

                                                      W a n te d fe a tu r e s

                                  23                  O th e r s
     13
                 9
F re q u e n c y a g a in s t p ric e
        45


        40


        35


        30


        25


        20
N
U
Q
R
C
E
Y
F


        15


        10


         5


         0
               B e lo w $ 5 0 0   $ 5 0 0 -$ 8 0 0    $ 8 0 0 -$ 1 2 0 0   A bove $1200   D o n o t tic k a n y
F requ en cy         40                 36                   20                 10                  2
A cc o rd in g to th e b a r g ra p h o n p rice d e s ire d s h o w n :

       T h e re a re 4 0 p e o p le , b o th m a le a n d fe m a le , p re fe rre d $ 5 0 0 b e lo w a s fo r th e m o s t a p p a re n t
        re a s o n is d u e to c h e a p e r p ric e .
       3 6 re s p o n d e n ts , b o th m a le a n d fe m a le , c o n s id e rin g th e p ric e is in b e tw e e n $ 5 0 0 - $ 8 0 0 d u e to
        th e p ro g ra m s a v a ila b le in th e ir p h o n e s .
       2 0 o f th e m c h o se a t ra n g e $ 8 0 0 to $ 1 2 0 0 . T h is m a y e ith e r d u e to tre n d in g a m o n g fa m ily a n d
        frie n d s o r b e c a u s e th e p ro g ra m s a v a ila b le in th a t m o d e l o f p h o n e .
       1 0 p e o p le in U n ib rid g e tic k e d a b o v e $ 1 2 0 0 . T h e y a re d e fin ite ly o n tre n d w ith fa m ily , frie n d s a n d
        e v e ry o n e . U s u a lly th e p h o n e s a re Ip h o n e -A p p le .
       2 o f th e m m is se d to tic k th is p a rtic u la r q u e s tio n .
conclusion
In the past Nokia is the most trending brands among the Unibridge’s
students both in male and female.


Currently i-Phone is the most wanted brand for male, while Samsung
becomes the first choice of brand for female.


Mostly the mobile phones own by the students have a price range
below B$500.


Some students own more than one mobile phone. Majority
multibrand owners use Nokia/Samsung as their alternate handheld
mobile phone.


Generally the factor that affect students to buy certain brands is the
amazing features inside the mobile phones.

More Related Content

Viewers also liked

Socitim scotland conference 2016
Socitim scotland conference 2016Socitim scotland conference 2016
Socitim scotland conference 2016Neopost UK
 
help for ЕГЭ how to write a letter
help for ЕГЭ how to write a letterhelp for ЕГЭ how to write a letter
help for ЕГЭ how to write a lettersalovaee
 
Etechohio2009 1233635778921441-1
Etechohio2009 1233635778921441-1Etechohio2009 1233635778921441-1
Etechohio2009 1233635778921441-1salovaee
 
Icloud keynote2
Icloud keynote2Icloud keynote2
Icloud keynote2avsorrent
 
Ebs 01-content-strategy-1-121019075233-phpapp01
Ebs 01-content-strategy-1-121019075233-phpapp01Ebs 01-content-strategy-1-121019075233-phpapp01
Ebs 01-content-strategy-1-121019075233-phpapp01Rem Sillastu
 
Phone for you! slides
Phone for you! slidesPhone for you! slides
Phone for you! slidesShiro-chi
 
Describe and-improve-your-business-model-1193048778204895-2
Describe and-improve-your-business-model-1193048778204895-2Describe and-improve-your-business-model-1193048778204895-2
Describe and-improve-your-business-model-1193048778204895-2Rem Sillastu
 

Viewers also liked (10)

Socitim scotland conference 2016
Socitim scotland conference 2016Socitim scotland conference 2016
Socitim scotland conference 2016
 
help for ЕГЭ how to write a letter
help for ЕГЭ how to write a letterhelp for ЕГЭ how to write a letter
help for ЕГЭ how to write a letter
 
¿Qué Tiempo Hace?
¿Qué Tiempo Hace?¿Qué Tiempo Hace?
¿Qué Tiempo Hace?
 
Etechohio2009 1233635778921441-1
Etechohio2009 1233635778921441-1Etechohio2009 1233635778921441-1
Etechohio2009 1233635778921441-1
 
Luzymaria
LuzymariaLuzymaria
Luzymaria
 
Catalogue sotefi 2013
Catalogue sotefi 2013Catalogue sotefi 2013
Catalogue sotefi 2013
 
Icloud keynote2
Icloud keynote2Icloud keynote2
Icloud keynote2
 
Ebs 01-content-strategy-1-121019075233-phpapp01
Ebs 01-content-strategy-1-121019075233-phpapp01Ebs 01-content-strategy-1-121019075233-phpapp01
Ebs 01-content-strategy-1-121019075233-phpapp01
 
Phone for you! slides
Phone for you! slidesPhone for you! slides
Phone for you! slides
 
Describe and-improve-your-business-model-1193048778204895-2
Describe and-improve-your-business-model-1193048778204895-2Describe and-improve-your-business-model-1193048778204895-2
Describe and-improve-your-business-model-1193048778204895-2
 

Phone for you! final slides edited again

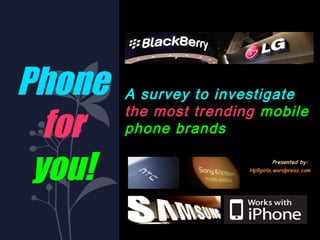
  • 1. Phone A survey to investigate for the most trending mobile phone brands you! Presented by: Hp9girls.wordpress.com
  • 2. Outline Introduction What is a Mobile Phone? Our Hypothesis Survey's Objectives Methodology Advantages of our chosen graph Graphs Conclusion
  • 3. Introduction W hat is a mobile phone? A mobile phone is a por table wireless device that wor ks the same as a standar d wired telephone. T he fir st mobile phone was invented in 1973 by Mar tin Cooper who wor ks for MOTOROLA.
  • 4. Introduction Mobile phones are necessary for university students to keep up with their studies. The investigation was carried out inside the University Brunei Darussalam ground. The people who participated in this survey were only from the Unibridge’s students intake August 2012.
  • 5. hypotheses We assume that... Every student owns a mobile phone. iPhone is the most popular brand among the Unibridge students. The affordable price range of mobile phones is around B$500. Other than texting, phone calls and easy internet access, Unibridge students buy a certain mobile phone because of its features.
  • 6. To find the most popular phone brand owned currently and previously: - Overall Unibridge students - Male students - Female students To find out the affordable price range of mobile phones bought by the students. To find the factor that affect an individual to choose a certain brand. objectives
  • 7. Methodology We made a decision to use pie charts, bar graphs to show our data. Advantages of Pie Chart? Pie chart displays data as a percentage of the whole. Each pie section should have a label and percentage. A total data number should be included. It is also visually appealing and it also shows the percent of total for each category.
  • 8. Methodology Advantages of Bar Graph? Bar graph is an excellent way to show the results that are one time because it is not in a continuous form. From the graph shown below the data is in categories which you can easily read and understand. .
  • 9. n o . o f p a r tic ip a n ts 90 81 80 70 60 50 n o . o f p a r tic ip a n ts 40 30 26 20 10 0 M a le F e m a le
  • 10. N o . o f U n ib r id g e S t u d e n t s 100 90 93 80 70 60 50 40 N o . o f U n ib r id g e S t u d e n t s 30 20 10 14 0 o n e m o b ile p h o n e m o r e t h a n o n e m o b ile phone
  • 11. Figur e A : CURRENTLY (93 Number of Students own one mobile phone) P e r c e n t a g e o f U n ib r id g e S t u d e n t s 2% 1% 9% 1% 3% 25% N o k ia Sam su n g 5% iP h o n e S o n y E r ic s s o n M o t o r o la LG 17% PDA O th e rs N o H andphone 37%
  • 12. Figur e B: PREVIOUSLY (93 Number of Students own one mobile phone) P e r c e n t a g e o f U n ib r id g e S t u d e n t s 0% M y c u r r e n t h a n d p h o n e is m y f ir s t 5% 3% handphone 1% 7% N o k ia Sam su n g 12% iP h o n e S o n y E r ic s s o n 5% M o t o r o la 5% LG 62% PDA O th e rs
  • 13. FIGUR C: Co m p a ris o n o f m o bile p ho ne s ' bra nd s a m o ng E Unibrid g e s tud e nts (s ing le bra nd o wne r)
  • 14. FIGURE D P e r c e n ta g e o f M a le S tu d e n ts O w n in g a ty p e o f M o b ile B r a n d ( C U R R E N T LY ) N o H andphone 0% PDA LG 0% O th e r s 0% 10% N o k ia M o t o r o la 25% 5% S o n y E r ic s s o n 10% Sam su n g 10% iP h o n e 40%
  • 15. FIGURE D P e r c e n ta g e o f M a le S tu d e n ts O w n in g a ty p e o f M o b ile B r a n d ( C U R R E N T LY ) N o H andphone 0% PDA LG 0% O th e r s 0% 10% N o k ia M o t o r o la 25% 5% S o n y E r ic s s o n 10% Sam su n g 10% iP h o n e 40%
  • 16. FIGURE E P e r c e n ta g e o f F e m a le S tu d e n ts O w n in g a ty p e o f M o b ile B r a n d ( C U R R E N T LY ) N o Handphone 3% PDA 1% O th e r s 8% M o to r o la N o k ia 0% LG 25% 4% S o n y E r ic s s o n 4% iP h o n e 11% Sam su n g 44%
  • 17. Pie Chart (Unibridge student who used more than one handphone – PREVIOUSLY) Total number of students involved - 14
  • 18. Pie Chart (Unibridge student who using more than one handphone – CURRENTLY) Total number of students involved - 14
  • 19. THE RESULT In Fig 1 The pie chart shown in the PREVIOUS stastictics shows the percentage of Unibridge student who owned more than one handphone at the same time. The statistic shows the type of brand that were most likely to be used by these multibrand phone owner. From the result, we found out that 25% of the 14 participants own NOKIA. 25% own SAMSUNG. Another 25% owned SONY ERICSSON. The last 25% owned IPHONE. Total number of students involved: 14 students In Fig 2 The pie chart shown in the CURRENT stastictics shows the percentage of Unibridge student who used more than one hand phone at the same time. From the result, we have observed that 30% of the student use NOKIA and SAMSUNG. 13% of the 14 student used SONY ERICSSON. 7% used IPHONE and others. 3% used LG and none used PDA. Total number of students involved – 14 students
  • 20. R e a s o n s fo r c h o o s in g th e b r a n d 14 B e tte r fe a tu r e s 27 P r ic e c o m p e titiv e ly L o v e th e b ra n d 31 P e e r s a n d fa m ily u s e th is 9 bran d L a ste st m o d e l W a n te d fe a tu r e s 23 O th e r s 13 9
  • 21. F re q u e n c y a g a in s t p ric e 45 40 35 30 25 20 N U Q R C E Y F 15 10 5 0 B e lo w $ 5 0 0 $ 5 0 0 -$ 8 0 0 $ 8 0 0 -$ 1 2 0 0 A bove $1200 D o n o t tic k a n y F requ en cy 40 36 20 10 2
  • 22. A cc o rd in g to th e b a r g ra p h o n p rice d e s ire d s h o w n :  T h e re a re 4 0 p e o p le , b o th m a le a n d fe m a le , p re fe rre d $ 5 0 0 b e lo w a s fo r th e m o s t a p p a re n t re a s o n is d u e to c h e a p e r p ric e .  3 6 re s p o n d e n ts , b o th m a le a n d fe m a le , c o n s id e rin g th e p ric e is in b e tw e e n $ 5 0 0 - $ 8 0 0 d u e to th e p ro g ra m s a v a ila b le in th e ir p h o n e s .  2 0 o f th e m c h o se a t ra n g e $ 8 0 0 to $ 1 2 0 0 . T h is m a y e ith e r d u e to tre n d in g a m o n g fa m ily a n d frie n d s o r b e c a u s e th e p ro g ra m s a v a ila b le in th a t m o d e l o f p h o n e .  1 0 p e o p le in U n ib rid g e tic k e d a b o v e $ 1 2 0 0 . T h e y a re d e fin ite ly o n tre n d w ith fa m ily , frie n d s a n d e v e ry o n e . U s u a lly th e p h o n e s a re Ip h o n e -A p p le .  2 o f th e m m is se d to tic k th is p a rtic u la r q u e s tio n .
  • 23.
  • 24.
  • 25.
  • 26.
  • 27.
  • 28.
  • 29.
  • 30.
  • 31. conclusion In the past Nokia is the most trending brands among the Unibridge’s students both in male and female. Currently i-Phone is the most wanted brand for male, while Samsung becomes the first choice of brand for female. Mostly the mobile phones own by the students have a price range below B$500. Some students own more than one mobile phone. Majority multibrand owners use Nokia/Samsung as their alternate handheld mobile phone. Generally the factor that affect students to buy certain brands is the amazing features inside the mobile phones.