SlideShare a Scribd company logo
1 of 1
Historical USD Bookings Trend – Asia Pacific Region
See Dionex Annual Report Information for further details
-
20
40
60
80
100
120
140
FY99 FY00 FY01 FY02 FY03 FY04 FY05 FY06 FY07 FY08 FY09 FY10 FY11
7 9
12 14
20
30
39
47
52
73
84
103
123
49 51
MillionsUSD$
AP Ex Japan Japan

More Related Content

Viewers also liked

China Historical Bookings Trend 15-09-18h
China Historical Bookings Trend 15-09-18hChina Historical Bookings Trend 15-09-18h
China Historical Bookings Trend 15-09-18hShawn Heberling
 
United States Patent Award
United States Patent AwardUnited States Patent Award
United States Patent AwardShawn Heberling
 
Logo Analytical Biotechnology Co., Ltd. v1
Logo Analytical Biotechnology Co., Ltd. v1Logo Analytical Biotechnology Co., Ltd. v1
Logo Analytical Biotechnology Co., Ltd. v1Shawn Heberling
 
Japan Leadership Team 15-08-27a
Japan Leadership Team 15-08-27aJapan Leadership Team 15-08-27a
Japan Leadership Team 15-08-27aShawn Heberling
 

Viewers also liked (8)

China Historical Bookings Trend 15-09-18h
China Historical Bookings Trend 15-09-18hChina Historical Bookings Trend 15-09-18h
China Historical Bookings Trend 15-09-18h
 
United States Patent Award
United States Patent AwardUnited States Patent Award
United States Patent Award
 
Microcontamination Ad
Microcontamination AdMicrocontamination Ad
Microcontamination Ad
 
R&D 100 Award
R&D 100 AwardR&D 100 Award
R&D 100 Award
 
Logo Analytical Biotechnology Co., Ltd. v1
Logo Analytical Biotechnology Co., Ltd. v1Logo Analytical Biotechnology Co., Ltd. v1
Logo Analytical Biotechnology Co., Ltd. v1
 
DNAPac PA100 Column
DNAPac PA100 ColumnDNAPac PA100 Column
DNAPac PA100 Column
 
China Organization 2011
China Organization 2011China Organization 2011
China Organization 2011
 
Japan Leadership Team 15-08-27a
Japan Leadership Team 15-08-27aJapan Leadership Team 15-08-27a
Japan Leadership Team 15-08-27a
 

AP Historical Bookings Trend inc Japan 15-09-18h

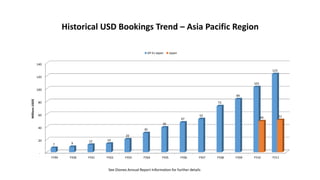
  • 1. Historical USD Bookings Trend – Asia Pacific Region See Dionex Annual Report Information for further details - 20 40 60 80 100 120 140 FY99 FY00 FY01 FY02 FY03 FY04 FY05 FY06 FY07 FY08 FY09 FY10 FY11 7 9 12 14 20 30 39 47 52 73 84 103 123 49 51 MillionsUSD$ AP Ex Japan Japan