Noise Control Stratagies in Reinforced Concrete Buildings
20129-22318-1-PB
1. Journal of Environment and Earth Science www.iiste.org
ISSN 2224-3216 (Paper) ISSN 2225-0948 (Online)
Vol.5, No.4, 2015
108
Noise Mapping of the Campus of the College of Engineering /The
University of Al-Mustansiriyah
Dr. Shatha AJ. Ibrahim
Department of Environmental Engineering, College of Engineering, The University of Al-Mustansiriyah
E-mail:eng.shathaaj@uomustansiriyah.edu.iq
Abstract
Noise mapping gives factual information on outdoor noise level propagation by describing real situations. This
approach helps to assess the noise levels to which people are exposed and monitor the impact of noise. This
paper focuses on campus noise mapping, where there are various noise sources such as electrical diesel
generators, parking lots, industrial buildings, road traffic and students gathering in small gardens and squares,
which generate high noise levels with adverse effects on students’ concentration, communications, mental
activities, and learning ability, causing annoyance and hearing impairments. Noise maps drawn by the
SoundPlan software involve determining and inserting all noise source requirements followed by comparison
with real measurements by using a SVAN957 Type 1 sound and vibration meter with analyzer. Based on two
noise mappings, one with generators turned off and another with generators turned on, the dominant noise levels
on the campus exceed the permissible limit of 55 dB(A) by WHO. The danger is located in and around areas in
which students gather (small gardens and squares) where they take breaks near the generators and other noise
sources without awareness of the noise levels to which they are exposed.
Keywords: equivalent continuous A-weighted sound pressure level, noise mapping, noise sources, SoundPlan
software.
1. Introduction
Since the 1970s, organizations and agencies, such as the World Health Organization (WHO), National Institute
for Occupational Safety and Health (NIOSH), and Occupational Safety and Health Administration (OSHA),
have comprehended the dangers of noise on individuals themselves and their life, noted the adverse effects of
noise (for example, annoyance, affects the learning and memory of students, sleep disturbance, physiological
stress reactions and cardiovascular diseases, in addition to acoustic trauma, tinnitus, and temporary and
permanent hearing loss) and raised the alarm regarding noise pollution (NIOSH,1998; Birglund et al, 1999;
OSHA). According to WHO, noise can be observed everywhere, indoors and outdoors, from road traffic,
railways, aircraft, industries, construction and public work; accordingly, countries have been encouraged to
assess and determine noise pollution in their territories by drawing noise maps (NIOSH,1998; Birglund et al,
1999; OSHA; Stansfeld &Matheson,2003; CCOHS,2011; Hellmuth et al, 2012).
In general, noise pollution research indicates the adverse effects of noise on activities such as
communication and concentration, particularly, in educational institutions (schools, educational laboratories,
colleges and universities); the campus is a place where many noise sources can be found, such as noise generated
by leisure activities as well as noise emissions from laboratories, electrical generators, nearby road, rail and air
traffic, and industry sites. Some of the researchers studying noise levels on different campuses have found the
main noise sources to be road traffic. For example, Balila and Siddiqi (1999) found the noise levels in the
campus of Faculty of Engineering, KSA, to be higher than the preferred noise criteria curves (PNC 55) due to the
main roads around the campus.
On the campus of Guhati University, India, the traffic noise generated from the national highway that
passes through it was mostly responsible for noise nuisances. The noise levels measured in the morning, midday
and evening are found to be between 10 to 11.2 dB(A) above the prescribed noise limits for the silence area
category for which given by Central Pollution Control Board (Phukan & Kalita,2013).
Traffic noise was also the main noise source on the campus of Atatürk University, Turkey. At the
entrance of the campus, the rates of flow were 971 vehicle/hr, so the noise levels measured at various locations
were above the permitted value of 55 dB(A) according to the Turkish Environmental Determinants ( Ozer et
al,2014). This noise source was also found on the Campus of the University of Dammam, KSA, where the
researcher concluded that the noise levels generated from the traffic flow inside the campus exceeded the WHO
guidelines, 55 dB(A) (Al-Sharkawy&Alsubaie, 2014).
Other researchers, such as Olaosun and Ogundiran (2014), found different noise sources on the
campus, such as electrical generators, pumps, vehicles horns, welding and lathe machines at the general
workshop and ambient noise from bus stops. They measured the noise levels on the campus (at noisy outdoor
locations near the main noise sources) of the University of Ibadan, Nigeria, and they found that noise levels
exceeded 85 dB in most of these locations, especially near the electrical generator, where the highest levels
reached 112 dB.
2. Journal of Environment and Earth Science www.iiste.org
ISSN 2224-3216 (Paper) ISSN 2225-0948 (Online)
Vol.5, No.4, 2015
109
Noise mapping is the best way to determine how outdoor noise levels differ with location (Peters et al,
2011). Noise mapping depends basically on the determination and description of the area under study, including
noise sources (road, rail, and air traffic, industrial and construction activities), the number of people exposed
(receivers), topography, and meteorological conditions, measuring the equivalent continuous A-weighted sound
pressure level and sound power level in dB(A) (ISO-2,1996; DIN45682,2002; WG-AEN,2007). Noise mapping
addresses large agglomeration areas such as countries, cities, and industrial plants. For this research, the goal is
to draw a noise map for a small agglomeration area (college campus) where the number of people (staff and
students) is approximately three thousand, by determining the noise sources and measuring and estimating the
outdoor noise levels, to find the noise levels to which people are exposed during the working day. In addition,
through noise mapping, the worst noise sources on the campus can be identified.
2. Description of College Site
The site of the college is bounded to the north by existing miscellaneous (residential, commercial and industrial)
properties, to the southeast by a side street with bookshops and hawkers, and to the west by the Bab Al-Moatham
main road, the Physical Education College and the College of Nursing. The total area is approximately 46700
m2
. Fig. 1 shows a satellite image of the college site.
Figure. 1 Satellite image of the College of Engineering site in Bab Al-Moatham district-Baghdad
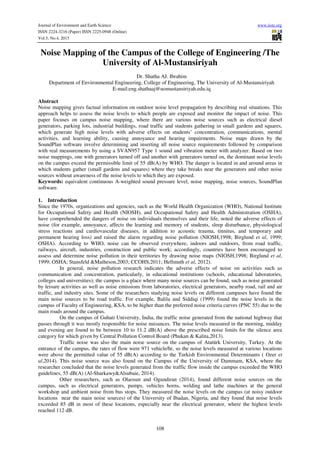
3. Noise Sources
Various noise sources were found on the campus. The main source is five 500 kVA electrical diesel generators,
which operate when the main electric power of the district is shut down. There is no specific time schedule for
generator operation because it depends on the hours of shutdown.
The second source is the parking lot for the visitors and staff, representing 4% of the total college area, with a
capacity of 100 vehicles.
The third source is the workshop and structure labs, which contain machines and instruments that generate a
noisy environment affecting the students and staff who spend time in and around it.
The Bab Al-Moatham main road represents the fourth noise source, bounding the back of the college for 42 m.
This road is two way with a lane width of 7.5m and a central reservation width of 2 m, and the traffic flow is
described as a pulsed continuous flow (EEA,2003).
The fifth source is the sound generated by the students (speaking, laughing, eating, taking pictures and walking)
Physical Education College and
College of Nursing
Bab Al-Moatham road
Miscellaneous properties
College of Engineering
3. Journal of Environment and Earth Science www.iiste.org
ISSN 2224-3216 (Paper) ISSN 2225-0948 (Online)
Vol.5, No.4, 2015
110
when they gather in small gardens and squares. The number of students ranges from ten to a few tens per site.
Fig. 2 shows the distribution of the electrical generators (represented by black rectangles), the parking lot, Bab
Al-Moatham road and student gatherings in green spaces (small gardens and squares).
Figure. 2 Noise sources in the campus of the College of Engineering
4. Measurement Methodology
Noise mapping can be performed based on real measurements and/or on relevant data (such as the number of
floors in each building in the campus for computing reflections, or the flow rate of vehicles, vehicle speed, and
road width for traffic noise) and the assumptions built into the software. Therefore, to obtain the best information
and compare the real measurements with assumptions, in this research, two methods were used. On the campus
map, noise levels were determined at measurement positions as shown in Fig.3. The measurement points were
taken in and around the outdoor noise sources, at least 1 m from the façade and 1.5 above the ground. ([ISO-1,2 ,
1996). All measurements were taken during working hours from 8:00 am to 2:30 pm, when the generators were
turned on and when they were turned off. The noise measurements were based on the equivalent continuous A-
weighted sound pressure level in decibels, measured for 5 minutes in each position. The instrument used for
measurement was a SVAN957 Type 1 sound and vibration meter with analyzer.
4. Journal of Environment and Earth Science www.iiste.org
ISSN 2224-3216 (Paper) ISSN 2225-0948 (Online)
Vol.5, No.4, 2015
111
Figure. 3 Measurements points (small red circles) in the campus of the College of Engineering
The SoundPlan Acoustics software was used to draw noise maps of the campus of College of Engineering based
on the input of real data, assumptions and readings in the standards (RLS-90, DIN ISO9613-2) (Braunstein
&Berndt, 2012). Fig. 4 shows the interface of the SoundPlan software.
Figure. 4 The interface of SoundPlan software
To compute the sound pressure level in the noise mapping, the basic acoustic formulas are as follows:
(1)
where LAeq,T is the equivalent continuous A-weighted sound pressure level, in dB, determined over a time
interval T starting at t1 and ending at t2; po is the reference sound pressure (20 µPa); and pA(t) is the
5. Journal of Environment and Earth Science www.iiste.org
ISSN 2224-3216 (Paper) ISSN 2225-0948 (Online)
Vol.5, No.4, 2015
112
instantaneous weighted sound pressure of the sound signal.
(2)
where Lp is the sound pressure level in dB(A), Lw is the sound power level of the source in dB(A), and
r is the distance of noise propagation from a point source over a flat terrain. The sound power level can be
entered directly or indirectly by using the software library.
According to the SoundPlan software, all the parameters in the map should be defined and described.
The buildings are classified as main and industrial buildings. The main buildings include all the buildings on the
campus except two laboratories (workshop and structure) that are treated as industrial buildings because of the
high noise levels generated in and around them: the noise levels inside the labs reach 105 dB(A) (Ibrahim, 2014),
and thus, high noise levels were observed outside the labs when the machines were on and the doors were open.
All building descriptions were input including height and number of floors, ranging from 3.3 m with one floor to
12.2 m with three floors.
The generators, gardens and squares represent area sources, and the input data depend on the area
dimensions and the description of the source plus the sound power level. The power of the diesel generators is
500 kVA. From the software library, the choice of diesel generators with a sound power level of 111 dB(A)/m2
corresponds to the real measurements. According to the software library, the sound power level for a human
voice level (loud) is 83 dB(A)/m2
, which is similar to the noise generated by students gathering in the gardens
and squares (European Commission DG Environment, 2003).
The input data for parking lots include parking type, capacity (number of vehicles), and surface type.
The parking lot is designated for staff and visitors with a capacity of 100 vehicles and a road surface covered by
asphalt.
To compute the traffic noise generated from the Bab Al-Moatham main road (two ways), the lane
width, vehicle flow rate, vehicle speed and type of vehicles are input. The width of each lane is 7.5 m, and the
central reservation width is 2 m. The flow rate measurements were taken according to traffic engineering
requirements (Roess et al, 2004). The hourly average flow rate was 2274 vehicle/hr, 95% of which represents
light vehicles (motor cars, motor cycles, vans and minibuses) with weights less than 3500 kg, while the
remaining percentage represents heavy vehicles (such as trucks) with weights more than 3500 kg. During the
working days, the maximum speed of light vehicles is 55km/hr, 50 km/hr for heavy vehicles.
5. Results and Discussion
To obtain the best information about the noise source effects on the noise mapping of campus of the College of
Engineering, two noise maps were drawn. The first was drawn with the generators off, as shown in Fig.5. The
second noise map, supposes that all generators are on at the same time, as shown in Fig. 6.
When comparing the two noise maps, the following observations were made:
The number of noise zones changed: the first map distinguishes nine noise zones, starting from a noise level less
than or equal to 50 dB(A) and ending with a noise level less than 90 dB(A). The second includes ten noise zones,
starting from a noise level less than or equal to 50 dB(A) and ending with a noise level greater than 90 dB(A),
clearly apparent around the generators.
The areas of noise zones remain steady in and around the parking lot but with small changes in noise levels of 5
dB(A) around the industrial buildings and Bab Al-Moatham road, and the noise levels generated from these
sources affect the neighboring main buildings.
The student gathering areas are affected by the generators: the noise levels rose from 55 dB(A) to more than 90
dB(A), especially in the area beside the generators. In areas distant from the generators, the noise levels rose
from 55 dB(A) to 70 dB(A).
6. Journal of Environment and Earth Science www.iiste.org
ISSN 2224-3216 (Paper) ISSN 2225-0948 (Online)
Vol.5, No.4, 2015
113
Signs and Symbols
Line
Road axis
Emission line
Central reserv ation
Wall
Parking lot
Area source
Main building
Industrial building
Noise calculation area
Noise Level Leq
in dB(A)
<= 50
50 - 55
55 - 60
60 - 65
65 - 70
70 - 75
75 - 80
80 - 85
85 - 90
> 90
Figure. 5 Noise mapping of the campus of the College of Engineering (generators off)
Signs and Symbols
Line
Road axis
Emission line
Surf ace
Central reservation
Wall
Parking lot
Area source
Main building
Industrial building
Noise calculation area
Noise Level Leq
in dB(A)
<= 50
50 - 55
55 - 60
60 - 65
65 - 70
70 - 75
75 - 80
80 - 85
85 - 90
> 90
Figure. 6 Noise mapping of the campus of the College of Engineering (generators on)
7. Journal of Environment and Earth Science www.iiste.org
ISSN 2224-3216 (Paper) ISSN 2225-0948 (Online)
Vol.5, No.4, 2015
114
Analysis results according to the noise sources:
a. Electrical Generators
Although all generators are equipped with sound attenuated enclosures, these enclosures are not
appropriate for the generators to operate for long periods of time in the Baghdad meteorological
conditions; therefore, the doors of the enclosures are opened during working hours to prevent the
generators from shutting down due to high temperature inside the enclosures.
Thus, high noise levels greater than 90 dB(A) were recorded, which decreased with distance to 80
dB(A). The noise levels generated by the five electrical diesel generators are clearly shown in Fig. 6.
These generators have both direct and indirect negative effects. The direct effects are exerted on the
students because near these generators, the students gather in small squares and gardens to take breaks
(drinking, eating, walking, and talking) during their schedule; thus, they are exposed to high noise doses
for extended times depending on the working hours for the generators. The indirect effects take the
form of high background noise inside the buildings near these generators, such as laboratories, the
Environmental Eng. Department and the library, especially in the spring and summer seasons when the
windows are open.
b. Parking Lots
The noise level in parking lots range from 85 to 90 dB(A), and decrease to range from 75 to 80 dB(A).
This noise level reaches to the side façade of the Computer & Software Engineering Department.
Figures 5 and 6 reveal that the noise levels around the parking lot are unaffected by the generator noise
level because the lot is far away from the generators.
c. Industrial Buildings
The noise levels around the industrial buildings (workshop and structure labs) reach 90 dB (A). Those
labs contain machines such as cutting, milling, and grinding machines for the workshop lab, an electric
sieve, a crane, a concrete compressive strength testing machine and a concrete mixer in the structure
lab, and the noise level generated from these machines reaches 105dB(A) inside the buildings
(Ibrahim.2014). During the working day, the doors always open, and there are no sound insulators in
these labs. Therefore, the effects of the noise levels reach to the nearby main buildings and gathering
students.
d. Bab Al-Moatham Road
The Bab Al-Moatham district is described as crowded. It includes government departments, colleges,
schools, shops, carpentry workshops and residential neighborhoods. Thus, this road is considered the
main road for the Bab Al-Moatham district. In fact, there has been a bridge under construction, for three
years as of the preparation of this study, at the south end of the road, and these construction works limit
the speed of vehicles to 55 km/hr.
From Fig. 5, the road noise level does not exceed 70 to 75 dB(A), and it interacts with the same noise
levels generated from the industrial buildings (structure lab). The noise area for this level became
smaller when the generators turned on, and the area of the noise level of 75 to 80 dB(A) is dominant, as
shown in Fig. 6
e. Students gathering in Gardens and Small Squares
The noise levels in and around areas where students gather ranged from 55 to 60 dB(A) where these
areas are distant from other noise sources, but these levels increased to 75 dB(A) for the areas near the
parking lots, industrial buildings and the Bab Al-Moatham road with the generators turned off, as
shown in Fig. 5. When the generators are turned on, the noise levels near them reach up to 90 dB(A),
and noise levels range from 60 to 75 dB(A) in areas far away from the generators, as shown in Fig. 6.
Therefore, the noise levels generated from the gathering students interact with other sources.
From all of the above, the noise levels exceed the permissible noise limits outdoors 55 dB(A) according
to WHO guidelines (Birglund et al, 1999). The main noise source with the most adverse effects is the
electrical diesel generators, affecting the students gathering outdoors and students and staff inside
buildings constructed without sound insulation material, followed by noise generated from industrial
buildings (workshop and structure labs). The next sources are the parking lots and Bab Al-Moatham
road. The dominant noise levels in this situation range from 75 to greater than 90 dB(A) close to the
generators.
The real measurements were identical to the readings of the SoundPlan software, and the above two
noise mappings represent the true situation of noise level propagation outdoors.
6. Conclusions
Based on noise mapping, noise levels greater than 90 dB(A) are clearly shown when the generators are turned
on, and the lowest levels overlap with noise levels generated by the industry buildings, Bab Al-Moatham road
and parking lots. When the generators are turned off, the noise levels greater than 80 dB(A) occur around the
8. Journal of Environment and Earth Science www.iiste.org
ISSN 2224-3216 (Paper) ISSN 2225-0948 (Online)
Vol.5, No.4, 2015
115
industrial buildings and parking lots, while the dominant noise levels ranging from 55 dB(A) to 80 dB(A) are
observed in and around student gathering areas. Unfortunately, most of the gathering students are close to noise
sources when they take breaks during their schedule and are thus exposed to high noise levels with adverse
effects on hearing, concentration and learning without knowing or caring.
To reduce the dominant noise levels to the permissible limits (55 dB(A) or below), there are some
recommendations: the location of the electrical diesel generators should be changed if there is free space
available, or they should be provided with sound attenuated enclosures appropriate to the operating conditions; a
wall should be built parallel to the boundary of the parking lots, and the machines that generate high noise levels
should be replaced with quieter ones.
References
Balila,Y.,A., & Siddiqi,A.,A.,(1999), “ Critical Evaluation of the Noise Environment with Respect to Academic
Activities: A Case Study of some Buildings in the Faculty of Engineering at King Abdulaziz University”,
Journal of King Abdulaziz University : Engineering Sciences,2,1, 193-210
Birglund, B., Lindvall,T., & Schwela, D.H., (1999), “ Guidelines for Community Noise”, WHO Publications.
Braunstein , Berndt Gmbh, (2012), “SoundPlan User’s Manual”, SoundPlan International LLC.
Canadian Centre for Occupational Health and Safety (CCOHS), (2011),"Noise-Auditory Effects".
DIN45682:2002-09 ,(2002) , “Schallimmissionspläne”.
El-Sharkawy, M.,F., & Alsubaie,A.,S., (2014), “ Study of Environmental Noise Pollution in the University of
Dammam Campus”, Saudi Journal of Medicine &Medical Sciences,2, 3, 178-184
European Commission Working Group Assessment of Exposure to Noise (WG-AEN), (2007), “ Good Practice
Guide for Strategic Noise Mapping and the Production of Associated Data on Noise Exposure”, Version 2.
European Commission DG Environment,2003, “ Adaptation and Revision of the Interim Noise Computation
Methods for the Purpose of Strategic Noise Mapping- Final Report , Part A”, Project team: Wölfel Meßsysteme .
Software Gmbh&Co, AIB-Vinçotte EcoSafer, AKRON n.v.-s.a., LABEIN Technological Centre S.L., Honorar-
Professor Dipl.-Ing.Dr.techn. Judith LANG, LÄRMKONTOR GmbH, Proscon Environmental Ltd.
European Environmental Agency (EEA),(2003), “ Commission Recommendation of 6 August 2003 Concerning
the Guidelines on the Revised Interim Computation Methods for Industrial Noise, Aircraft Noise, Road Traffic
Noise, and Railway Noise, and Related Emission Data”, Official Journal of the European Union.
Hellmuth, T., Classen, T., Kim, R.,& Kephalopoulos,S.,(2012), “ Methodological Guidance for Estimating the
Burden of Disease From Environmental Noise”, WHO Publications.
Ibrahim, SH.,AJ.,(2014), “ Determining Noise Zones in the Laboratories of the College of Engineering at the
University of Al-Mustansiriyah”, International Journal of Emerging Science and Engineering, 2, 9, 1-6
ISO 1996-1 (1996), “Acoustics-Description and Measurement of Environmental Noise, Part 1: Basic Quantities
and Procedures”.
ISO 1996-2 (1996), “Acoustics-Description and Measurement of Environmental Noise, Part 2: Acquisition of
Data Pertinent to Land Use”.
National Institute for Occupational Safety and Health (NIOSH), (1998), “Criteria for a Recommended Standard,
Occupational Noise Exposure”, NIOSH Publication No.98-126
Olaosun,A.O. & Ogundiran, O., (2014), “ Noise Levels in a Nigerian Tertiary Institution” , International Journal
of Recent Scientific Research, 5, 4, 720-723.
Ozer,S., Zengin,M.& Yilmaz,H., (2014), “ Determination of the Noise Pollution on University (Education)
Campuses: a Case Study
of Ataturk University), Ekologi, 23, 90, 49-54.
Peters,R.J.,Smith,B.J.,&Hollins,M.,(2011), “ Acoustics and Noise Control”, 3rd
edition, Pearson Education
Limited.
Phukan,B.& Kalita,K.,2013, “An Experimental Study of Noise Pollution in Guwahati, Assam,India”,
International Journal of Environmental Sciences ,3, 5.
Roess, R.P.,Prasses,E.S. & McShane, W.R., (2004), “ Traffic Engineering”, 3rd
edition, Pearson Education
Limited.
Stansfeld,A.S.,Matheson,M.P, (2003) ,"Noise Pollution: Non-Auditory effects on health", British Medical
Bulletin,68, 243-257
US Occupational Health and Safety Administration (OSHA), 29 CFR1910.5
9. The IISTE is a pioneer in the Open-Access hosting service and academic event management.
The aim of the firm is Accelerating Global Knowledge Sharing.
More information about the firm can be found on the homepage:
http://www.iiste.org
CALL FOR JOURNAL PAPERS
There are more than 30 peer-reviewed academic journals hosted under the hosting platform.
Prospective authors of journals can find the submission instruction on the following
page: http://www.iiste.org/journals/ All the journals articles are available online to the
readers all over the world without financial, legal, or technical barriers other than those
inseparable from gaining access to the internet itself. Paper version of the journals is also
available upon request of readers and authors.
MORE RESOURCES
Book publication information: http://www.iiste.org/book/
Academic conference: http://www.iiste.org/conference/upcoming-conferences-call-for-paper/
IISTE Knowledge Sharing Partners
EBSCO, Index Copernicus, Ulrich's Periodicals Directory, JournalTOCS, PKP Open
Archives Harvester, Bielefeld Academic Search Engine, Elektronische Zeitschriftenbibliothek
EZB, Open J-Gate, OCLC WorldCat, Universe Digtial Library , NewJour, Google Scholar