Thirdeyeopentrades jul14 ac fr-ogamsu42l7ye55fvsx6hzpurkme6mjg9stl4wdm3wksqfrjhisrg3cqrzkmozevsfybx3_b-vahrw_3yfe43t0n-ar0d6sxeycf71oie_qp-creh6envubty4gc=
Barns rettsikkerhet og indre justis i Jehovas vitner
Similar to Thirdeyeopentrades jul14 ac fr-ogamsu42l7ye55fvsx6hzpurkme6mjg9stl4wdm3wksqfrjhisrg3cqrzkmozevsfybx3_b-vahrw_3yfe43t0n-ar0d6sxeycf71oie_qp-creh6envubty4gc=
Similar to Thirdeyeopentrades jul14 ac fr-ogamsu42l7ye55fvsx6hzpurkme6mjg9stl4wdm3wksqfrjhisrg3cqrzkmozevsfybx3_b-vahrw_3yfe43t0n-ar0d6sxeycf71oie_qp-creh6envubty4gc= (20)
Thirdeyeopentrades jul14 ac fr-ogamsu42l7ye55fvsx6hzpurkme6mjg9stl4wdm3wksqfrjhisrg3cqrzkmozevsfybx3_b-vahrw_3yfe43t0n-ar0d6sxeycf71oie_qp-creh6envubty4gc=
1. 1
Precious Metals & General Market Review
July 2014 – Issue #325.d
7-27-14
Thank you for subscribing to Thirdeyeopentrades! We present weekly trading ideas for swing traders with
charts and brief commentary designed to help save you the precious time it takes in researching good
ideas. We don’t claim to know where the stocks are going but simply speculate, based upon chart setups,
where they may be likely to go. You need to do your own fundamental and technical research for each idea
present and then execute based upon your own unique trading plan and style. Thirdeyeopentrades gets you
started…you do all the work and assume all the risk! Thirdeyeopentrades is not a licensed or registered
financial advisory service so we recommend you consult your personal advisor before executing any trade.
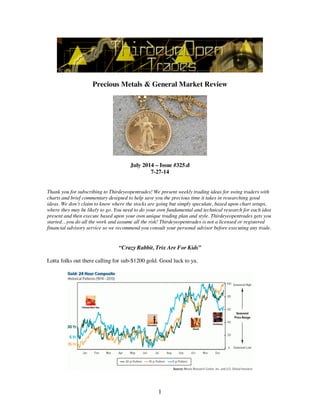
“Crazy Rabbit, Trix Are For Kids”
Lotta folks out there calling for sub-$1200 gold. Good luck to ya.
2. 2
Is that what people see when they say gold is going lower? Where’s it going lower? Show me,
please.
I see a symmetrical triangle consolidation working off some parabolic excitement where gold got
carried away from a solid rising trend line a number of years ago.
Back when I had much more hair. More blond and now gray. A better memory too.
I see a massive fifteen hundred dollar rise ahead. I see a massive strengthening of the MACD
histogram as it rises from the depths of despair. I see a historical oversold MACD ready to cross
upward in a massive bullish rise.
Differences in viewpoints are what drive markets.
Actually, I have never in my trading career seen a chart more bullish than that one you see above.
But I’m biased. If I were short, I would probably see things differently.
3. 3
The BPGDM signal remains on bull mode, albeit overbought. GDX is trading sideways. The
FOMC meeting is next Tuesday and Wednesday so they’ll probably shake the trees again and try
to crash the sector.
But if I focus on a monthly chart for gold, all the rest is reduced to noise. None of my buy orders
have filled for more SILJ and JNUG.
4. 4
There remains a chance that a head and shoulder top has formed on the daily chart going into the
FOMC meetings next week.
But that’s a two hour chart.
5. 5
Almost filled but no cigar. It doesn’t look as if JNUG wants to go lower. Missed the pullback by
eighteen cents.
I got greedy and bid too low.
7. 7
IDM Mining kept rocking. It did pull back some into $0.35 and closed the week out with an eight
percent gain, closing at $0.45 Canadian.
The PEA (preliminary economic assessment) was released last week. Rob McLeod thinks they’ll
find much more gold as they explore the area further.
Only die-hard 321gold.com readers even know about this one although there have been stories
elsewhere afterward. I’ll bet you can’t find anybody you know who trades gold stocks that has
heard of this idea yet.
Anyone here remember Wheaton River Mining?
8. 8
GDX has yet to issue a sell signal based on this 5-21 EMA crossover model. It may fall next
week into the pullback zone…but then again it may not. Relative strength has refused to cross
below the 50 line.
9. 9
GDXJ found support and resoundingly bounced up off the 200 day exponential moving average.
Friday’s up volume was sweet.
Hopefully you won’t mind me raising the projected price target like that. Naturally, a stop could
be placed just under the 200EMA for comfort if one needs comfort.
THERE’S NO SUCH THING AS COMFORT IN GOLD STOCKS.
It does look pretty bullish though, doesn’t it?
The danger is a head and shoulder top with the 200 EMA acting as a neckline. That’s the same
in many precious metals sector charts this weekend so caution remains warranted.
Don’t come back crying if this sector sells off next week. If it was easy, everyone would be doing
it.
10. 10
I need to see GDXJ clear that moving average resistance and resoundingly hold above it. There’s
more work to do.
The stochastic is overbought and rolling over. This may take more time than I would like.
11. 11
The dollar is a problem as it doesn’t want to break down. Gold can’t break higher in the face of a
stronger dollar here, in my opinion.
Gold has pretty much been acting the inverse of the dollar for quite a while.
13. 13
My arrows are straight so I’ve no idea why they aren’t on the chart post-annotate. If this is an
inverse head and shoulder bottom then we’re at the May 2013 pullback now from a mirror image
perspective of left side of head versus right.
Perhaps one more month before the sector breaks out?
14. 14
The commercial shorts won’t let up. They remain positioned for a VISCOUS sector sell-off. Stop
hitting me with that flower (harkens back my college daze)…
https://www.youtube.com/watch?v=EIdc0NGumVc
15. 15
Hey hey, what do you know? Adam Hamilton updated his Gold Bull Seasonals chart! Check out
the mid to late July average pullback. Looks like what we have now.
16. 16
There’s a problem in gold that makes technical analysis quite difficult these days. You see, gold
broke down thru the 200 week exponential moving average and has, so far, been able to reclaim
its throne.
So, I can see from this perspective what fuels the bearish argument that lower prices for gold are
coming.
Gold’s weekly stochastic is declining from an overbought zone. Relative strength has improved,
but it hasn’t convincingly taken on a bull market character.
This chart kicks up concern and is why I need to see gold trading above $1375 for at least a few
weeks. Maybe that’s coming within a month or so. But it did not succeed last year into the
autumn in rising above the 200 week EMA.
The 200 week EMA is key for gold. And nobody else, that I am aware of, is talking about it.
17. 17
The bears talking of sub-$1200 prices are probably using a linear chart setting. A linear setting
projects support for gold at $1140.
I’m sticking with logarithmic support across $1210 as support until such a time that I could be
proved wrong.
So, if $1210 were to fail a takedown, then my next support number would have to be $1140 (or
higher as time marches onward and the support line price is higher).
18. 18
Sometimes patience is rewarded. Perhaps I should throw in those low bids again. Morris Hubbartt
is looking at the 40 week simple moving average and uses a logarithmic setting for GDX.
So, I’ll do the same here. He is suggesting that the 40 week MA turning higher is a powerful
indication that the gold stocks have returned to a new bull market.
I think they have too and it’s always a pleasure to see technical confirmations begin to come in.
This would be one.
HOWEVER, rising support comes in at $23.00 and that’s a long way down off Friday’s close.
The 40 week MA support comes in at $24.00, so that’s not quite as bad.
The stochastic indicator is overbought and curling downward. Nice progress off the 2013 bottom,
nevertheless, a large consolidation continues.
Here’s Morris’ latest video essay:
http://www.321gold.com/editorials/sfs/hubbartt072514.html
I don’t agree with all of Jim Willie’s points of view, but this essay is one of his best, in my
opinion. It is a MUST READ if you haven’t already – markets, Fed and gold:
http://www.gold-eagle.com/article/derivatives-abuse-props-risks
19. 19
One’s gotta have some fun once in a while. You never really know what prices are going to do,
but I recognize repeating patterns easily and see an inverse head and shoulder playing out inside a
giant symmetrical triangle consolidation pattern in gold’s daily chart.
The ADX indicator is back on a sell signal. It whipsaws like crazy. The 325 day exponential
moving average (65 week = 325/5) is certainly resistance like the 200. They’re marching hand in
hand holding gold under the $1340-1375 zone.
20. 20
July 25, 2014 12:20pm
The bears are probably watching the weekly chart. Although gold has made some progress off the
December 2013 low, it hasn’t been much at all. Significant resistance across both the 65 and 200
week EMA’s are impeding gold’s advance. From this perspective, gold’s outlook is depressing
for the bulls. Until gold crosses up thru its 65 week EMA, I’m afraid gold’s outlook remains
rather gloomy. This is undoubtedly the worst chart I have on gold. It looks simply horrid. Funny
how charts can be interpreted so differently depending upon perspective. Just plain butt ugly.
21. 21
The Euro broke down thru support last week. Since the dollar generally does the inverse, that
strengthens the dollar. A stronger dollar pressures gold.
22. 22
Silver put in a tweezer harami candlestick on Friday. Volume shrank on the rebound, not good.
I’ve no idea if silver is going lower.
What do you think?
Well, if the Euro continues to decline and the US Dollar strengthen, then I would guess that could
pressure silver some more as well.
23. 23
Silver did touch the LodeZone. Is it going to pull off a five wave down? That’s only three waves
down so far.
I’m waiting for lower prices to add. Maybe that’s a mistake. I’ll bet they shove it down some
more into FOMC next week.
Silver Comex options expiration is Monday so if they whack the crocodile-spit-begeebers out of
silver, I’ll back up the truck a little into the loading dock, I suppose.
24. 24
Silvercorp may have found a bull market support pivot low last Thursday. The YellenGap filled.
Could be good for a trade, stop under the triangle support line, naturally.
25. 25
Flip flopping like a flounder out of water, there’s THIS chart. A Bollinger band squeeze similar to
the one from 2007 has set up.
Chaikin money flow is back in the green. That’s good news.
Back in 2007 the consolidation fit the time period and price busted upward and onward right out
of the gate the first week of September.
That’s what may be setting up here, I think. All gold needs to accomplish is to hold the Bollinger
Squeeze as support and BUST UPWARD thru the 65 and 200 week exponential moving
averages.
Some charts suggest that won’t happen and other charts suggest it will. Both points of view have
been offered up this weekend for you to decide and/or watch for the outcome.
26. 26
I bought BTG on the pullback. It pulled back further than I thought it might. She’s gunning for
$3.30.
28. 28
The markets started to experience some rollover last week. This situation needs to be monitored
closely as the Fed reduces the grease to the wheels.
I’m watching moving average support levels.
32. 32
GE says the markets will pull back once they figure it out.
33. 33
This chart suggests gold stocks have a long way to run over the next few to several years. Don’t
know if they’ll ever reach “break even” over 220, but from down here the gains should be alright.
43. 43
REMX is moving higher off support. Strategic Metals are having a tough go at it as the political
atmosphere has remained unsupportive of the sector in the USA.
It’s too bad. I would much rather see mining inside the USA where responsible practices would
be encouraged or regulated instead of the jobs going to China and we know they’re crapping all
over the planet getting the stuff out of the ground for the folks over here who own Prius’ and
Tesla’s.
Funny how those same folks are against starting up rare earth mines in the USA. The logic
boggles the mind, really. Maybe they don’t have a clue about the roles lithium, graphite and
neodymium play in their eco-friendly electronic and battery driven world.
Anyway, t’is the season for a rare earths sector bounce and bounce she’s doing. Let’s see how far
it gets.
44. 44
The Nasdaq could work its way back into the 200 day EMA sometime between now and
September/October.
45. 45
Newmont Mining might be carving out a head and shoulder top for a potential YellenGap fill. A
lot of mining charts look like this one.
47. 47
There’s more resistance ahead, but the relative strength indicator has broken thru resistance on
the weekly chart. The Euro has broken support and the dollar has busted up thru resistance, as
was discussed earlier.
48. 48
QQQ could easily test its moving average support sometime between now and
September/October.
49. 49
This model remains on a bull signal despite an overall waning MACD. On previous SPX
pullbacks into the 150 day exponential moving average, the S&P 1500 new highs new lows
indicator remained bullish (black line above pink line).
Should the black line cross down thru the pink line at some future time, I would consider that a
new cyclical bear market signal.
So far, so good. Bull market intact. It wouldn’t surprise me to see the SPX test 1900 sometime
between now and September/October.
50. 50
The bull market keeps charging higher. This is simply a moving average chart. Whipsaws can
occur but essentially the buy signal is a 13 over 34 week exponential moving average with the
MACD crossing above zero.
A bear signal is the inverse.
51. 51
Last week left an evening star reversal candlestick pattern behind. There seems to be a couple
channels in play so my guess is that at least a pullback to the 65 day EMA or even a deeper one to
the 150 day EMA may be on deck between now and September/October.
52. 52
I don’t see any reason to be swinging for the fences if SPX breaks down thru 1875. But I think
SPX will hold any pullback into 1900.
Jim Willie’s article (you did stop and read that on page 18?) suggests there’s a whole lot more
going on behind the scenes than what the FOMC is letting on to.
53. 53
This model suggests that 1875 might be too tight a stop. Leaving that up to you.
I met with a Vice President of one of the world’s largest fund families this week and he thinks
we’re witnessing another bull market like the one from the early 1980’s.
He admitted that there would be corrections of 5-20%, but he thinks this one will last a lot longer
than folks think. He has been in the business for over 40 years so he has seen a lot.
He was very bullish on the USA and sees manufacturing returning. It was refreshing to listen to
him. He spoke so fast I could barely keep up taking it all in.
I got the sense retirement was a foreign word to him.
54. 54
Back to GLD. My, what a sloppy chart! Smoked it down to $114, then shot a cruise missile up
into resistance at $133. Then they slammed her back down, but that time she only fell into $119.
Then she shot up one more time from a higher foundation but got slapped back down at $129.
The bullion bank commercial shorts are pounding gold, taking free money from the Fed and
naked shorting GLD to no tomorrow. Nothing to see here, folks. Keep moving.
So GLD chucks a middle finger to the sky and stops falling last week at $124 (got that pullback
number guess right!), leaving behind an island bottom.
Now she’s trying to right shoulder her way up thru resistance as she turns back upward once
again…and from another higher pivot.
It’s WAR as gold tries to break above long term moving average bull market supports. It’s a steep
climb, bloody and painful.
55. 55
There has been a behavioral change in GLD that Frank Holmes brought up in a recent interview
on Kitco.
During 2011-2013, selloffs saw GLD loose ounces. This time, GLD is gaining ounces on
pullbacks. That’s bullish.
There’s more consolidating to do, it seems.
56. 56
Technology stocks continue to fly. This ETF has been following the 100 day exponential moving
average and I could see it pulling back into it sometime between now and September/October.
58. 58
Semiconductors are pulling back. Let’s see if they hold the 100 day EMA.
That’s it. Have a great FOMC Meeting week! So, from Central Control, over and out.
Thirdeyeopentrades wishes you Health, Wealth, Wisdom and Happiness!
Thirdeyeopentrades is not a registered financial advisory service and is not a broker dealer. We do not and cannot give
individualized market advice. The information in the newsletter is only intended for informational and educational
purposes. It should not be considered a solicitation of an offer or sale of any security. The reader assumes all risk when
trading in securities and Thirdeyeopentrades advises consulting a licensed professional financial advisor before
proceeding with any trade or idea presented in this newsletter. Thirdeyeopentrades may take a position and sell a
position in any security mentioned in this newsletter. We share our ideas and opinions for informational and
educational purposes only and expect the reader to perform due diligence before considering taking a position in any
security. That includes consulting with your own licensed professional financial advisor.