1. Specific Aims
During navigation, animals need to maintain an internal sense of direction. This function is carried out by the
head direction system: a distributed network of head direction cells and angular head velocity cells. Head
direction cells fire persistently when the animal is facing a particular direction in the environment, while angular
head velocity cells encode the speed of lateral head movements. Head direction cells are hypothesized to
compute the time integral of angular head velocity signals 1,2
. Lesion studies have localized the computation of
the head direction signal to the lateral mammillary nucleus (LMN) in the hypothalamus. Based on anatomical
inputs and the presence of both head direction cells and angular head velocity cells, LMN is thought to be a
vestibular velocity-to-position integrator that is corrected by visual landmark information. Theoretical work has
proposed that the circuit mechanism for the integrator is a ring attractor 3
.
Many key tenets of this model have not been tested directly due to a lack of methods. First, the most
essential element, that LMN head direction cells integrate input from angular velocity cells, has never been
confirmed. Second, the circuit mechanisms by which head direction signals are corrected by visual input have
not been studied. Finally, although attractor models fit head direction cell firing patterns well, direct
experimental tests of the connectivity that could support these dynamics in LMN have never been performed.
We will develop methods to address these questions in the mouse. Knowledge of how head direction signals
are generated will not only advance our understanding of spatial navigation, but will also provide insight into
how the brain performs integration over long timescales, a fundamental computation
Aim 1: Develop a system to study head direction cells in head-fixed mice using imaging methods. Head
direction cells have been studied almost exclusively in freely moving animals using extracellular recording
methods. These experiments have significant shortcomings, including that vestibular inputs cannot be
decoupled from other sensory inputs, angular head velocities are non-uniformly sampled, and modern circuit
analysis methods cannot be implemented. We are building a system in which a head-fixed mouse can be
physically rotated 360 degrees within a precisely controlled visual environment, allowing us to separately
manipulate visual and vestibular cues in open- or closed-loop (Aim 1a). This setup is designed to allow precise
alignment of the center of rotation with the optical axis of a microscope objective, enabling 2-photon imaging
during rotation. In parallel we are developing an imaging preparation to measure head direction cell and
angular head velocity cell activity using a GRIN lens implanted above LMN.
Head direction cells are hypothesized to integrate angular head velocity signals to perform a velocity-to-
position computation4
. However, it has been difficult to decouple vestibular and other sensory inputs, especially
hard to eliminate cues like olfactory and somatosensory cues5
. We will map the spatiotemporal receptive fields
(STRFs) of angular head velocity cells and head direction cells under three different conditions: vestibular only,
matched vestibular and visual, and mismatched vestibular and visual (Aim 1b). Generalized linear models will
be developed to predict firing rates of both cell types based on visual cues, vestibular inputs, and running
patterns6
. In the vestibular only case, we will directly test the hypothesis that LMN head direction cells integrate
vestibular information by determining if head direction signals are robustly updated in the absence of other
consistent sensory cues.
Aim 2: Study the role of postsubiculum (PoS) in visual correction of the AHV integrator. Integrators tend to
accumulate error without a correction signal. Based on previous anatomical and lesion studies, we hypothesize
that projections from the PoS provide a visual correction for head direction cells in LMN7
. It is not known what
information is sent from PoS to LMN. One possibility is that PoS head direction cells project to LMN and the
association between visual landmarks and HD occurs in layer 5 of PoS. An alternative hypothesis is that PoS
sends higher-order allocentric visual information to LMN to correct head direction cell firing. We will image
PoS-LMN axon terminals and characterize their STRFs using the methods described in Aim 1. We will also
optogentically inhibit PoS-LMN projections while recording from the LMN population. We predict that inhibition
of this pathway will result in the loss of landmark influence on LMN head direction cells.
Aim 3: Test for connectivity profiles predicted by attractor network models. Although the inter-regional
connectivity of the head direction system has been characterized, no studies have examined local connectivity
within LMN. One popular model supporting ring attractor dynamics requires recurrent excitatory connectivity
between head direction cells3
. Alternate models propose that LMN is a feedforward nucleus with little recurrent
connectivity8,9
. We have identified a putative genetic marker of LMN neurons10
. We will combine mouse genetic
tools with pseudotyped rabies tracing to determine if neurons projecting out of LMN receive local input, a key
prediction of the first model. We will also use this technique to examine reciprocal connectivity between LMN
and DTN to see if it is consistent with a distributed inhibitory attractor network, the main alternative model to
recurrent excitation.
2. Background
Introduction.
Successfully keeping track of where we are is critical to our survival. As animals navigate, they constantly keep
track of their position using a range of different sensory inputs. In the absence of reliable environmental cues,
self-motion information can be used to maintain a running estimate of position and heading, a process known
as path integration 11
. When familiar landmark cues appear, they can be used to reset these estimates1
. We
are interested in understanding the circuit mechanisms by which the brain generates our sense of direction,
updates this based on self-motion, and corrects it based on environmental cues.
Neural correlates of navigation: place cells, grid cells, and head direction cells.
The spatial navigation system is a distributed network comprised of many different functional cell types. Figure
2 summarizes some the main regions involved, and the functional cell types present in each area (with an
emphasis on the head direction component of the system). Several striking neural correlates of spatial
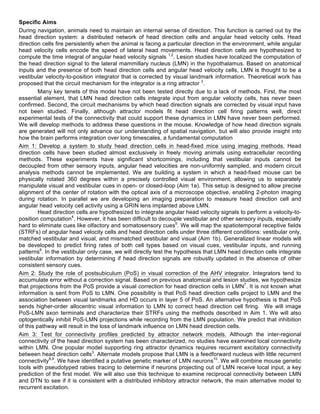
navigation have been found (Figure 1). Place cells are neurons which fire
when the animal is in a particular location in the environment; a spatial
receptive field known as the cell’s ‘place field’ 12
. Grid cell firing can be
described as multiple place fields tiling space in a hexagonal grid 13
. The
periodic firing of grid cells can vary in spatial frequency, while place cells vary
considerably in size and shape. Together, these cells are thought to form a
cognitive map – an internal representation of where the animal is at a given
point in time11
.
Head direction cells (head direction cells) are neurons that fire
preferentially when the animal is facing a particular direction in the
environment. Head direction cells were first identified in the rat postsubiculum
(PoS), an area in the hippocampal formation 1
. Since their discovery, head
direction cells have been found in a number of other brain regions. They are
particularly numerous throughout the Papez circuit, a pathway in the limbic
system that connects the mammillary bodies of the hypothalamus with regions
in the hippocampal formation. From the hippocampal formation, the
postsubiculum projects back to the mammillary bodies, completing a loop 4
.
Within the Papez circuit, PoS, lateral mammillary nucleus (LMN), anterodorsal
nucleus of the thalamus (ADN), and anteroventral nucleus (AV) all contain
head direction cells. The percentage of head direction cells varies
considerably between each of these area: LMN has 25%, ADN 55%, and PoS
25% 14
. Since these areas increase in size, the total number of head direction
cells in rat varies by an order of magnitude across brain regions, from roughly
1000 in LMN to over 50,000 in PoS 14
. Mice share very similar brain anatomy
to the rat, and based on size differences are estimated to have between 1
/5 and 1
/4 of this number.
General firing properties of head direction cells. Head direction tuning curves – firing rate plotted as a function
of heading direction - are roughly triangular or gaussian in shape 1
. An example tuning curve of a head
direction cell in PoS is shown in Figure 1. Pure head direction cells fire persistently when the animal is facing
their preferred firing direction and are typically only weakly modulated by movement 1
. Pure head direction
cells are also invariant to other variables such as whether it is light or dark, and position of the animal in space
15
. Like place and grid cells, head direction cells are allocentric – they use a reference frame determined by the
environment – and do not depend on egocentric variables such as the angle of the head relative to the body.
The width of the head direction cell tuning curve and the peak firing at the preferred direction varies
considerably across different brain regions. For example, in the lateral mammillary nucleus head direction cells
have relatively broad tuning and high firing rate, while ADN and PoS head direction cells have narrower tuning
with lower average peak firing rates 1,16,17
. Peak firing rates vary between 5-200 Hz across the head direction
system 14
.
Broadly, the head direction system can be thought of as receiving two different classes of input:
allocentric and idiothetic. Allocentric information concerns the environment and the animal’s position in it, such
as visual, olfactory, and somatosensory landmark cues. Idiothetic input is information relating to the animal’s
self motion. Idiothetic inputs would include vestibular signals for linear acceleration and angular velocity, as
well as motor efference and proprioceptive information related to the mouse’s running behavior. One key
feature of the head direction system is its ability to dynamically switch between relying on these different
3. sensory modalities with little or no change in the firing of head direction cells 1
. It is unclear how this is
accomplished on a circuit level.
To determine what kinds of allocentric sensory information affect firing, several studies have monitored
head direction cell activity following the manipulation of landmark cues 1,18,19
. In a classic set of experiments,
rats were placed in a cylindrical closure with a cue card taped on one side 1
. When rats were removed and the
cue card shifted by a set amount, the directional tuning of cells would shift nearly equivalently upon return of
the rats to the chamber. Importantly, when multiple head direction cells were recorded simultaneously, cells
always maintained the same angular distance between their peak firing rates1,20
. Other than a shift in
directional tuning, no changes in the firing properties of head direction cells were observed. Removing the cue
card or turning off the light did not have any noticeable effect on the firing rate of head direction cells. These
experiments, and many others with similar results, demonstrate that environmental visual landmark cues exert
a strong influence over head direction cells, and that head direction cells map to an allocentric reference frame.
Other studies have examined the influences of auditory stimuli on the firing of head direction cells. In a
similar cylindrical environment but without salient visual landmarks, clicks were played from one of 4 speakers
surrounding the arena 5
. Despite the fact that rats and mice can fairly easily locate the source of a sound in
space, changing which speaker the clicks were played from did not have any noticeable effect on the firing
rates of head direction cells 5,15
. However, it is difficult to conclude much from these experiments. It is still
possible that auditory cues can influence head direction cells by using more salient stimuli or by playing
sounds consistently from one direction for a longer period of time so that a directional association can be
formed.
Olfactory cues appear to be similar to visual cues in their ability to act as landmarks for head direction
tuning. Repeating the cue card experiments but with olfactory cues caused similar shifts in the tuning of head
direction cells 5
. The use of olfactory cues as landmarks is further supported by the fact that removing the rats,
rotating the floor paper of the enclosure, and returning the rats is usually followed by a shift in head direction
cell tuning5
. Since the floor paper was changed at the start of each experiment, this indicates that rats lay down
olfactory cues, most likely urine, relatively quickly after entering an environment and that these cues are then
subsequently used by the animal for spatial orientation. These experiments highlight a potential confound in
the previously mentioned visual cue card experiments: they were unable to control for olfactory landmarks.
This is particularly problematic for experiments in which visual cue changes were found to have less of an
effect than expected. For example, during some cue card rotation trials, the head direction cells shifted by less
4. than the rotation of the cue1
. Because olfactory cues could not be eliminated, it is unclear whether this was due
to (a) a combination of remembered heading with altered landmark information to generate a new, intermediate
estimate or (b) the presence of two conflicting sets of landmark information. These olfactory cue results also
cast doubt on experiments in which rats are blindfolded and assumed to be deprived of landmark cues21
. In
these cases, when head direction cells do not accumulate error over time, this could be either due to
successful path integration or due to residual olfactory cues being used to reset the integrator. Better systems
are required to control for olfactory input, and other potential confounds such as somatosensory cues.
When familiar landmark cues are unavailable, an animal must rely on self-motion information to update
head direction cell firing. Vestibular input is thought to be the main form of idiothetic information to the head
direction system 22
. However, there is some controversy over whether head direction cell firing is stable with
vestibular input alone, and to what extent active movement information is used19,23,24
. There are two main types
of experiments that demonstrate the importance of vestibular input for the proper functioning of the head
direction system: lesions to the vestibular system and passive movement experiments. Lesions to the
vestibular system abolish head direction cell firing in ADN and PoS, clearly demonstrating necessity17,25
.
Experiments trying to demonstrate vestibular cue sufficiency have produced mixed results. In some cases,
manually holding the rat and moving it back and forth caused head direction cell firing to decrease, although
tuning was roughly consistent1,26
. When rats were passively transported on a cart in the dark, head direction
signals appeared to accumulate error23
. Other studies have shown that rotating a restrained rat on a turntable
in the dark while recording from head direction cells is sufficient to reliably update of the head direction signal
24
.
Finally, a small number of experiments have been carried out to examine the contributions of both
idiothetic and allocentric cues to HD cell activity. Head direction cells were recorded in ADN while the rat
navigated in a cylinder. The floor and the walls of the cylinder could be rotated independently in order to
provide conflicting vestibular and visual input19
. The rats were exposed to different combinations of landmark
movement and vestibular input. Head direction cell tuning was influenced by both visual landmark movement
and by passive rotation. As expected, the head direction signal was most reliably updated when cues were
consistent with each other. As in other experiments, rotating the rat in the dark resulted in consistent head
direction cell firing. It has increasingly become clear that vestibular information is needed for proper functioning
of the head direction system25,27
. However, the results of vestibular-visual cue conflict experiments are difficult
to interpret because of the lack of control for olfactory cues, and the absence of quantitative models that
capture cell responses in these situations. The relative contributions of visual and vestibular information to
head direction cell firing remains a major open question, and warrants future research that more systematically
explores the stimulus space of each cue.
Together, these experiments have led to the model that one of the key computations carried out by the
head direction system is integration of angular velocity over time. This integration is used to update head
direction cell firing on a moment-to-moment basis, and is likely to be the main influence when an animal is
navigating through unfamiliar environments devoid of reliable landmark information. However, the fact that
head direction cells can be influenced by a diverse range of allocentric cues, including visual, somatosensory,
and olfactory, has made it difficult to characterize the dynamics of pure velocity integration in the head direction
system.
Generation of the head direction signal.
Because the head direction system is highly distributed, it has been difficult to determine exactly where the
head direction signal arises. Throughout the last several decades, many inactivation studies have been
performed to try to understand inter-areal dependencies in the head direction cell network and determine the
hierarchy of head direction cell processing22
. These experiments, combined anatomical knowledge of the
connectivity between brain regions, and the functional cell types present in each area, have provided us with a
clear picture of where the head direction signal emerges.
Figure 2c summaries some of the main results of these lesion experiments. Most lesion experiments have
focused on areas within the Papez circuit: LMN, ADN, and PoS. Overall, these studies have revealed a clear
hierarchy within the head direction system (Figure 2d). Importantly, several different types of lesions of the
vestibular system have been carried out and all result in disruption of head direction cell tuning17,22
. Lesions of
LMN and DTN abolish head direction cell firing in ADN28
. However, lesions of PoS, RSP, and MEC do not
result in loss of head direction cell activity in ADN22,29,30
. Together, these results strongly suggest that the head
direction signal is formed in LMN and/or DTN and projected to cortical and hippocampal areas via ADN.
5. The idea that the generative circuit for head direction arises in DTN and LMN is also supported by the
functional properties of cells in these areas. Within both of these regions, there are large numbers of angular
head velocity cells: neurons which are modulated by speed and direction of lateral head movements. In DTN,
angular head velocity cells make up ~75-85 % of all cells, while in LMN roughly half of all cells are AHVCs 14
.
Since changes in head direction can be directly computed by integrating angular velocity over time, the
presence of both AHVCs and head direction cells in the same population is suggestive of a circuit in which
head direction information is being updated based on self-motion. Also in support of this hierarchy is the finding
that LMN and ADN head direction cells display anticipatory activity: they fire up to 100 ms in advance of the
head being in a particular location 14,31
.
Correction of the head direction signal
Integrators tend to accumulate error in the absence of a correction signal. In the head direction system, this
correction signal takes the form of allocentric information such as visual landmark cues. Visual information
enters the head direction system via projections from visual cortices to PoS, both directly and via retrosplenial
cortex. Lesions of PoS cause LMN head direction cells to drift and no longer be influenced by visual cues,
implicating the PoS-LMN projection in the reset of head direction cells based on allocentric cues7
.
Where in the brain landmark information is associated with head direction is unknown. One possibility is
that the association between visual landmarks and HD occurs in PoS. PoS receives inputs from ADN, as well
as retrosplenial and visual cortices32
. Layer 5 cells in PoS project to LMN33
. One hypothesis is that LMN-
projecting PoS layer 5 neurons are head direction cells, receiving both tonic head direction input from ADN and
allocentric visual information. During navigation in a visual environment, new landmark cues are associated
with current heading via plasticity in the apical dendrites of PoS L5 neurons. When an orienting visual cue
appears, the head direction cells that were associated with that cue will be preferentially excited by inputs from
V1 and RSP. Depending on the degree of drift that has occurred, there are two possible outcomes. If the drift is
small and the visual cues are unambiguous, the excitation from the landmark will be sufficient to activate the
correct set of head direction cells and counter the drift. On the other hand, if the drift is large (eg 180 degrees),
the orienting input may not be sufficient to shift head direction cell firing. In this case, head direction cell tuning
will not shift from the drifted tuning values, and a new reference frame will be established. The head direction
cells will remain in the drifted reference frame, and landmark cues will become associated with this new set of
head direction cells via plasticity. This ‘resetting’ vs ‘remapping’ has been observed in freely moving rats that
are carrying out a homing task21
. Rats were trained to forage in the dark for a food pellet located randomly in a
circular arena. After finding the pellet, rats must return to their home location to eat. During each trial, some
error accumulates in the tuning of head direction cells. This error typically correlates with the error in the
trajectory that the rat takes back home. On trials where the error is small, head direction cell DT usually resets
when the rat encounters the wall. On trials when the error is large, head direction cell DT did not reset to its
previous value, but instead maintained its drifted DT, establishing a new reference frame that was used on
subsequent trials.
An alternative hypothesis is that the previously discussed PoS-LMN projections send higher-order
allocentric visual information instead of HD: the HD landmark association then occurs in LMN8
. Landmark
views could be associated with a particular heading through a similar plasticity mechanism at the PoS-LMN
synapse.
Circuit-level models
We would like to gain a mechanistic understanding of how the neural representation of head direction is
generated and maintained. Several circuit-level theoretical models have been developed for the head direction
system. The most popular class of models are ring attractor networks 3
. Since the ring attractor network was
first proposed and formalized, many variants have been developed to account for the wide range of firing
characteristics that we have discussed 2,3,8,9
. In the classic ring attractor model, head direction cells with similar
tuning excite each other and inhibit cells with opposite tuning. Some models incorporate normalizing inhibition
instead11
. This connectivity pattern is illustrated in in Figure 3a. When the animal is stationary and facing north,
neurons with a preferred firing direction of north will recurrently excite each other and lead to the suppression
of other head direction cells, forming a stable attractor state. This system has several advantages for encoding
head direction. Because of the recurrent excitation, activity will persist in head direction cells, providing a
neural substrate for memory of angular position. Inhibition of the surround ensures that the population will
always converge to a single heading.
6. To account for the shift in heading direction, it
has been proposed that, during a turn, head direction
cells with preferred firing in the direction of the turn are
preferentially excited3,11
. This asymmetric input would
act to push the bump of activity to a new location. It
has been hypothesized that the source of the
asymmetric excitation comes from conjunctive cells –
cells that are modulated by both head direction and
angular velocity 11
. Figure 3 illustrates how this could
work. Under this model, there are two sets of
conjunctive cells, each modulated by either clockwise
or counterclockwise turns and containing neurons
tuned to roughly all head directions. These neurons
provide excitatory input onto head direction cells with
tuning slightly offset from their preferred firing
direction. This offset is what provides asymmetric input
during a turn to shift the activity of head direction cells.
There are only two brain regions that are known to
contain head direction cells, angular velocity cells, and
conjuctive cells: DTN and LMN.
Most computational models of HD cell firing use attractor dynamics supported by recurrent excitation.
However, whether areas such as LMN and DTN contain local connectivity conducive to these models remains
controversial 34,35
. A study of the morphology of neurons in LMN using Golgi staining did not find any evidence
of local axon collaterals: the authors were only able to trace axons of LMN neurons over short distances before
they either disappeared or left the slice35
. Alternative models have been developed that do not require
recurrent excitation8,9
. A much finer understanding of the microanatomy within LMN and DTN is needed in
order to test the ring attractor hypothesis.
One alternative model that has been proposed acts though long range, tuned inhibition from DTN and
does not require local connectivity within LMN8
. Figure 3b illustrates the basic components of this system. Only
two studies to date have recorded from DTN, with conflicting results: one study reported that there were no
‘classic’ head direction cells, while the other reported that 12% of cells were head direction cells14,36,37
. Without
knowledge of the connectivity within and between these regions, it is difficult to either support or refute either of
these classes of models.
Methods used to record from head direction cells
Head direction cells have typically been recorded in freely moving rats using extracellular electrophysiological
approaches. These recording approaches have a number of shortcomings, including that many cells cannot be
recorded from simultaneously. Higher density extracellular recordings have been achieved using multisite
silicon probes in the head direction system20
. Recently, cellular-resolution functional imaging has been used to
record from neurons. Genetically encoded calcium indicators (GECIs) increase their fluorescence upon binding
calcium, which results in fluorescence values correlating with action-potential mediated calcium influx into the
cell38
. Combined with imaged methods, such as 2-photon microscopy, that have good single-cell resolution, we
can now record the activity of hundreds of neurons simultaneously at much higher densities than can be
recorded using either tetrodes or silicon probes. This not only greatly increases yield for single cell analyses,
but also provides information about population-level dynamics. For example, the previously mentioned silicon
probe recordings revealed that correlations between head direction cells with similar tunings are preserved
throughout a range of different behavioral states, including sleep, a phenomenon that would not have been
possible to find using traditional tetrode recordings20
. To image deeper brain regions, gradient refractive index
(GRIN) lenses have been used. GRIN lenses are cylindrical pieces of glass in which the refractive index of the
glass varies from the center axis to the edges39
. Light rays are therefore continuously bent throughout the
length of the lens. By choosing the appropriate length of lens, light rays entering the surface of the lens can be
focused at the bottom, allowing the lens to act as an imaging relay.
Open questions and future directions
Since the first discovery of the head direction cells, major advances have been made in understanding how the
head direction system operates on systems level. In particular, recordings from multiple brain regions have
revealed the distributed nature of the system and provided us with a map of where head direction cells are
7. located throughout the brain. Knowledge of the connectivity between areas, along with lesion studies, has
revealed inter-areal dependencies and a hierarchy of head direction processing from brain stem and
hypothalamic regions to cortex and hippocampus. Here, we will briefly summarize these main findings in a
working model for how the head direction cell system might operate, and highlight gaps in our understanding of
this system.
One of the key features of the head direction system is that it can dynamically switch between reliance
on allocentric vs idiothetic cues. LMN is ideally situated to be involved in this process: it lies at intersection of
ascending vestibular input from the brain stem and descending input from PoS. We hypothesize that LMN
serves two main functions: angular path integration and allothetic-based reset. During angular path integration,
the vestibular system captures information about lateral head movements. This is projected to DTN, where
cells are tuned to encode speed and direction of angular head velocity. DTN is reciprocally connected with
LMN, and both of these areas contain a mixture of head direction cells, angular velocity cells, and conjunctive
cells. Under this model, LMN integrates angular velocity, either through local circuitry or via its reciprocal
connections with DTN. Ring attractor dynamics have been proposed as the circuit mechanism for both angular
velocity integration and persistent firing of head direction cells. The classic model often cited in the literature
accounts for persistent activity via recurrent excitation within LMN. Several models that do not require recurrent
excitation have been developed. However, it has been difficult to either support or refute either class of model,
since basic information about the presence or absence local connectivity in LMN is unknown.
LMN projects on to ADN, where there is an expansion in the number of head direction cells and the
sharpness of their tuning. ADN in turn projects to several brain areas, but most importantly has reciprocal
connections with PoS. Lesion studies implicate the PoS-LMN projection in visual calibration of head direction
cells7
. While PoS appears to be necessary for this characteristic of head direction cells, it is unclear where
associations are formed between landmark cues and heading direction. Ideally, we would like to know what
information is being sent in the dense and specific PoS-LMN projection.
Significance
The head direction system performs two fundamental operations: it maintains a memory of heading through
persistent activity, and it integrates input (angular velocity) over long timescales. This system is convenient to
study because the output of these two operations is low dimensional and has clear behavioral correlates21
.
However, these two operations are essential for the functioning of many different systems and thus detailed
examination of the circuits generating the head direction signal will have implications beyond the field of spatial
navigation. For example, attractor networks have been proposed as a potential mechanism for gain
modulation, de-noising in visual cortex, and as a potential substrate for working memory in prefrontal cortex40-
43
. Abstract cognitive tasks, such as accumulating evidence before reaching a decision, could also occur
through circuit mechanisms similar to those employed in the head direction system.
Aim 1: Develop a system to study head direction cells in head-fixed mice using imaging methods.
Head direction cells have been studied almost exclusively in freely moving animals using extracellular
recording methods. These experiments have significant shortcomings, including that vestibular inputs cannot
be decoupled from other sensory inputs, AHVs are non-uniformly sampled, and modern circuit analysis
methods cannot be implemented. These confounds and lack of control have made it difficult to quantitatively
determine the different sensory and motor contributions to head direction cells and AHVCs. For example, while
head direction cell firing in absence of strong visual landmarks has long been cited as evidence for vestibular
integration in the HD system, many of these studies have been unable to eliminate other consistent sensory
cues, such as olfactory and somatosensory cues5
.
In order to develop quantitative, circuit-level models of the head direction system, it is necessary to
understand the contributions of each stimulus modality to the firing of the cells. It is particularly important to
carry this out in LMN because neurons there display a range of different firing properties: head direction cells
and AHVCs are intermingled with cells that have mixed, or conjunctive, selectivity16,44
. The classic ring attractor
model has been proposed to act as a pure angular velocity integrator and predicts cells with conjunctive
selectivity to both head direction and angular velocity. To more rigorously test the hypothesis that LMN is an
angular velocity integrator, we are developing a system to record LMN neuron activity in head-fixed mice while
separately manipulating visual and vestibular cues in open- or closed-loop. This setup is designed to allow
precise alignment of the center of rotation with the optical axis of a microscope objective, enabling 2-photon
imaging during rotation of the mouse.
8. Aim 1a: Develop the methods to image LMN head
direction cells. We are developing a preparation to
measure head direction cell and AHVC activity in LMN
using two-photon calcium imaging through a GRIN lens
implanted above LMN (Figure 4). LMN is located
approximately 6mm below the dorsal surface of the
brain. It is approximately 300 um medial-to-lateral, 500
um anterior-to-posterior, and 300 um dorsal-to-ventral.
Because of its small size and depth, targeting the area is
a significant challenge. We are using skull landmarks to
determine our injection coordinates. We have developed
a semi-automated procedure in which we precisely level
the skull and then determine the main skull landmarks –
bregma and lambda – by fitting lines and curves to the skull sutures. This has previously been shown to reduce
error compared the conventional method of choosing bregma manually45
. In our hands, this procedure has
resulted in fairly good and consistent targeting accuracy.
To image the activity of LMN neurons, we will deliver the genetically encoded calcium indicator
GCaMP6s under the control of a synapsin-1 promoter via an adeno-associated virus (AAV) injection. A
headplate will be affixed to the mouse during this surgery, parallel to the skull-flat orientation. After one week of
recovery, we will drill a small, 1mm craniotomy in the skull above LMN. We will then insert a 0.5 mm inner
diameter glass-bottomed cannula vertically to the depth of LMN46
. The advantages of using a cannula is that it
does not require us to implant a grin lens in each mouse, and different grin lenses can be tested in each
animal. This is potentially useful for switching between low magnification lenses - for imaging large populations
- and higher magnification lenses with fewer spherical aberrations for imaging subcellular structures. We are,
however, also exploring the alternative approach of implanting GRIN lenses directly. We are also testing larger
1mm diameter GRIN lenses.
This approach will provide three main advantages over traditional tetrode recordings. First, larger
populations of neurons can be simultaneously recorded. We should be able to record from up to 20 (~5% of
LMN) neurons simultaneously using a 0.5 mm outer diameter GRIN lens, and over 100 neurons
simultaneously using a 1 mm OD GRIN lens. By focusing up and down, we can image XY planes across
~160um in the z-axis. Based on previous characterization of this method (Bocarsly et al 2015) and the
anatomy of LMN, a 0.5 mm grin lens should grant us optical access to ~ 35% of the volume of LMN. A 1 mm
GRIN lens, if positioned correctly, should allow us to image from close to 75% of the total volume. These
estimates provide an upper bound, but even with suboptimal imaging quality or placement of the GRIN lens we
can reasonably expect to get many more neurons in a single imaging session than tetrode recordings would
allow. Using multiple tetrodes can yield simultaneous recordings of 10s of neurons, but the number of
individual units on each tetrode is still small and the size of LMN would restrict us to recording from a maximum
of two tetrodes47
.
The second advantage of an imaging approach is that we can record from genetically and/or
anatomically identified populations of neurons. We are in the process of characterizing a transgenic mouse line
(Tac2-cre) which, based on publically available ISH data, appears to label LMN neurons and not surrounding
tissue (Figure 8)10
. With genetic or anatomical markers of LMN (such as retrograde tracing from its projection
targets) we can confirm LMN identity in vivo, avoiding error-prone post-hoc histology. This is especially
important since AHVCs have been found in the medial mammillary nucleus, complicating functional
confirmation32
. Finally, gaining optical access to LMN will allow us to record inputs from different brain regions
via two-photon calcium imaging of axons. In preliminary experiments, we have observed calcium transients
from subcellular structures (likely dendrites) through the 0.5 mm GRIN lens, indicating that we probably have
sufficient resolution to carry out such experiments (Figure 4). These experiments, along with alternative
approaches, will be discussed in Aim 2.
Preliminary experiments show that this imaging approach is feasible: we have successfully obtained
activity measurements from putative LMN neurons. Furthermore, survival rate is high and we have not
observed any obvious behavioral deficits in mice implanted with imaging cannulas: mice can learn to run
straight on a spherical treadmill to obtain rewards. We aim to carry out further behavioral controls, such as
training mice on a basic visual detection task to make sure that their visual system is not impaired. However, if
this imaging preparation proves to be too difficult or low-throughput, there are alternative approaches that
9. would still allow us to address the questions in this aim. One safe alternative to
imaging is using tetrodes or silicon probes inserted into LMN. As mentioned
earlier, the size of LMN limits us to recording with only one or two tetrodes, so
our cell yield per session would be low.
Next, we will develop a system in which vestibular and visual cues can be
separately manipulated during imaging of LMN. Figure 5 illustrates the system. A
mouse is head fixed on top of an air-supported spherical treadmill and
surrounded by a rotating drum with landmark cues attached to it. An optical
sensor records the movement of the treadmill, allowing us to track running
behavior. The treadmill assembly sits on top of a stack of motorized stages: two
XY stages with a theta (rotation) stage sandwiched between them. The
lowermost stage is used to align the axis of rotation of the theta stage with the
optical axis of imaging. This alignment needs only to be done once at the start of the experiments and will
remain fixed. The uppermost XY stage is used to align the imaging field of view (FOV) with the
optical/rotational axis. Since the objective is fixed, the orientation of the FOV will rotate with the mouse during
imaging. With the correct alignment, this rotation will take place about the center of the FOV, so the majority of
cells will be imaged at all times in the experiment, regardless of the orientation of the mouse. With high
imaging frame rates (30-60Hz), a simple full-field rotational alignment of the frames based on the known
orientation of the mouse should be sufficient to correct for the changes in orientation when the mouse is
stationary or rotating slowly. Residual motion artifacts from mouse running can be subsequently corrected.
When higher rotational speeds are used and full-frame rotation is not sufficient to fully correct for the changes,
we plan to implement a line-by-line correction algorithm in which each scan line will be rotated independently.
This will compensate for rolling-shutter-type artifacts that could occur with high speeds of rotation.
One potential challenge of imaging during rotation is that rotation may cause the brain to move in
unexpected ways and introduce movement artifacts that are difficult to correct using standard algorithms. This
is of particular concern in our case since we are looking for neural correlates of angular head movements. We
will address this potential pitfall by expressing a nuclear localized mCherry in addition to GCaMP6s in some of
our imaging experiments. Within an imaging session, any transient fluorescence changes mCherry must be
due to experimental artifacts. We will assess how frequently these artifacts occur, whether they show
correlations with angular motion or running behaviors, and whether they can be corrected with image
processing. If these artifacts do prove to be a problem, nuclear localized tdTomato will be used in all
experiments to improve motion correction and exclude unreliable data.
Targeting difficulties may cause the imaging to be low throughput. However, we do not expect this to be
the case based on our current targeting accuracy with injections. Furthermore, the development of our semi-
automated system for performing skull leveling and alignment has made surgeries much more efficient, such
that large numbers of surgeries can be carried out if necessary.
Aim 1b: Characterize the visual and vestibular contributions to LMN neurons
Until now, it has been difficult to comprehensively map the spatiotemporal receptive fields (STRFs) of AHVCs
and head direction cells since, in freely moving animals, angular head velocities are non-uniformly sampled
and cannot be fully decoupled from other sensory inputs. Using the head-fixed rotation and imaging
preparation we have just described we will determine the vestibular, visual, and motor efference /
proprioceptive contributions to head direction cells and AHVCs. To map out STRFs we will record from a
population of LMN neurons in the head-fixed mouse under three different conditions: rotation of the mouse in
the dark, rotation of the mouse in a lit environment, and rotation of the visual scene while the mouse is fixed.
Figure 6 illustrates these three experimental setups.
We are interested in the relative contributions of vestibular, visual, and motor efference information. For
each cell, STRFs will be produced for head direction and angular velocity. To more quantitatively measure the
individual contributions of visual and vestibular stimuli, we will construct a generalized linear model to predict
cell activity under the conditions described in Figure 6. We will model the firing of each neuron as dependent
on a weighted linear combination of variables such as head direction, angular velocity, light/darkness, and
running characteristics such as angular velocity and acceleration6
.
10. Based on tetrode recordings from LMN, we expect to observe three
main classes of cells: ‘pure’ head direction cells that are not modulated by
angular velocity, angular velocity cells, and conjunctive cells that are
modulated by both angular velocity and heading direction. We also expect to
observe two distinct subtypes of angular velocity cells. Symmetrical angular
velocity cells do not differentiate between left and right head turns: their firing
rate is roughly proportional to the absolute value of angular velocity.
Alternatively, asymmetrical angular velocity cells differentiate between left
and right turns. While some asymmetrical cells are inhibited by turns in their
non-preferred direction, others are not modulated. Typically, cells are
identified as either head direction cells or AHVCs and their firing rates plotted
as a function of the corresponding variable. By using the GLM to fit the firing
rates of neurons, we are taking an unbiased approach to classifying
functional cell types. We can see if cells fall into discrete functional groups by
clustering the coefficient vectors of each cell.
In order to test the hypothesis that head direction cells robustly
integrate vestibular angular velocity in the absence of consistent allocentric
cues, we will examine their activity in the dark during rotation when only
vestibular information is available. We expect that over short timescales
(seconds), head direction cells will maintain their tuning during rotation. We expect that over longer timescales
(minutes), the tuning of head direction cells will gradually drift, accumulating error. The ring attractor model
predicts that this drift should be consistent across all head direction cells.
One potential pitfall of this experiment is that damage to overlying areas during insertion of the cannula
will bias our results. For example, visual information may be underrepresented due because of damage to the
visual system. To address this, we will compare our results with published recordings of LMN neurons using
tetrodes. If we find properties that are substantially different from the results reported previously, we will
validate these findings using tetrode or silicon probe recordings from LMN in the same head-fixed environment.
As mentioned earlier, electrophysiology could be used as the main method of recording if such problems arise.
This would come at the cost of lower number of recorded cells per session and inability to record population-
level dynamics.
A major potential pitfall is that the head direction system will not be recruited in the head fixed mouse.
There have been no published reports of head direction cell recordings in head fixed animals. However, there
is substantial evidence to suggest that the head direction cell system will be recruited in our apparatus. First,
head direction cell activity has been recorded in restrained rats. This includes rats that are restrained in a tube
and rats that are fixed in space but allowed to rotate freely within a virtual reality environment24,48
. Second, grid
cell activity is thought to depend on head direction49
and clear grid cell activity has been recorded in head-fixed
mice50
. Finally, there have been preliminary reports from other labs of head direction cell activity recorded from
head-fixed mice on turntables (SfN abstracts).
Aim 2: Study the role of postsubiculum (PoS) in visual correction of the AHV integrator
Integrators tend to accumulate error in the absence of a correction signal. In the head direction system, this
correction signal often takes the form of allocentric landmark information. Based on previous anatomical and
lesion studies, we hypothesize that projections from the PoS provide visual correction for head direction cells in
LMN. Lesions of PoS do not abolish head direction cell firing in LMN, but do impair the ability of landmark cues
to correct their directional tuning. During navigation around an arena in light, head direction cells usually retain
their tuning with little to no drift. Following lesions of PoS, LMN head direction cell activity drifts as it would in
dark and rotations of cue cards do not cause a corresponding shift in head direction cell tuning7
. These studies
provide strong evidence that visual information gains control of the head direction signal via the PoS-LMN
projection. However, it is not known what information is sent from PoS to LMN. The intended goal of this aim is
to determine how calibration of the velocity integrator occurs on a circuit level.
First, we will test the hypothesis that the PoS-LMN projection is required for visual control of head
direction cells. As described in Aim 1, an AAV will be injected into LMN to express GCaMP6s. A GRIN lens will
be implanted over LMN. In addition, we will inject a virus into PoS to express the halorhodopsin eNpHR3.0
broadly in PoS neurons. Two weeks after the surgery, we will begin to habituate mice to head restraint. After a
week of habituation, we will image LMN neurons as described in Figure 4. First, we will fit GLMs and
characterize the STRFs of each neuron using the stimuli and methods described in Aim 1. We will then repeat
11. this process while intermittently
inhibiting the PoS axon terminals
with 590 nm light continuously for
1-5 minute periods. This
wavelength of light is sufficiently
removed from the excitation and
emission spectra of GCaMP that a
<590 nm short pass filter in our
collection optics will result in good
GCaMP6s signals without large
photostimulation artifacts. GLMs
will be fit separately for control and
stimulation epochs. Variable
coefficients will be compared
across these two conditions to provide a quantitative measure of visual environmental influence on LMN
neurons. We expect that during stimulation, head direction cells in LMN will be influenced less by visual
landmarks, and that drift in head direction cell tuning will occur even in the presence of visual landmarks.
There are two alternative models for where landmark information is associated with head direction and
therefore where correction events occur. Our primary hypothesis is that visual information is associated with
current heading in PoS, most likely via plasticity in the apical dendrites of L5 neurons. Under this model, in the
absence of visual input, PoS-LMN neurons will display head direction cell tuning, be largely invariant to the
presence of landmark cues, and will drift proportionally to LMN head direction cells.
Alternatively, PoS could send higher order allocentric information that is then associated with heading
direction within LMN by a similar plasticity mechanism. Under this model, we would expect PoS inputs to LMN
to vary depending on the amount and type of visual landmark information available. The mechanism for
remapping vs resetting in this model is the same as before.
To distinguish between these two models of the correction system, we will record the activity of PoS-
LMN axon terminals and characterize their STRFs using the methods described in Aim 1. In Tac2-cre mice
(Figure 8) expressing TdTomato under Cre control, an AAV expressing GCaMP6s will be injected into PoS and
a GRIN lens implanted above LMN. If LMN is visible 2 weeks after surgery, we will begin to habituate the
mouse to head fixation in our rotation apparatus. Beginning at 3 weeks, we will perform 2-photon imaging while
rotating the mouse and record action-potential evoked calcium transients in the axon terminals. GLMs will be
constructed to describe the functional properties of these projections: the STRFs of the PoS-LMN axons will be
characterized using the same methods described in Aim 1. We will look at how the firing rate of these neurons
depends on the presence of visual stimuli. In particular, we are interested to see if these axons display head
directional tuning or activity that is dependent on the particular visual stimulus being presented. We will also
look at the effect of full-field optic flow on the activity of these neurons by rotating a drum with evenly spaced
vertical bars around the mouse.
Finally, we will examine activity in the PoS-LMN projection during discrete correction events. In the
dark, we will rotate the mouse randomly while recording from either LMN neurons or PoS axons as described
above. The light will then be turned on, making landmark cues visible to the mouse. Based on the results of the
homing experiment described previously21
, we expect to observe either ‘remapping’ or ‘resetting’. Over many
trials, we can systematically examine the relationship between the degree of drift and the probability of
remapping. We hypothesize that after the lights are turned on there will be transient activity in the population
that reflects both the previous landmark reference frame and the drifted reference frame. Under the ring
attractor hypothesis, the population activity will quickly converge onto one of these reference frames. Whether
there is remapping or resetting will likely depend on the relative strength of activation of each frame, and the
difference in tuning between them8
.
If imaging from axons proves to be too difficult, these experiments could be carried out using tetrode
recordings in PoS and LMN. LMN-projecting PoS cells could be identified optogenetically: a g-protein deleted
rabies virus (RVdG) will be injected into LMN to express ChR2 in LMN-projecting neurons.
Movement artifacts could confound results if they are too extreme during rotation. Since we are imaging
subcellular structures, the effects of any movement artifacts will be amplified and may be more difficult to
correct, especially if motion occurs in the vertical axis. As in aim 1, we will perform control experiments with
tdTomato expressed in PoS-LMN axons. If movement from vestibular input proves to be problematic, we can
12. still image axons during different heading directions, the display of visual stimuli, and discrete correction
events. We can also combine sparse expression in PoS with volumetric scanning in LMN to overcome this
problem. By imaging fewer axons within a volume, motion in any of the three axes should be able to be
corrected with image correction algorithms.
Aim 3: Test for connectivity profiles within the integrator network.
Although the inter-regional connectivity of the HD system has been characterized, no studies have examined
local connectivity within LMN. Only one study has examined the morphology of Golgi-stained LMN neurons, in
which the authors found no evidence of local axon collaterals35
. Researchers have cited this as evidence that
LMN does not contain the recurrent excitation required for the classical implementation of a ring attractor8,34
.
Subsequently, models for vestibular integration have been developed that are compatible with LMN being a
feedforward nucleus with no recurrent connectivity8,9
. Figure 3 illustrates these two models, which will be
referred to as Model 1 (recurrent excitation) and Model 2 (distributed, inhibitory attractor). There have been no
studies to-date that have managed to distinguish between Model 1 and Model 2. The goal of this aim is to
apply modern mouse genetic and viral tracing tools to test specific anatomical predictions of each of these two
classes of models.
Traditional methods for circuit tracing in the head direction system, such as choleratoxin-B (CTB) and
horseradish peroxidase (HRP), have been successful at revealing long-distance connectivity between
areas33,35
. For example, CTB injections into LMN and ADN have revealed distinct populations of neurons in
PoS that project to each of these areas. However, these tools are not suitable for dissecting local and cell-type
specific circuits, since injection sites tend to be on the order of hundreds of microns wide and the tracer is
taken up by all types of neurons and passing axons within this radius. We will use a Cre transgenic line which
labels LMN in conjunction with rabies virus (RV) trans-synaptic tracing to probe the organization of inputs onto
LMN neurons and to distinguish between recurrent and feed-forward models of LMN.
As mentioned previously, we have identified a genetic label of LMN neurons that is not present in the
surrounding tissue: expression of the neuropeptide Tac210
. Since this line has never been characterized for the
purposes of labeling LMN, we will first carry out experiments and analyses to see if there are any consistent
functional or anatomical differences between Tac2 and non-Tac2 expressing neurons within LMN. Based on
the Allen Atlas ISH data (Figure 8), we expect Tac2-cre to label a relatively high percentage of the total number
of neurons within LMN. Characterization experiments will include looking at fraction of neurons retrogradely
labeled from different brain regions, and whether GFP-expressing Tac2 neurons have targets that are
consistent with the known anatomy of LMN projections. This characterization will reveal any biases that might
exists in the population of neurons that we are labeling and improve the interpretability of subsequent results
obtained using this line.
We will first test a key component of model 1: that LMN contains
recurrent excitation. We will perform transynaptic viral tracing from ADN
to see if ADN-projecting LMN neurons get local input. Figure 8
illustrates the basic logic and timeline of this experiment. We will inject
two helper AAV viruses into LMN that express proteins in a Cre-
dependent manner: CAG-FLEx-TVA66T-mCherry and CAG-FLEx-G51
.
CAG-FLEx-TVA66T-mCherry expresses a mutant form of the receptor
for EnvA, a coat protein for an avian virus, linked to the red fluorophore
mCherry. CAG-FLEx-G expresses the rabies virus glycoprotein (RVGP)
that is necessary for transynaptic infection of RV. After 2 weeks, an
EnvA-pseudotyped rabies virus with deleted G-protein and expressing
GFP will be injected into ADN. This RV can only enter cells that express
the TVA receptor, so only Cre+ neurons in LMN that project to ADN will
be infected. If these neurons also happen to express the g-protein,
rabies virus can be transported to their presynaptic partners. Figure 8
illustrates two possible outcomes of this experiment. Any cells
expressing only GFP and not mCherry must have been labeled through
transynaptic tracing from the TVA-expressing starter cells. Finding
GFP+/mCherry- cells within LMN would prove that there is recurrent
local connectivity.
Next, we will focus on testing predictions of model 2. The basic
circuit in this model is shown in Figure 3. Model 2 predicts that LMN-
13. >DTN neurons are head direction cells and receive inhibitory input from DTN. We will employ a similar viral
tracing approach to test some of these predictions. First, we will inject the two helper AAVs into LMN of Tac2-
cre mice, exactly as described in the previous experiment. After two weeks, an EnvA-pseudotyped rabies virus
with deleted G-protein and expressing GFP will be injected into DTN. TVA+ LMN->DTN neurons will be
infected with the virus. If these also express the glycoprotein, virus will be transported to presynaptic partners.
If there is reciprocal connectivity between LMN and DTN, we expect to see GFP+ DTN neurons. If LMN->DTN
cells are head direction cells, as model 2 predicts, we also expect them to project to ADN, since ADN inherits
its head direction information from LMN. We will therefore also look for the presence of axons in ADN that are
GFP+ and mCherry+.
Recently, similar rabies-virus tracing approaches have been successfully applied to mapping local and
long-range projections51
. One potential pitfall in our approach is that Tac2 may only be expressed in a specific
subset of LMN neurons that are biased in their functional properties and/or anatomy. If this is the case, we can
still carry out experiments in a non Cre-dependent manner. Since the genes delivered by the helper AAVs
would be expressed more broadly, limited only by the precision of our injection site, additional control
experiments would need to be carried out, such as making sure that starter cells are only present in LMN and
not in any areas that LMN or DTN project to.
The results of these experiments will not allow us to conclusively accept either model as the
mechanism for head direction cell generation: if there is local connectivity both models are still valid. Taken
together, however, they will provide a much-needed understanding of the microanatomy of the angular velocity
integrator. These types of circuit-level analyses are needed to test longstanding predictions about how the
head direction signal is generated and to guide future model development.
Appendix 1: Figure references
Figure 1. 52 53 1 37
Figure 2: 32 14 25 22 15
Figure 3: 11 3 8 9
Figure 8: 51 10
Bibliography
1 Taube, J. S., Muller, R. U. & Ranck, J. B. Head-direction cells recorded from the postsubiculum in freely
moving rats. II. Effects of environmental manipulations. The Journal of neuroscience : the official journal
of the Society for Neuroscience 10, 436-447 (1990).
2 McNaughton, B. L., Chen, L. L. & Markus, E. J. "Dead reckoning," landmark learning, and the sense of
direction: a neurophysiological and computational hypothesis. Journal of cognitive neuroscience 3, 190-
202, doi:10.1162/jocn.1991.3.2.190 (1991).
3 Zhang, K. Representation of spatial orientation by the intrinsic dynamics of the head-direction cell
ensemble: a theory. The Journal of neuroscience : the official journal of the Society for Neuroscience
16, 2112-2126 (1996).
4 Taube, J. S. The head direction signal: origins and sensory-motor integration. Annual review of
neuroscience 30, 181-207, doi:10.1146/annurev.neuro.29.051605.112854 (2007).
5 Goodridge, J. P., Dudchenko, P. A., Worboys, K. A., Golob, E. J. & Taube, J. S. Cue control and head
direction cells. Behav Neurosci 112, 749-761 (1998).
6 Park, I. M., Meister, M. L., Huk, A. C. & Pillow, J. W. Encoding and decoding in parietal cortex during
sensorimotor decision-making. Nature neuroscience 17, 1395-1403, doi:10.1038/nn.3800 (2014).
7 Yoder, R. M., Peck, J. R. & Taube, J. S. Visual landmark information gains control of the head direction
signal at the lateral mammillary nuclei. The Journal of neuroscience : the official journal of the Society
for Neuroscience 35, 1354-1367, doi:10.1523/JNEUROSCI.1418-14.2015 (2015).
8 Song, P. & Wang, X.-J. J. Angular path integration by moving "hill of activity": a spiking neuron model
without recurrent excitation of the head-direction system. The Journal of neuroscience : the official
journal of the Society for Neuroscience 25, 1002-1014, doi:10.1523/JNEUROSCI.4172-04.2005 (2005).
14. 9 Christian, B., Nicolas, B. & Angelo, A. A Continuous Attractor Network Model Without Recurrent
Excitation: Maintenance and Integration in the Head Direction Cell System. Journal of Computational
Neuroscience 18, 205-227, doi:10.1007/s10827-005-6559-y (2005).
10 Mar, L., Yang, F. C. & Ma, Q. Genetic marking and characterization of Tac2-expressing neurons in the
central and peripheral nervous system. Mol Brain 5, 3, doi:10.1186/1756-6606-5-3 (2012).
11 Bruce, L. M., Francesco, P. B., Ole, J., Edvard, I. M. & May-Britt, M. Path integration and the neural
basis of the 'cognitive map'. Nature Reviews Neuroscience 7, 663-678, doi:10.1038/nrn1932 (2006).
12 Edvard, I. M., Emilio, K. & May-Britt, M. Place Cells, Grid Cells, and the Brain's Spatial Representation
System. Neuroscience 31, 69-89, doi:10.1146/annurev.neuro.31.061307.090723 (2008).
13 Hafting, T., Fyhn, M., Molden, S., Moser, M.-B. B. & Moser, E. I. Microstructure of a spatial map in the
entorhinal cortex. Nature 436, 801-806, doi:10.1038/nature03721 (2005).
14 Taube, J. S. & Bassett, J. P. Persistent neural activity in head direction cells. Cerebral cortex (New
York, N.Y. : 1991) 13, 1162-1172 (2003).
15 Taube, J. S. Head direction cells and the neurophysiological basis for a sense of direction. Progress in
neurobiology 55, 225-256, doi:10.1016/S0301-0082(98)00004-5 (1998).
16 Stackman, R. W. & Taube, J. S. Firing properties of rat lateral mammillary single units: head direction,
head pitch, and angular head velocity. The Journal of neuroscience : the official journal of the Society
for Neuroscience 18, 9020-9037 (1998).
17 Stackman, R. W. & Taube, J. S. Firing properties of head direction cells in the rat anterior thalamic
nucleus: dependence on vestibular input. The Journal of neuroscience : the official journal of the
Society for Neuroscience 17, 4349-4358 (1997).
18 Taube, J. S. & Burton, H. L. Head direction cell activity monitored in a novel environment and during a
cue conflict situation. Journal of Neurophysiology (1995).
19 Blair, H. T. & Sharp, P. E. Visual and vestibular influences on head-direction cells in the anterior
thalamus of the rat. Behav Neurosci 110, 643-660 (1996).
20 Peyrache, A., Lacroix, M. M., Petersen, P. C. & Buzsáki, G. Internally organized mechanisms of the
head direction sense. Nature neuroscience 18, 569-575, doi:10.1038/nn.3968 (2015).
21 Valerio, S. & Taube, J. S. Path integration: how the head direction signal maintains and corrects spatial
orientation. Nature neuroscience 15, 1445-1453, doi:10.1038/nn.3215 (2012).
22 Clark, B. J. & Taube, J. S. Vestibular and attractor network basis of the head direction cell signal in
subcortical circuits. Frontiers in neural circuits 6, 7, doi:10.3389/fncir.2012.00007 (2012).
23 Stackman, R. W., Golob, E. J., Bassett, J. P. & Taube, J. S. Passive transport disrupts directional path
integration by rat head direction cells. Journal of neurophysiology 90, 2862-2874,
doi:10.1152/jn.00346.2003 (2003).
24 Shinder, M. E. & Taube, J. S. Resolving the active versus passive conundrum for head direction cells.
Neuroscience 270, 123-138, doi:10.1016/j.neuroscience.2014.03.053 (2014).
25 Yoder, R. M. & Taube, J. S. The vestibular contribution to the head direction signal and navigation.
Frontiers in integrative neuroscience 8, 32, doi:10.3389/fnint.2014.00032 (2014).
26 Clark, B. J., Brown, J. E. & Taube, J. S. Head direction cell activity in the anterodorsal thalamus
requires intact supragenual nuclei. Journal of neurophysiology 108, 2767-2784,
doi:10.1152/jn.00295.2012 (2012).
27 Valerio, S. & Taube, J. S. Head Direction Cell Activity Is Absent in Mice without the Horizontal
Semicircular Canals. The Journal of neuroscience : the official journal of the Society for Neuroscience
36, 741-754, doi:10.1523/JNEUROSCI.3790-14.2016 (2016).
28 Bassett, J. P., Tullman, M. L. & Taube, J. S. Lesions of the tegmentomammillary circuit in the head
direction system disrupt the head direction signal in the anterior thalamus. The Journal of neuroscience
: the official journal of the Society for Neuroscience 27, 7564-7577, doi:10.1523/JNEUROSCI.0268-
07.2007 (2007).
29 Goodridge, J. P. & Taube, J. S. Interaction between the postsubiculum and anterior thalamus in the
generation of head direction cell activity. The Journal of neuroscience : the official journal of the Society
for Neuroscience 17, 9315-9330 (1997).
30 Clark, B. J., Bassett, J. P., Wang, S. S. & Taube, J. S. Impaired head direction cell representation in the
anterodorsal thalamus after lesions of the retrosplenial cortex. The Journal of neuroscience : the official
journal of the Society for Neuroscience 30, 5289-5302, doi:10.1523/JNEUROSCI.3380-09.2010 (2010).
31 Bassett, J. P. et al. Passive movements of the head do not abolish anticipatory firing properties of head
direction cells. Journal of neurophysiology 93, 1304-1316, doi:10.1152/jn.00490.2004 (2005).
15. 32 Dumont, J. R. & Taube, J. S. The neural correlates of navigation beyond the hippocampus. Progress in
brain research 219, 83-102, doi:10.1016/bs.pbr.2015.03.004 (2015).
33 Yoder, R. M. & Taube, J. S. Projections to the anterodorsal thalamus and lateral mammillary nuclei
arise from different cell populations within the postsubiculum: implications for the control of head
direction cells. Hippocampus 21, 1062-1073, doi:10.1002/hipo.20820 (2011).
34 Knierim, J. J. & Zhang, K. Attractor dynamics of spatially correlated neural activity in the limbic system.
Annual review of neuroscience 35, 267-285, doi:10.1146/annurev-neuro-062111-150351 (2012).
35 Allen, G. V. & Hopkins, D. A. Mamillary body in the rat: topography and synaptology of projections from
the subicular complex, prefrontal cortex, and midbrain tegmentum. J Comp Neurol 286, 311-336,
doi:10.1002/cne.902860303 (1989).
36 Sharp, P. E., Tinkelman, A. & Cho, J. Angular velocity and head direction signals recorded from the
dorsal tegmental nucleus of gudden in the rat: implications for path integration in the head direction cell
circuit. Behavioral neuroscience 115, 571-588 (2001).
37 Bassett, J. P. & Taube, J. S. Neural correlates for angular head velocity in the rat dorsal tegmental
nucleus. The Journal of neuroscience : the official journal of the Society for Neuroscience 21, 5740-
5751 (2001).
38 Chen, T.-W. W. et al. Ultrasensitive fluorescent proteins for imaging neuronal activity. Nature 499, 295-
300, doi:10.1038/nature12354 (2013).
39 Robert, B. & Mark, J. S. In Vivo Optical Microendoscopy for Imaging Cells Lying Deep within Live
Tissue. Cold Spring Harbor Protocols 2012, doi:10.1101/pdb.top071464 (2012).
40 Goldman-Rakic, P. S. Cellular basis of working memory. Neuron 14, 477-485 (1995).
41 Salinas, E. & Abbott, L. F. A model of multiplicative neural responses in parietal cortex. Proc Natl Acad
Sci U S A 93, 11956-11961 (1996).
42 Ben-Yishai, R., Bar-Or, R. L. & Sompolinsky, H. Theory of orientation tuning in visual cortex. Proc Natl
Acad Sci U S A 92, 3844-3848 (1995).
43 Hahnloser, R. H., Sarpeshkar, R., Mahowald, M. A., Douglas, R. J. & Seung, H. S. Digital selection and
analogue amplification coexist in a cortex-inspired silicon circuit. Nature 405, 947-951,
doi:10.1038/35016072 (2000).
44 Blair, H. T., Cho, J. & Sharp, P. E. Role of the lateral mammillary nucleus in the rat head direction
circuit: a combined single unit recording and lesion study. Neuron 21, 1387-1397 (1998).
45 Blasiak, T., Czubak, W., Ignaciak, A. & Lewandowski, M. H. A new approach to detection of the bregma
point on the rat skull. J Neurosci Methods 185, 199-203, doi:10.1016/j.jneumeth.2009.09.022 (2010).
46 Bocarsly, M. E. et al. Minimally invasive microendoscopy system for in vivo functional imaging of deep
nuclei in the mouse brain. Biomed Opt Express 6, 4546-4556, doi:10.1364/BOE.6.004546 (2015).
47 Voigts, J., Siegle, J. H., Pritchett, D. L. & Moore, C. I. The flexDrive: an ultra-light implant for optical
control and highly parallel chronic recording of neuronal ensembles in freely moving mice. Front Syst
Neurosci 7, 8, doi:10.3389/fnsys.2013.00008 (2013).
48 Aronov, D. & Tank, D. W. Engagement of neural circuits underlying 2D spatial navigation in a rodent
virtual reality system. Neuron 84, 442-456, doi:10.1016/j.neuron.2014.08.042 (2014).
49 Winter, S. S., Clark, B. J. & Taube, J. S. Spatial navigation. Disruption of the head direction cell network
impairs the parahippocampal grid cell signal. Science (New York, N.Y.) 347, 870-874,
doi:10.1126/science.1259591 (2015).
50 Heys, J. G., Rangarajan, K. V. & Dombeck, D. A. The functional micro-organization of grid cells
revealed by cellular-resolution imaging. Neuron 84, 1079-1090, doi:10.1016/j.neuron.2014.10.048
(2014).
51 DeNardo, L. A., Berns, D. S., DeLoach, K. & Luo, L. Connectivity of mouse somatosensory and
prefrontal cortex examined with trans-synaptic tracing. Nature neuroscience 18, 1687-1697,
doi:10.1038/nn.4131 (2015).
52 Derdikman, D. & Moser, E. I. A manifold of spatial maps in the brain. Trends Cogn Sci 14, 561-569,
doi:10.1016/j.tics.2010.09.004 (2010).
53 Stensola, H. et al. The entorhinal grid map is discretized. Nature 492, 72-78, doi:10.1038/nature11649
(2012).