Compensation modelling stages for performance appraisal
•Download as DOCX, PDF•
2 likes•391 views

Compensation modelling for performance appraisal To understand the process/ logic/ science/ maths behind the various numbers that keep floating around during performance appraisal, eg why is the increment/ variable pay X%?
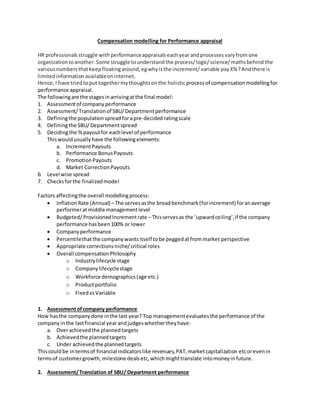
![The nextstage is to identifythe performanceof the variousdepartments.Once the company
performance isfixated,the SBU/Departments are ratedrelative to(above orbelow) the company
performance.
How haseach SBU/ Departmentfaredinthe overall scheme of things?Have some done betterthan
expected,Have some notbeenable tomeettheirtargets.
For departmentslikesales,marketing etc,it’dbe easytomeasure as theirtargetsare fairlyobjective
while forbackendfunctionslike finance,HR,Adminetcit’dbe slightlydifficulttomeasure astheir
targetsare quite subjective innature.
3. Definingthe populationspread for a pre-decidedratingscale (usually5 point)
Each & everyindividualhascontributedtothe overall growthof the company.But,some would have
done betterthanothers.
Thenwe try to segregate the entire population, basisthe performance.Thisisdone topromote a
performance/meritbasedculture.
The usual distributionisa‘normal curve’.An ‘exactlynormal’curve hasnoskew eg, equal numberof
people intop& bottomcategory (egA & E or B & D). [Here were assumingthe scale toa 5 pointfromA
to E, A beingthe highestratingandE beingthe lowestone.]
The peak of thiscurve is highas illustratedinscenario1.Thismeansthatthe difference inincrementfor
A to B wouldbe fairlyhigh.
To reduce the differential,we spreadthe populationtoreduce the peak,asillustratedinscenario2.
In reality,the curve is‘approximatelynormal’ andskewed,usuallynegatively,asillustratedinscenario3.
Ratings Ideal spread
(High peak)
Curve to
reduce peak
Company
performance curve
A 5 5 5
B 10 15 25
C 70 60 40
D 10 15 20
E 5 5 10](data:image/gif;base64,R0lGODlhAQABAIAAAAAAAP///yH5BAEAAAAALAAAAAABAAEAAAIBRAA7)
Recommended
Recommended
More Related Content
What's hot
What's hot (10)
Similar to Compensation modelling stages for performance appraisal
Similar to Compensation modelling stages for performance appraisal (20)
Recently uploaded
Recently uploaded (14)
Compensation modelling stages for performance appraisal
- 1. Compensation modelling for Performance appraisal HR professionalsstruggle with performanceappraisalseachyearandprocessesvaryfrom one organizationtoanother. Some struggle tounderstandthe process/logic/science/mathsbehind the variousnumbersthatkeepfloatingaround,egwhyisthe increment/variable payX%?Andthere is limitedinformationavailableoninternet. Hence,I have triedtoput togethermythoughtson the holisticprocessof compensationmodellingfor performance appraisal. The followingare the stagesinarrivingatthe final model: 1. Assessmentof companyperformance 2. Assessment/Translationof SBU/Departmentperformance 3. Definingthe populationspreadfor apre-decided ratingscale 4. Definingthe SBU/ Departmentspread 5. Decidingthe % payoutfor eachlevel of performance Thiswouldusuallyhave the followingelements: a. IncrementPayouts b. Performance BonusPayouts c. PromotionPayouts d. Market CorrectionPayouts 6. Level wise spread 7. Checksforthe finalizedmodel Factors affectingthe overall modellingprocess: InflationRate (Annual) –The servesasthe broadbenchmark(forincrement) foranaverage performeratmiddle managementlevel Budgeted/ProvisionedIncrementrate –Thisservesas the ‘upwardceiling’,if the company performance hasbeen100% or lower Companyperformance Percentilethatthe companywantsitself tobe peggedatfrommarket perspective Appropriate correctionsniche/critical roles Overall compensationPhilosophy o Industrylifecycle stage o Companylifecyclestage o Workforce demographics(age etc.) o Productportfolio o FixedvsVariable 1. Assessmentofcompany performance How hasthe companydone inthe last year? Top managementevaluatesthe performance of the companyinthe lastfinancial yearandjudgeswhethertheyhave: a. Overachievedthe plannedtargets b. Achievedthe plannedtargets c. Under achievedthe plannedtargets Thiscouldbe intermsof financial indicatorslike revenues,PAT,marketcapitalization etcorevenin termsof customergrowth, milestone dealsetc,whichmighttranslate intomoneyinfuture. 2. Assessment/Translation of SBU/ Department performance
- 2. The nextstage is to identifythe performanceof the variousdepartments.Once the company performance isfixated,the SBU/Departments are ratedrelative to(above orbelow) the company performance. How haseach SBU/ Departmentfaredinthe overall scheme of things?Have some done betterthan expected,Have some notbeenable tomeettheirtargets. For departmentslikesales,marketing etc,it’dbe easytomeasure as theirtargetsare fairlyobjective while forbackendfunctionslike finance,HR,Adminetcit’dbe slightlydifficulttomeasure astheir targetsare quite subjective innature. 3. Definingthe populationspread for a pre-decidedratingscale (usually5 point) Each & everyindividualhascontributedtothe overall growthof the company.But,some would have done betterthanothers. Thenwe try to segregate the entire population, basisthe performance.Thisisdone topromote a performance/meritbasedculture. The usual distributionisa‘normal curve’.An ‘exactlynormal’curve hasnoskew eg, equal numberof people intop& bottomcategory (egA & E or B & D). [Here were assumingthe scale toa 5 pointfromA to E, A beingthe highestratingandE beingthe lowestone.] The peak of thiscurve is highas illustratedinscenario1.Thismeansthatthe difference inincrementfor A to B wouldbe fairlyhigh. To reduce the differential,we spreadthe populationtoreduce the peak,asillustratedinscenario2. In reality,the curve is‘approximatelynormal’ andskewed,usuallynegatively,asillustratedinscenario3. Ratings Ideal spread (High peak) Curve to reduce peak Company performance curve A 5 5 5 B 10 15 25 C 70 60 40 D 10 15 20 E 5 5 10
- 3. The spreadis selectedheavieratB & C ratingsbecause: The intentisusually togive moneytomostof the employees (populationdensityishighestatC) It helpsinnormalization.Eg, Bcan be movedtoC and C can be movedtoD & E. 4. Definingthe SBU/ Departmentspread The above mentionedstage isrepeatedforeachSBU/ Departmenttoarrive at theirrespective populationspreads/distribution. For eachSBU/ Department,the spread/curve canbe obtainedas follows: Performance of SBU/Department< Company,the spreadshiftsleft Performance of SBU/Department = Company,the spreadremainsasitis Performance of SBU/Department > Company,the spreadshiftsright The table below demonstrates the same: SBU/ Department A B C D E Company/ Dept1 5 25 40 20 10 Dept2/ Dept3 7 27 40 18 7 Dept4 6 26 40 19 9 Dept5/ Dept6 Dept7
- 4. 5. Decidingthe % payout for each level ofperformance Thiswouldusuallyhave the followingelements: a. IncrementPayouts Assuminginflationrate is10%.The incrementof the average performer(Crating) isassumedtobe equal tothe inflationrate. Then,decidingthe %incrementforthe restof the performance ratingisa mix of ‘science & art’ SBU/ Department A B C D E Company 15% 12% 10% 8% 5% The same processisadoptedforeach SBU/ Department. b. Performance Bonus Payouts Thiscomponentisa reflectionof the lastyear’sperformance. The higheryoumove upin designations, the higheris the variable as% of CTC andvice versa. Designations↑ --->variable as%of CTC ↑ Assumingoverall company’sperformance forlastyear ispeggedat80%. The variable payoutof the average performer(Crating) isassumedtobe equal tothe company’s performance. SBU/ Department A B C D E Company 110% 95% 80% 60% 30% c. Promotion Payouts Employeeswhohave gotapromotion,are compensatedfortheirnew levels/designations. Usually,froma modellingperspective,thisisequal tothe increment%(orsome factorof it) proposedfora particular(currentNOTproposed/new) level/designation&rating. While some companiesbelieve inthisschool of thought,othersdon’t. d. Market Correction Payouts Thiselementisproposedforemployees/roleswhose salariesislessthanthe currentmarketmedian salaries. Thisinphilosophyisdone forroleswhichare critical toan organizationfromafuture road map perspective.
- 5. Thisdata can be receivedthroughreportspublishedbyleadingHRconsultancieseveryyear.The companycan get the same by participatinginsuchsurveysandwithpaymentof the appropriate fees. Companieswhichcan’taffordthese services,maygetthe understandingof the broadbenchmark salariesbymappingtheircompetitionfordesiredroles. 6. Level wise spread The higheryoumove up indesignations, the lowerthe % of incrementbecomesandvice versa. Designations↑ --->%increment↓ Thisis because the salarybase movesupas youmove up indesignations,andevenasmaller% incrementmeansasubstantial jumpinabsolute terms. SBU/ Department A B C D E SeniorManager 12% 10% 8% 5% 3% Manager 15% 12% 10% 8% 5% Executive 20% 15% 12% 10% 8% 7. Checksfor the finalizedmodel For a certainSBU/ department&designation&ratings,the currentmanpower/salarycostsare multipliedbythe respective %incrementstoarrive atthe new manpower/salarycosts. The weightedaverage of SBU’sspreadsshouldmatchwiththe companyspread. Andthe summationof the cost impactof all SBU/ Departmentsshouldaddupto that of the cost impact of the overall company. The revisedmanpower/salarycostsare withinthe budgeted/provisionedfigures. Afterthe above stepsare done,one maycontinue withthe usual processesof mappingthe individual performance ratings&associatedincrements. To summarize, compensationmodellingforperformance appraisal is alittle bitof bothscience &art. Andthe keyis to balance betweenthe two, giventhe organizationalcontext. One may wonderthatI have writtensomuch aboutbell curves,whereas several organizationsare movingawayfromthe bell curve approachforperformance appraisal.AsfarasI think, some sortof a categorizationof employeeswouldalways continue to exist. Ithink,the keyistokeepthe bell curve ‘flexible’ ¬rigid.