SlideShare a Scribd company logo
1 of 109
Download to read offline
I
Tysons Premier Urban district
Our redevelopment vision for Pike 7 Plaza is to
transform the existing strip center into “Parc Seven,”
a premier transit oriented mixed-use development
located in the heart of Tysons Corner. With the
project being steps from the new Greensboro Metro
Station, we envision Parc Seven as a destination with
an unparalleled amenity-rich environment. Our
Development Team crafted a leasing, financing, and
design plan that implements clever phasing and
design to convert the existing strip mall into a trendy
2.8 million square-foot urban Entertainment District.
It features roughly 460,000-SF of retail, 585,000-SF of
office, a 270,000-SF hotel, 563,000-SF of multifamily
rentals with an additional 151,000-SF of
condominiums, and 105,000-SF of community space.
University of Maryland
NAIOP Development Team
March 2014
LEFT BLANK INTENTIONALLY
Acknowledgements
Much appreciation and many thanks to everyone on the team who worked hard
and contributed many hours to the creation of this report and provided invaluable
insight:
Chau Pham Development Team
Aaron Loeb
Amy Weber
Ryan Smyth
Samuel Vana
Tyler Krehbiel
Taylor Cooper
Tatiana Joseph
Meghan Walsh
Timur Ryspekov
Anthony Notarfrancesco
LEFT BLANK INTENTIONALLY
TABLE OF CONTENTS
I. Project Summary.................................................................................................... 8
Strategy...............................................................................................................................................................10
Site Plan ..............................................................................................................................................................11
II. Site Analysis ..........................................................................................................12
Location...............................................................................................................................................................12
Traffic and Mobility..........................................................................................................................................12
Zoning/Regulatory Conditions.......................................................................................................................14
Community Interests .......................................................................................................................................14
III. Development Plan and Design ..............................................................................15
Traffic, Circulation and Parking .....................................................................................................................15
Architecture and Landscape...........................................................................................................................19
LEED .....................................................................................................................................................................21
IV. Market Analysis.................................................................................................... 22
National Economy.............................................................................................................................................22
Local Conditions................................................................................................................................................22
Market Overview..............................................................................................................................................26
Market.................................................................................................................................................................27
Office Market ....................................................................................................................................................................27
Retail Market.....................................................................................................................................................................29
Housing Market ................................................................................................................................................................31
Hotel Market .....................................................................................................................................................................34
Civic Center........................................................................................................................................................................34
V. Financial Analysis ................................................................................................. 36
Introduction .......................................................................................................................................................36
Acquisitions........................................................................................................................................................36
Assumptions.......................................................................................................................................................37
Phasing................................................................................................................................................................54
Phase I.................................................................................................................................................................................55
Phase II................................................................................................................................................................................56
Phase III...............................................................................................................................................................................57
Phase IV ..............................................................................................................................................................................58
Project Schedule ...............................................................................................................................................59
VI. Appendices........................................................................................................... 60
I. Team Members........................................................................................................................................60
II. Site Analysis Supplement ...................................................................................................................62
III. Design Supplement..............................................................................................................................64
IV. Market Supplement.............................................................................................................................70
V. Financial Supplement..........................................................................................................................72
VII. Faculty Advisor....................................................................................................................................108
VIII. Consultants..........................................................................................................................................109
LEFT BLANK INTENTIONALLY
UNIVERSITY OF MARYLAND
Colvin Institute of Real Estate Development
School of Architecture, Planning & Preservation
The 2014 NAIOP Capital Challenge
Maryland/DC Intercollegiate Real Estate Case Competition
8 UNIVERSITY OF MARYLAND
PROJECT SUMMARY
Being Located in Tysons Corner, Virginia; Parc Seven will be an exciting transit oriented mixed-use development,
abutted by the new Silver Line Metro Station known as Greensboro. Envisioning a destination with an
unparalleled amenity-rich environment, our Development Team crafted a leasing, financing, and design plan that
implements clever phasing and design to convert the existing strip mall into a 2.8 million square-foot urban
district. This new development will contain 6 individual blocks that will support a mixture of office, retail,
entertainment, civic, and living options. Parc Seven features roughly 460,000-SF of retail, 585,000-SF of office, a
270,000-SF hotel, 563,000-SF of multifamily rentals with an additional 151,000-SF of condominiums, 47,000-SF
of community civic space, and nearly 60,000-SF of open space that includes; an urban plaza designated by a
grand arch connecting Parc Seven users to the metro, a large outdoor park that will support events and provide
outdoor seating to our premier food market and open-air cafés. Rapidly transforming Tysons Corner and our
project will appeal to the next generation of office users and residents who prefer mass transit and an amenity
rich urban lifestyles.
Total Development Costs $685,839,146 ($240.88 PSF)
Total Equity $240,043,701 (35%)
Total Debt $445,795,445 (65%)
Project Program 2,864,529 GSF
Retail 254,473 GSF
Entertainment 204,200 GSF
Office 584,846 GSF
Hotel (250-Key) 270,738 GSF (750-SF per room)
Residential – Rental 562,739 GSF (550 Units)
Condominiums 150,983 GSF (120 units)
Civic Space 46,831 GSF
Park Space 24,000 GSF
Urban Plaza 33,443 GSF
Subterranean Gallery Walk 17,300 GSF
Infrastructure 200,653 GSF
Parking 514,123 GSF (2,116 Spaces)
Overall Project Construction Timeline 129 Months (10 years, 3 months)
Phasing Four Phases (5-years each)
Start Preconstruction July 2014
Project Delivery March 2025
Loan Request $445,795,445
Requested Terms 65% LTV, 5.25%, 25-yr term, non-recourse, 1.25 DCR
Investor Returns Entire Project
After-Tax Sale Proceeds (Yr-10) $605,976,130
Leveraged ATCF IRR 25.52%
Leveraged BTCF IRR 27.07%
Unleveraged ATCF IRR 19.39%
Profit (Yr-1) $52,661,104
ROI (1st
Full Year) 21.9%
TOTAL PROJECT BREAKDOWN
9 UNIVERSITY OF MARYLAND
Phase I (Block “C”)
Total Development $93,262,041 ($240.88 PSF)
Total Equity $32,641,714 (35%)
Total Debt $60,620,326 (65%)
Use Program 394,994 GSF
Office 355,566
Retail 11,149
Parking 27,619 (114 spaces)
Construction Timeline 52 Months (5-years)
Start Preconstruction July 2014
Construction January 2015
Lease-up Start June 2016
Delivery May 2019
.
Investor Returns
After-Tax Sale (Yr-10) $135,066,502
Leveraged BTCF IRR 22.20%
Leveraged ATCF IRR 18.94%
Unleveraged ATCF IRR 14.58%
Profit (Yr-1) $4,089,717
Phase III (Block “D”,”E” & “F”)
Total Development $93,262,041 ($240.88 PSF)
Total Equity $32,641,714 (35%)
Total Debt $60,620,326 (65%)
Use Program 1,135,404 GSF
Condominiums 150,983 (120 units)
Apartments 562,739 (550 units)
Retail 164,505
Parking 257,177 (1,058 spaces)
Construction Timeline 52 Months (5-years)
Start Preconstruction July 2018
Construction January 2020
Lease-up Start April 2021
Delivery March 2023
Investor Returns
After-Tax Sale (Yr-10) $325,217,966
Leveraged BTCF IRR 19.72%
Leveraged ATCF IRR 14.27%
Unleveraged ATCF IRR 10.71%
Profit (Yr-1) $4,547,107
Phase II (Block “B” & demo “A” & “F” for parking)
Total Development $93,262,041 ($240.88 PSF)
Total Equity $32,641,714 (35%)
Total Debt $60,620,326 (65%)
Use Program 778,404 GSF
Office 229,280
Retail 119,310
Hotel 270,738 (250 Key)
Parking 27,619 (655 spaces)
Construction Timeline 52 Months (5-years)
Start Preconstruction July 2016
Construction January 2018
Lease-up Start May 2019
Delivery April 2021
Investor Returns
After-Tax Sale (Yr-10) $213,555,321
Leveraged BTCF IRR 19.89%
Leveraged ATCF IRR 16.37%
Unleveraged ATCF IRR 31.39%
Profit (Yr-1) $5,986,521
Phase IV (Block “A”)
Total Development $93,262,041 ($240.88 PSF)
Total Equity $32,641,714 (35%)
Total Debt $60,620,326 (65%)
Use Program 280,987 GSF
Civic 46,831
Retail 163,909
Parking 70,247 (289 spaces)
Construction Timeline 52 Months (5-years)
Start Preconstruction June 2020
Construction January 2022
Lease-up Start April 2023
Delivery March 2025
Investor Returns
After-Tax Sale (Yr-10) $83,864,507
Leveraged BTCF IRR 23.06%
Leveraged ATCF IRR 14.71%
Unleveraged ATCF IRR 29.28%
Profit (Yr-1) $2,124,458
PROJECT PHASING BREAKDOWN
10 UNIVERSITY OF MARYLAND
STRATEGY
Unique to Our Project:
 Phased site development plan crafted to mitigate risk and breakdown project into financially
independent subdivided blocks that allow for market driven fluidity in use programming
 Strategic phasing enables property to generate operating income over 5½-year period totaling about
$25m
 Robust development plan delivers high density which creates critical mass to ensure our specialized
mix of uses are activated
 Active 24/7 environment
 Pedestrian-focused infrastructure that promotes traffic calming and walkability
 Unique architectural features lend to the sites placemaking and character by capitalizing on our sites
unique features and frame view corridors (the “Parc Seven Archway", main project gateway, urban
plazas, and unique art installations)
 The 47,000-SF “Tetrault Science and Learning Center” will serve as a destination for Northern
Virginia’s new Science Center, IMAX Theater, and public exhibition space.
 The 17,300-SF “Grove Market” provides local healthy food options to fill void in market and create a
strong draw within the community
 The 17,000-SF subterranean “Gallery Walk” will exhibit year-round art installations, artisan markets,
and community events that provide a cultural draw
 Phased urban retail strategy integrating a focused merchant offering that will support a mix of
national and local retailers at the “Shoppes at Parc Seven”
 Will become Tyson’s premier “Entertainment District” featuring over 200,000-SF of offerings
 Class-A office with close proximity to a variety of retail, public spaces, housing, and entertainment
options with accessibility to metro will draw the next generation of high-tech office users
 200-Key Luxury Boutique Hotel — a perfect marriage between design, art, and technology
Our site’s proximity to the metro is a catalyst for high density transit-oriented development (TOD) to replace
the currently underutilized suburban retail center. Our strategy is to reposition the site into an
Entertainment District with a dense urban retail core surrounded by complementary secondary uses such as
multifamily rentals, condos, class-A office, a boutique hotel, and attractive public space. The combination of
metro access, expressive architecture, vibrant retail, tech friendly office, stylish hotel and a new science
center are the elements that make Parc Seven unique among other existing and proposed developments in
Tysons Corner.
11 UNIVERSITY OF MARYLAND
SITE PLAN
Figure 1.1 - Proposed Conceptual Site Plan for Parc Seven and Designated Blocks.
Figure 1.2 - Proposed Phasing Plan.
Phase One – Office, Parc Seven Archway,
Retail, & Parking
Phase Two – Office, Retail, Entertainment
Options, Hotel, & Parking
Phase Three – Apartments, Condos, Retail,
Road Infrastructure, Grove Market,
Subterranean Gallery Walk, & Parking
Phase Four – Tetrault Civic Center, Retail, &
Parking
12 UNIVERSITY OF MARYLAND
SITE ANALYSIS
LOCATION
The property, Pike 7 Plaza is located in the southern portion of the Tysons Central District. The address, 8350
Leesburg Pike, Vienna Virginia, is at the intersection of Leesburg Pike and Gosnell Road (Figure 1). It is less
than a mile from Tysons Galleria, and within one fourth of a mile of the new Greensboro Metro Station on
the Silver Line. Pike 7 Plaza is 12.8 acres, and currently holds a suburban retail center, facing Leesburg Pike.
To the west of the site are residential neighborhoods and to the northeast and southwest are retail uses.
Figure 1.3 Map locating project site. Image Source Underlay: Google Maps.
TRAFFIC AND MOBILITY
Leesburg Pike is the primary roadway providing vehicular access to the site. It connects to the Capital
Beltway I-495 and the greater Washington Metropolitan Area, and to the Dulles Access Road 267 which leads
to the Dulles International Airport. It is also convenient to I-66 which links to Arlington and Washington, D.C.
on the east and Fairfax on the west.
The secondary access to the site is via Gosnell Street, which intersects Route 123 and Westpark Drive linking
to the Tysons Galleria. From Dulles Toll Road to Tysons Corner, Leesburg Pike has an Average Daily Traffic
(ADT) count of 61,000 automobile trips. This high ADT count makes this site desirable. However, the steep
topography blocks much of the retails’ visibility from the road (Figure 4). The majority of the site is blocked by
the highway and cannot be seen easily from vehicles going north on Leesburg Pike (Figure 6). There is better
visibility for vehicles driving southward, which is why acquiring the plot of land in the northern corner is
13 UNIVERSITY OF MARYLAND
essential. This lot will allow us to place an architecturally unique landmark, the STEM Civic Center, on the
north-most corner of the site to capture the attention to the site. The corner must be treated as a vehicular
landmark/gateway for drivers.
Figure 4. View 1 from Leesburg Pike driving north.
Figure 6. View 2 from Leesburg driving south.
The southeast corner of the site is closest to the Greensboro metro station, which makes it the natural
gateway for pedestrians. Residents and visitors will enter the site through an arch which is an architectural
feature of the office building above.
Tysons Corner is currently an auto-oriented suburban area. Approximately eighty percent of commuters
drive to work. Eight percent of commuters use public transportation, three percent walk and two percent use
a taxicab, motorcycle, bicycle, or other means. Our transit-oriented development will help reduce automobile
dependency and encourage multi-modal connectivity.
Figure 5. Map of site, showing vehicular movement &
viewpoints.
14 UNIVERSITY OF MARYLAND
ZONING/REGULATORY CONDITIONS
The site is currently zoned C-7 Commercial District. However, the Planned Tysons Corner Urban District or
PTC District is defined in the adopted Comprehensive Plan to implement a larger mix of uses and densities to
transform Tysons from a suburban office park into an urban, mixed-use, transit oriented, bicycle and
pedestrian oriented community. We plan to rezone the property and have accounted for this additional
lead-time in the project schedule.
Parc Seven is structured to take advantage of this new zoning district that encourages the highest densities
closest to the transit station. The site is located within one-quarter mile of the station, informing our strategy
for development. Block C, the closest to the Metro, will be a 355,570 sf, 16 story office tower. Moving north
on Leesburg Pike will be an 11-story hotel, attached to a 10-story office building (Building B), and a 4 story
civic center (Building A). The southern portion of the site includes Building F, 8 stories of condominiums.
Buildings E and D are apartment buildings at 8 and 6 stories, respectively.
COMMUNITY INTERESTS
The community of Tysons Corner would like to see a transformation of the region. It is currently dominated
by the car and very suburban in nature. There is a push to create more walkability and a grid of streets. The
anticipation of Metro has been a driver for this type of development. There is support from the community to
increase the amount of green space and utilize public transportation as a means of travel.
Tysons Corner is seeing a mix of uses and an increase in density. The Board of Supervisors in Fairfax County
suggested that the sub district of our proposed development would be ideal for a museum or other arts and
education related use. Our development plan is in line with these interests and addresses the goals of the
community for the future of Tysons Corner. We intend to proactively engage with the community throughout
the duration of the project to ensure a mutually beneficial environment to facilitate the transformation of
Tysons Corner.
There is a drive in Tysons Corner to facilitate growth in the technology research market. By incorporating a
science and technology museum in the civic building, Parc Seven will be at the forefront of this trend. Not
only will the residents be able to lead the technology sector through research and development, but also
exhibit their work in the museum for others to discover. Exhibitions curated in the museum will be geared
towards this theme.
15 UNIVERSITY OF MARYLAND
DEVELOPMENT PLAN AND DESIGN
TRAFFIC, CIRCULATION AND PARKING
Overview
Our proposed development for Parc Seven will increase density, which will stimulate property values in the
surrounding areas. Taking advantage of this increased value can create enough revenue to pay for the entire
projects infrastructure improvements.1
Economic analysis shows that introducing high levels of residences
into the heart of “Edge Cities”, like Parc Seven, can create balanced lively communities that actually
experience reduced traffic congestion. Our community can generate added wealth that supports a wide
variety of amenities and activities including; an upgraded sensitively designed transit system.2
Parc Seven has
good auto access but no residents and amenities other than retail. To balance the flow in and out of the
project throughout the day; residential units, office, entertainment options, hotel, public gathering space and
placemaking elements should be added. This will add more transit riders throughout the day and ultimately
reduce dependence on the automobile with the opening of Greensboro Station.3
If implemented correctly,
this development can pay for future public improvements.
Traffic
The primary access to Pike 7 Plaza is Leesburg Pike, which connects to the Capital Beltway I-495. Leesburg
Pike also intersects with Dulles Access Road 267 which leads to the Dulles International Airport. Connections
to Arlington, Washington, D.C., and Fairfax is also possible via I-66. The secondary access to the site occurs
from Gosnell Street entering from behind the site.
Circulation
Visitors driving to the site will arrive southward on Leesburg Pike, while those who arrive via the metro will
arrive northward from Greensboro Metro station. Pedestrians and vehicles may also enter the site from
Gosnell Street. In line with the Fairfax County Comprehensive Plan, the proposed development has additional
roadways to increase the network of streets. Figure 8 shows a diagram comparing the current circulation
network to the proposed network. Dividing the site into six blocks allows more roads, which increases
connectivity to the larger network. The additional roads will also mitigate future traffic that occurs with new,
dense development. According to the Fairfax County Comprehensive Plan, the current service road behind
the site is planned to become an avenue. This means that the new development must also face what could
be an avenue in the future. Another road running east-west of the site is proposed as the main street of the
development, named Grove Street. This street will allow vehicular access in both directions, along with bike
lanes. Street parking will be on both sides to act as a buffer between pedestrians and vehicles. To alleviate
traffic into the site, there will be three other access roads from Leesburg Pike. Individuals may also enter
from the proposed avenue behind the site.
1
Tysons Corner Collaborative. “Taming Tysons Corner – Transforming the Quintessential Edge City”, date NA.
2
Tysons Corner Collaborative. “Taming Tysons Corner – Transforming the Quintessential Edge City”, date NA.
3
Tysons Corner Collaborative. “Taming Tysons Corner – Transforming the Quintessential Edge City”, date NA.
16 UNIVERSITY OF MARYLAND
Figure 1. The current circulation network vs. the proposed network.
Mass Transit
The development of Parc Seven will raise demand for arrival by mass transit. To increase the use of Metrorail
for trips to, from and within Tysons, a system of circulators is proposed in the Fairfax County Comprehensive
Plan 2013. One of the conceptual circulator routes runs through the site (Figure 2). This will conveniently
bring transit users directly to the main street of the site.
17 UNIVERSITY OF MARYLAND
Figure 2. Conceptual circulator. Source: Fairfax County Comprehensive Plan (2013).
Cyclists and Pedestrians
Pedestrian movement is paramount to the site’s success. Even though the site is considered “very walkable”
with a walk score of 77/1004, it is not pedestrian friendly. The high score is due to the site’s proximity to
resources and amenities that can be accomplished on foot. However, the site is geared towards vehicles,
lacking safe pedestrian connections to the site. The walk along Leesburg Pike is unpleasant due to the
immediacy of the sidewalk to high-speed traffic.
In the proposed development, the pedestrian network is improved with more connections. Figure 10
diagrams the proposed pedestrian pathways, which are linked to the urban plazas at both entries, as well as
the park within the development. Pedestrians coming from Greensboro Metro Station can enter through the
southern gate arch into Parc Seven, which frames a view to the public art at the traffic circle. This guides
pedestrians to Grove Street, connecting them to the park and urban plaza.
4
“Tysons corner Walk Score,” Walk Score, http://www.walkscore.com/score/8387-leesburg-pike-vienna-va-22182,
accessed February 25, 2014.
18 UNIVERSITY OF MARYLAND
Figure 3. Pedestrian movement
The allowance for wide sidewalks gives room for trees and outdoor dining, ensuring pedestrian safety and
accessibility. Grove Street has street parking to act as a buffer between pedestrians and vehicles (Appendix
II.1 - “Site Analysis Supplement”). To keep cars from speeding, the speed limit will be low. The higher
connectivity and pedestrian-friendly network will encourage higher foot traffic, which is desirable for retail
and businesses. To encourage multi-modal transportation, bicycle lanes will be designated for every road
throughout the development with connections to bike racks and storage facilities. The typical street plan
diagram illustrates a variety of street sections featured in the development (Appendix II.2 - “Site Analysis
Supplement”). Bicycle parking ratios recommended by the Fairfax Comprehensive Plan were used to
determine the amount of bike racks needed shown in Appendix II. 3 - “Site Analysis Supplement”.
Parking
To alleviate traffic, there will be parking throughout the site at almost every block. This will make it
convenient for both visitors and those who live or work in the development. The amount of parking spaces
allocated is based on the required parking ratios listed in the Fairfax County Comprehensive Plan and the
Fairfax Zoning Ordinance Article 11. The chart in Appendix II.4 - “Site Analysis Supplement” shows the
required parking ratios for the site based on its proximity to the Greensboro Metro Station in comparison
with requirements prior to the addition of the transit station. With the new metro station nearby, the public
transit proximity would be great enough to reduce expected parking needs and lower costs.
19 UNIVERSITY OF MARYLAND
With Fairfax County’s push towards lowering vehicular traffic into the area, there is currently no on-site
parking allotted for Greensboro Metro Station. When the Silver Line opens, the only station with on-site
parking lot will be Wiehle Avenue, in Reston, which will have 2,300 parking spaces. The closest station
providing parking is the McLean Metro Station, which has a privately owned interim lot that accommodates
700 vehicles. The next closest metro station with on-site parking is West Falls Church Metro Station, which
has 2,009 parking spaces and charges $4.75 per day.5
This rate will be charged for Parc Seven’s hourly rate
parking. For the residential units, the rate will be $75 per month per vehicle. Parking must be charged to
encourage people to use sustainable modes of transportation.
ARCHITECTURE AND LANDSCAPE
Design
The plan embraces a boulevard through the site in accordance with the Fairfax County Comprehensive Plan’s
proposed streets. This thoroughfare directs transit users through the southern arched threshold beneath the
office building to the retail and entertainment offerings. This design is a hybrid of smart growth urban
planning and energy-efficient architecture. The architectural features of the buildings contend with the high-
tech, trendy focus for the development.
Buildings
Each building is wrapped with a mix of national and local retailers on the first two floors. The uses work in
correlation to create harmonious daily experiences and a 24/7 environment.
Block A
The Civic Center is located at the northeastern point of the site and serves multiple functions, both in façade
design and programming. The façade is prominent and unique to serve as an icon and notable approach to
Parc Seven. The roof of the structure becomes a ramp at the ground level and invites pedestrians to the
rooftop seasonal restaurant and breathtaking views. National tenant are highly visible from Leesburg Pike,
drawing customers to the site. (See Appendix III.1 – “Tetrault Performing Arts Center Rendering”)
Block B
Parallel to Leesburg Pike, the hotel at Parc Seven accommodates 250 guest rooms. Featuring an expansive,
but technologically engineered curtain wall system, the façade of the hotel is open and light filled while
serving as noise insulation from the metro and busy road adjacent. The vibrant décor and sustainable
architecture lend an innovative, creative vibe that invites travelers and visitors to work, connect, and play.
(See Appendix III.2 – “Zetta Hotel Precedent”)
5
“West Falls Church-VT/UVA,” Washington Metropolitan Area Transit Authority, http://www.wmata.com,
(February 25, 2014).
20 UNIVERSITY OF MARYLAND
Block C
Block C celebrates an architectural quality and technology beyond the 21st
century. The southeastern
gateway is a mix of tech-savvy office and retail. This building is open to pedestrians at the ground level
featuring a voluminous 40-foot open-air, covered space surrounded by daily use retailers. Here, office users
might converse over coffee or visitors might admire the art installations. This block also features the grand
Archway into Parc Seven plaza—given the site its iconic name. This entrance was strategically designed to
greet metro riders and guide them into the project. The archway also serves to frame the view corridors into
the project and provide access to the subterranean “Grove Gallery Walk” (III.5 – Renderings of “Parc Seven
Archway Entrance into the Project”).
Blocks D and E
Situated the furthest from Leesburg Pike, these residential buildings take full advantage of the privacy with
large windows to the courtyards. Both buildings are lifted on a podium of retail, creating an elevated outdoor
terrace for the residents. The massing of the two buildings is carved to accommodate the open air Grove
Market and plaza space, allowing the Grove Market vendors to spill out on the plaza space for entertainment
and community events. The high-end fitness center is strategically placed at the corner of Gosnell Road and
Grove Street. Due to its location, the fitness center is also provided the opportunity to offer highly visible
classes on the plaza space. (Appendix III.3 – “Grove Market and Apartment Rendering). Also being installed
on this block is the entrance to the subterranean artist Gallery, “The Grove Gallery Walk” that terminates
underground at the parking garage for Block “C’s” office building (see Appendix III.5 – “Grove Gallery Walk
Renderings”).
Block F
Building F will consist of luxury condominiums overlooking the Circle at Parc Seven. It will include multi-level
retail, connected by a pedestrian walkway for convenience to other amenities. This clock will also abut the
Traffic Circle. (Appendix III.4 – View of Condominiums from Grove Traffic Circle”).
Landscape, Site, Parking and Open Space.
The existing conditions and site topography are used as an advantage to the basis of the site design. The
elevation drop of 30 feet is embraced with structured parking on the first and second floors with access from
Leesburg Pike, Grove Street and the secondary streets. While allowing for over 2,000 parking spaces, this
design tucks away the structured garages from the public view. While the car is allowed on site, it is promptly
directed to parking garage entrances along the outer roads. By keeping the car to the exterior, other modes
of transportation are promoted to traverse the site. Where the car is allowed through the site, a variety of
traffic calming strategies will be implemented in the final design of Parc Seven. This may include a transition
of pavement that will suggest slower speeds are required and keep pedestrians as the focus.
The public park located between Blocks D and E functions as an extension of Grove Market as well as a
gathering space for entertainment. This space features hardscaping and landscaping that encourages an
exchange of merchandise and ideas. A connection to the Grove Gallery Walk located in the park will
encourage the community to experience the subterranean park and walkway. The 17,000-SF “Gallery Walk”
will exhibit year-round art installations, artisan markets, and community events. (see Appendix III.5 – “Grove
Gallery Walk Renderings”).
21 UNIVERSITY OF MARYLAND
LEED
The Fairfax County Comprehensive Plan indicates that new developments should be more sustainable than
the Tysons Corner of today. The Department of Planning and Zoning in Fairfax County also requires certain
levels of “green” certification to be approved. A widely accepted method of environmental measures is the
U.S. Green Building Council’s Leadership in Energy and Environmental Design (LEED) program. The density of
Parc Seven as well as other sustainable features in the site is expected to consume less energy than the
current development, anticipating obtaining close to net-zero usage. Various design strategies, uses and
goals for our site are estimated to certify the buildings of Parc Seven with a LEED Silver rating, or better. A
LEED Scorecard has been provided in the Appendix that more fully communicates the sustainability of the
development.
22 UNIVERSITY OF MARYLAND
MARKET ANALYSIS
NATIONAL ECONOMY
Economic growth will strengthen in 2014, averaging 2.7% or better for the year.9
Economic indicators
released since the last national update suggests the economy accelerated in the second half of 2013. The
gains will come as business and consumer confidence strengthens and Europe begins to emerge from its long
slumber, brightening overseas sales prospects. Increased business spending, growing consumer confidence,
the continued housing renaissance and healthy export gains all add up to an increasingly strong economy,
which will support net monthly hiring that could hit 200,000 new jobs.10
The December employment report from the Bureau of Labor Statistics (BLS) revealed mixed news on the
state of the labor market. According to the Kiplinger Report, consumer spending and confidence is still way
below normal levels by the standards of past economic expansions. As job growth returns and consumers
feel more secure, a cycle of spending will create more consumer income that produces more spending. If this
occurs in 2014, quarterly growth is likely to exceed an annualized pace of 3%. Retail sales will accelerate
steadily in 2014, gaining between 5.2% and 5.7%, following a more modest 4.5% increase in 2013.11
A
stronger economy, enjoying declining unemployment plus wage gains, will help. Sales in first-quarter 2014
are expected to top year-earlier figures by around 5.5%--nearly double the pace of growth seen at the close
of the first quarter of 2013. In 2014, retail sales will also be sustained by about a 3% increase in personal
income. In addition, consumers will have adapted to the 2013 increase in the payroll tax and will be no
longer as hesitant to spend.12
LOCAL CONDITIONS
Fairfax County had a population of about 1.12 million persons. Based on the current comprehensive plan,
Fairfax County has the capacity to add an additional 300,000 residents over the next three to four decades.
Over 44,000 of these residents are expected to be added by 2020. Although the number of older adults will
grow faster than other age groups, children under 20 will continue to increase in number.13
They also have
approximately 410,000 housing units, and about 400,000 households demonstrating an average household
size of 2.76.14
Fairfax County is in the process of becoming a Metro-based market with new stations from Tysons Corner to
Reston and further on to Dulles International opening in 2014. In terms of economic growth, competition in
the office market from the west is not new, however it is likely to intensify as Tysons becomes a valid choice
for companies and agencies seeking a Metro location along with a substantial supply of new office buildings
9 Kiplinger - http://www.kiplinger.com/tool/business/T019-S000-kiplinger-s-economic-
outlooks/#VL3GrsbFp757YtAU.99
10 Kiplinger - http://www.kiplinger.com/tool/business/T019-S000-kiplinger-s-economic-
outlooks/#VL3GrsbFp757YtAU.99
11 Bureau of Economic Analysis - http://www.bea.gov/newsreleases/national/pi/2014/pi1213.htm
12 Bureau of Economic Analysis - http://www.bea.gov/newsreleases/national/pi/2014/pi1213.htm
13 County of Fairfax, Virginia, “Responding Now and in the Future: Trends and Implications for Fairfax County
Residents”. Oct 2013.
14 U.S. Census Bureau, 1970, 1980, 1990, 2000 and 2010 Decennial Censuses, 2001 to 2025 estimates and forecasts,
Fairfax County Department of Neighborhood and Community Services
23 UNIVERSITY OF MARYLAND
that will soon become available.15
Since 1980 the development of new office space in Tysons has been nearly
equivalent to the amount of space developed in Arlington’s urban villages – 24.1 million square feet in Tysons
vs. 27.5 million square feet in Arlington. The Silver Line will also connect Reston and Herndon to Metro with
another 29.8 million square feet of office space resulting in a Silver Line office base larger than Arlington’s.
The Council of Governments (COG) cooperative forecasts indicate that between 2005 and 2030, Tysons will
see the most new jobs when compared to its neighbors at 50,400 new jobs capturing 4.3% of the region’s job
growth, about 2% higher than the Rosslyn-Ballston and Jefferson Davis Corridors.16
Mixed-use developments built correctly—adding density and developing underutilized land—will increase
property values in the surrounding areas, in some cases doubling or tripling in value. Tysons will be well
positioned to use this added value to pay for infrastructure improvements as well as help fund the transit
system.17
Economic analysis shows that introducing high levels of residences into the heart of Edge Cities can
create balanced, lively communities with reduced traffic congestion. The community can generate added
wealth that supports a wide variety of amenities, and activities, including an upgraded, more sensitively
designed transit system.18 Edge Cities have good auto access and a large unemployment base but few
residents. To balance the flow in and out of a community, the proportion of residential units should be
increased. This will add more transit riders and ultimately reduce dependence on the automobile
The total population in Tysons Corner was 19,627 in 2010. Of this, the average age was 35.8 years.20 In the
census tract which Parc Seven exists the current population is 815 with a projected increase to 1,316 in the
next 5 years.21
According to a study using the 2006-2010 American Community Survey Public Use Micro-data
Sample (PUMS) the average in-migrant to Fairfax County was under the age of 30 and highly educated
(Bachelor’s degree or higher). The average current resident is slightly older, but because of net in-migration,
the area’s population is slightly younger. The chart below (Fairfax County Population by Age)22 echoes this
trend. A combined average of 46% under the age of 35 is projected to continue through year 2030. While
Tysons has a young population, 96.6 percent of residents have graduated high school23
(a large amount
15 Arlington Economic Development Research Paper. “Tysons and the Silver Line: Threat or Benefit?”, January 2012
16 Arlington Economic Development Research Paper. “Tysons and the Silver Line: Threat or Benefit?”, January 2012
17 Tysons Corner Collaborative. “Taming Tysons Corner – Transforming the Quintessential Edge City”, date NA.
18 Tysons Corner Collaborative. “Taming Tysons Corner – Transforming the Quintessential Edge City”, date NA.
20 2010 Demographic Profile
21 Fairfax County Department of Neighborhood and Community Services; Economic, Demographic and Statistical Research, 2013
22 U.S. Census Bureau and Fairfax County Department of Neighborhood and Community Services, Demographic Repots
2012
23 Educational Attainment, 2008 – 2012 American Community Survey 5-Year Estimates
24 UNIVERSITY OF MARYLAND
being the in-migrants 25 years and older). 24
According to the Fairfax County Economic Development
Authority, “Thirty-one percent of persons 25 and older in Fairfax County have a bachelor’s degree, and 27.5
percent have a graduate or professional degree—among the highest percentages in the United States. (U.S.
Census Bureau)” 25
“Forecasts for the Washington metropolitan area, Northern Virginia and Fairfax County for population and
jobs are shown in Figures 1 and 2 respectively. The metropolitan area is expected to grow from an estimated
level of 5.4 million in 2010 to a forecast level of 8.3 million in 2050. Northern Virginia would grow from 2.4
million to 3.9 million, and Fairfax County would increase from 1.03 million to 1.56 million (intermediate
forecast). Jobs would increase for 2010 to 2050 from 3.3 million to 5.7 million for the metropolitan area with
Northern Virginia increasing from 1.4 million to 2.6 million, and Fairfax County from 680,000 to 1,280,000
(intermediate forecast) by 2050.”26
Households
Tysons Corner will see a large increase in rental units in the coming years as Metro’s Silver Line attracts a
more transient demographic that favors mixed-used developments. Projects within a ½ mile radius of a
Metro station are prime locations for dense apartment complexes.
Income
The latest Census Bureau’s American Community survey ranked Fairfax County as one of the wealthiest
counties in the nation. Median household and family income has just reached pre-recession levels and is
24 http://www.fairfaxcounty.gov/demogrph/pdf/migration2006-2010.pdf
25 http://www.fairfaxcountyeda.org/sites/default/files/pdf/fairfax_facts.pdf
26 GMU Center for Regional Analysis: Forecast for Tysons Corner to 2050, Stephen S. Fuller, PhD, Director,
John McClain, AICP, Sr. Fellow And Deputy Director 9/17/2008
FAIRFAX COUNTY POPULATION BY AGE
Source: U.S. Census Bureau and Fairfax County Department of Neighborhood and Community Services,
Demographic Repots 2012
25 UNIVERSITY OF MARYLAND
expected to steadily increase in the coming years. The percentage of income spent on housing has increased
for households that rent, but this has occurred in conjunction with rising incomes.
ESTIMATED MEDIAN INCOME AND MEDIAN FAMILY INCOME (2007-2012)
Year Median HH Income Median Family Income
2007 $105,200 $122,000
2008 $107,400 $126,900
2009 $102,500 $122,600
2010 $103,000 $122,200
2011 $105,800 $119,600
2012 $107,100 $124,800
Sources: Department of Neighborhood and Community Services and U.S. Census Bureau, 1980, 1990 and
2000 Decennial Censuses 2001 Supplementary Census Survey and 2002-2012 American Community Surveys.
Note: Figures are rounded to the nearest $100.
The percentage of renter households spending 30% or more of their income on housing has risen over the
past decade.
Source: U.S. Census Bureau, 1980, 1990, and 2000 Censuses and 2005 and 2011 ACS.
Parc Seven is poised to take advantage of the strong demographics at play in Tysons, and the larger region.
It’s accessibility to Metro and focus on a mix of uses caters to highly educated, well paid, active individuals;
and places Parc Seven among the most desirable developments in Tysons. These demographic factors
influenced our projected rental rates, by allowing us to be aggressive.
26 UNIVERSITY OF MARYLAND
MARKET OVERVIEW
NEW DEVELOPMENT AROUND THE GREENSBORO METRO STATION
PROJECT PLAN TYPE OFFICE SF RETAIL SF
HOTEL
KEYS
RESIDENTIAL
UNITS
OWNER COMMENTS
Greensboro
Station
Mixed-Use 1,999,364 170,000 400 1,615 The Meridian Group
Pending
approval
Tysons Central Mixed-Use 631,000 173,000 200 1,200
NVCommercial/Clyde's
Real Estate Group
Approved,
Total of 2.0 msf.
Greensboro
Park Place
Mixed-Use - 10,000 - 500 Beacon Capital
Pending
approval
Park Crest Residential - - - 300 Northwestern Mutual
Under
Construction
TOTALS 2,630,364 353,000 600 3,615
The Silver Line, Envisioning A New Tysons Corner, Cushman & Wakefield, December 2013.
27 UNIVERSITY OF MARYLAND
MARKET
OFFICE MARKET
National Office Trends
With a stabilizing economy and increasingly better jobs reports in recent months the U.S. office market
continues to improve. Overall employment only improved 1.4% but office using employment grew at 2.6% in
2013. Dallas/Ft. Worth, Chicago and Los Angeles were among the fastest growing markets in the U.S. and
primarily driven by the technology sector. Vacancy rates dropped 50 basis points in 2013 to lowest their
lowest level since 2009, with positive net absorption of 15 million square feet. Office development continued
to rise, with 18.6 million square feet of new in 2013, nearly double 2012’s tally of 9.9 million square feet.
Asking rates increased nearly 5% over the year
Tyson’s Office Market
Tysons Corner contains over 46 million square feet of office space making it one of the largest suburban
office markets in the United States and the largest in the Washington, D.C. metropolitan area. The
submarket which saw exponential growth over the past twenty years, is now home to countless nationally
recognized companies including Capital One, Ernst & Young, Price Waterhouse Cooper, Federal Home Loan
Mortgage Corporation (Freddie Mac), Booze Allen Hamilton, SAIC and many other non-profits and
government contractors supporting the federal government. As a result the area with a population of only
20,000 sees a daytime population surge of 100,000.
The direct office vacancy rate during the fourth quarter of 2013 was 12.7 percent, representing a downward
trend from 13.4 percent during the third quarter of 2013 and 14 percent at the end of 2012. Office rents
reflect the soft market, with an average effective office rent of $21.35 per square foot at fourth quarter of
2013, down 2.1 percent from year-end 2012. The decreasing effective rents are due to the still elevated
vacancy rate. However, the average asking office rents for new office space was $54.75 per square foot at
year-end 2013.
If the Rosslyn, Ballston Corridor is any indication of what may happen in Tysons, “Within a quarter mile radius
of the Metro, few properties deviate from the asking average rent by more than a few dollars. However,
buildings with direct, internal Metro access were able to ask and approximately 6% premium over market
averages. Given Fairfax County is encouraging a similar pattern of development along the Silver Line, within a
quarter mile radius of Metro stops, this pattern is likely to be echoed.” 27
The new Silver Line connecting Washington D.C. with Dulles Airport has spurred area development through
projects surrounding the Greensboro Metro Station are lagging behind other area stations. Developer
Meridian Group recently purchased the former SAIC headquarters with plans to renovate three existing office
properties at the site and eventually add more than 2 million square feet of mixed-use development on the
18-acre site. Cvent, Inc., an event management company, recently leased 130,000 square feet of newly
renovated space in the building. Adjacent to the site NV Commercial and Clyde’s Real Estate Group are
developing the 1.8 million Tyson’s Central which will include at least 631,000 square feet of office space.
Tysons West, a development by JBG Companies currently under construction will contain 400,000 square feet
27 The Silver Line, Envisioning a New Tysons Corner, Cushman & Wakefield, December 2013.
28 UNIVERSITY OF MARYLAND
of office space. Developer Hines plans to put in place 525,000 square feet of office space by mid-year 2014 at
7900 Tysons One Place
Parc Seven Office Vision
The technology sector remains one of the country’s hottest industries with blockbuster tech company
buyouts and fast growing companies frequenting the news. The trend is also evident among today’s top
young talent. At Harvard Business School, 18% of job-seeking students landed tech-sector spots this year, up
from 12% in 2012 (compared to an 8% decrease in financial sector jobs, from 35% to 27%). For the first time
at Stanford Graduate School of Business tech companies overtook financial services, with 32% of the class
accepting tech jobs and just 26% heading into finance. Two years ago, those figures were 13% and 36%,
respectively. A similar shift is under way in many other top schools (1).
Strategically located between Washington, D.C. and Dulles Airport, Tyson’s serves as the gateway to the
“Dulles Technology Corridor”, a technology and defense business cluster whose global reach and proximity to
the nation’s capital has drawn the highest concentration of technology workers in the U.S., according to
TechAmerica. Technology employment opportunities continue to grow with a 4% increase over the past two
years, reaching 20.6% total growth since 2001(3). The Washington D.C. Metro was also recently ranked the
2nd Best Place in America for Tech Jobs by Forbes Magazine.
Parc Seven’s goal is to facilitate an environment that will allow Tyson’s to benefit from this explosive
technology sector job growth. We will work together with Fairfax County to incentivize technology
companies that are looking to leverage the areas major economic drivers like its three regional airports and
the United States Department of Defense. These companies will be further drawn by the notion that our
trendy live-work-play environment will attract top young talent that is otherwise not enthused by Tyson’s
Corner. We will anchor our two full service high-tech office buildings near the metro with some of the hottest
and fastest growing companies in the tech sector that – will leverage Fairfax County’s major economic
drivers. Here are some examples:
Gogo Inc (NASDAQ: GOGO) is a provider of in-flight broadband internet service and other connectivity
services for commercial and business aircrafts. Gogo recently launched Gogo Text & Talk, an app that allows
users to make in-flight cell phone calls, and text messaging. We believe a presence in this market will offer
the opportunity for high profile exposure near three regional airports that serve as hubs for several major
airliners, as well as the world’s leading aerospace, defense and aircraft manufacturers like Airbus, Boeing,
Lockheed Martin, and Northrop Grumman.
Vuzix is a multinational technology firm headquartered in Rochester, New York that manufactures and sells
computer display devices and software including video eyewear and smart glasses for consumer, commercial,
and entertainment products. Recently the company received a grant from the U.S. Office of Naval Research
to integrate Google Glass-like, see-through optics into a standard pair of goggles for the U.S. Navy. The idea is
to superimpose computer-generated information on a soldier’s view of the real world. Our unique location
near Washington D.C. and with direct access to the U.S. Department of Defense will provide an incredible
growth opportunity for this company.
Apple Inc. (NASDAQ: AAPL) has recently become more open about their aggressive foray into the healthcare
industry. A company like Apple may leverage the rapidly growing INOVA healthcare network and their
dynamic growth Plan as well as proximity to the FDA.
29 UNIVERSITY OF MARYLAND
RETAIL MARKET
Retail Strategy
With proximity to the Greensboro Metro Station and visibility from Leesburg Pike, Parc Seven will include a
range of retail and activity driven spaces. We intend to provide 350,000 square feet of retail to the
development. There will be various services for the residents of Parc Seven including a bank, dry cleaners,
and pharmacy. These uses are seen as the high volume, credit tenants that will bring in customers to the
development. We have carefully arranged the retailers such that the national tenants will predominately
deliver into the project during the first and second phase of development, and receive the most visibility
from the main roads. The smaller boutiques, local shops, and the Grove Market are planned to deliver after
in the 3rd phase of development.
As shown in Figure 1, there will be a healthy mix of retail types on each block. With Parc Seven as an
entertainment destination, we are proposing a state-of-the-art music venue where the musician and
audience come together for a truly unique experience of entertainment and dining through a new concept
that combines bowling, bocce, and exceptional cuisine. Two major hubs of entertainment will be created
both at the “Grove Circle” and the Civic Center. The “Parc Plaza” will house our local food hub known as the
“Grove Market”.
Parc Seven will cultivate awareness for healthy living both with the offerings at the Grove Market and the
fitness center we are proposing. The fitness center will provide an artful arrangement of activity and
atmosphere, complete with spa, salon, healthy snack bar, gear shop, endless pools, luxurious locker rooms,
and the rooftop pool and lounge.
National Retail Trends
The retail market is finally emerging from the depths of recession. Improving retail fundamentals are the
result of an economic uptick and still historically low new retail development. According to data from NCREIF
in 111 U.S. metropolitan areas just 6.5 million square feet of new retail construction occurred in 2013 and 8
million square feet is expected in 2014. REIS recently reported the national vacancy rate for neighborhood
and community shopping centers at 10.4%, a subtle 30 basis point drop from last year. Effective rents grew
1.4% in 2013 which, is triple the rate of growth in 2012.
Meanwhile, countless retailers remain susceptible to the increasing popularity of online retail, which has
already claimed numerous victims. Bricks and mortar retailers are slowly adapting to the new reality by
learning how to relate to customers in the dynamic consumer landscape.
In today’s market, it is crucial that Landlords understand and adapt to the new reality by creating an
appealing customer destination to facilitate their tenant’s success. Ultimately, this will yield strong tenant
sales which landlord’s will capitalize on by way of tenant retention and consistent rent growth. According to
REIS, high-end retail destinations are thriving with vacancy rates reported well below 5%.
Tysons Retail Market
Tysons Corner is a regional retail hub which draws from a diverse customer base throughout Northern
Virginia, Washington, D.C. and Maryland. Two high-end regional malls, Tysons Corner Center and Tysons
Galleria, dominate the landscape. Macerich’s Tysons Corner Center is now the ninth largest mall in the United
30 UNIVERSITY OF MARYLAND
States with nearly 2.5 million square feet. General Growth Properties’ Tysons Galleria includes 30 exclusive-
to-market retailers. New competitive development on Leesburg Pike are Tyson’s Central and Westpark Drive
which calls for 173,000 and 60,000 square feet of retail respectively both with no specific tenancy mix.
The Tysons market and especially Leesburg Pike (Route 7) is identified as “a place all national retailers want a
presence”. Leases are triple net across the board. The submarket enjoys a consistently strong absorption
rate and positive rent growth. Average retail vacancy rate is at an incredibly low 1.4% for community and
neighborhood centers according to REIS. Average allowances offered to new tenants are $12.22 per square
foot for improvements with minimal free rent. Asking rents for anchor tenants range from $17.46 to $37.40
per square foot, with an average of $24.97. In-line asking rates range from $28.97 to $51.05 per square foot,
with an average of $40.80.
However, recent leasing activity indicates that economic improvement and excitement over the much
anticipated Silver Line Metro’s has driven rent much higher. Chipotle recently leased small shop space down
the block for the subject property at 8461 Leesburg Pike for $100 per square foot.
Parc Seven Retail Vision
Parc Seven retail component will leverage its close proximity to the Greensboro Metro Station and visibility
from high traffic Leesburg Pike. The tenancy will feature a diverse mix of more than 60 national, regional and
local retailers in 450,000 square feet. Service oriented and convenience retailers will benefit both residents
and commuters alike. Large national credit tenants will pay a premium for prime visibility along Leesburg Pike
while smaller boutique shops are prominent along the projects central multi-level retail corridor.
Figure 1 - Proposed Retail Mix
31 UNIVERSITY OF MARYLAND
At the heart of Parc Seven will be Grove Market, a high-end food market concept comprising of a variety of
fine restaurants, food and beverage stations, bakeries and retail items. This truly unique shopping experience
with its exclusive offerings will create a strong sense of place for residents, office users and guests driving
long term value for the project. Simultaneously it will serve as an incubator for local restaurant and food
concepts. The vendor mix within The Grove will be modeled after other great food markets around the
country; Chelsea Market and Eataly in New York City, The Ferry Building in San Francisco and Reading
Terminal. Our goal is to become a food destination with high-quality offerings of local products served by top
tier vendors and food entrepreneurs with a healthy balance between take home groceries and consume on
the spot food offerings.
Parc Seven will also feature an array of popular entertainment and activity options for residents and visitors.
Vida is a state of the art lifestyle gym complete with a spa, salon, snack bar, apparel shop and rooftop pool
and lounge. A trendy music venue where the musician and audience come together for a distinctive
entertainment experience and a new concept that combines bowling, bocce, and exceptional dining will
highlight the project. The “Grove Plaza” will serve as a food centric zone and contain the Grove Market.
See Appendix IV.1 -“Market Supplement” for chart describing retail mix by use, and Appendix IV.2 -“Market
Supplement” for the chart describing the retail mix per building.
HOUSING MARKET
The vision of Tysons as a new urban center relies upon Tysons transitioning from being known as home to the
“largest concentration of office space in Northern Virginia to becoming a 24/7 live/work/play environment”.
The integration of uses inside neighborhoods is pivotal and housing takes center stage. “Fairfax County has
predicted the population of Tysons Corner will grow to 100,000 by 2050. With over 20,000 dwelling units
currently proposed, the groundwork for such tremendous growth is undeniably in place.28
Existing conditions in Tysons Corner-Vienna and Fairfax City vary slightly from the Metro Suburban Virginia
data in that asking rents are higher. Vacancy rates and concessions are also higher due to the increase in
supply.
Figure 1
Submarket
Inventory
(Buildings)
Inventory
(Units)
Asking Rent
$
Vac %
Free Rent
(mos)
Expenses %
(Apartment)
Tysons Cor/Fairfax 41 13,670 $1,743 6.80% 0.69 41.20%
Average Suburban Virginia Lease Terms 3.80% 0.29 41.30%
REIS Observer 4Q 2013
Tysons generally has higher rents when compared to Suburban Virginia. This may be due to larger unit sizes.
Figure 2 shows the rents and unit sizes of Suburban Virginia as a whole. This includes all classes and ages of
inventory. Figure 3 shows just the Tysons portion of the Suburban Virginia market. Figure 4 shows the rents
and unit sizes of The Ascent, a recently completed multifamily development in Tysons by Greystar. The
28 The Silver Line, Envisioning a New Tysons Corner, Cushman & Wakefield, December 2013, PG 19.
32 UNIVERSITY OF MARYLAND
Ascent is a Class A luxury high-rise currently in lease-up. Their rents are significantly higher than rents in
Tysons and the units are significantly smaller.
This trend of smaller units at higher rents is sweeping the Washington Metro area. Millennial’s are
increasingly demanding studios and one bedroom units that are transit oriented, in cool neighborhoods
where they can access food and entertainment easily. They increasingly do not own cars and have yet to
accumulate a lot of stuff. The Ascent is in line with other multifamily developments of the same type in
catering to this growing demographic. As such, the three bedroom unit has become unpopular because
families with children do not generally live in luxury apartments geared toward singles and young couples.
Parc Seven utilizes a similar methodology when determining our rents and unit sizes.
That being said, according to a Transwestern report, “Class A rents declined by 1.1% over the past year
(2013), down from the 2.7% growth posted at third quarter 2012.” Class A rents will face downward pressure
over the next 24 months at the regional level due to the large slate of scheduled deliveries compared to
projected demand levels.”
Figure 2
Rent Avg. SF Avg. Rent PSF
Studio/Efficiency $1,266 525 $2.41
One Bedroom $1,460 759 $1.92
Two Bedroom $1,717 1,043 $1.65
Three Bedroom $1,964 1,264 $1.55
REIS Observer 4Q 2013
Figure 3
Rent Avg. SF Avg. Rent PSF
Studio/Efficiency $1,289 584 $2.21
One Bedroom $1,578 792 $1.99
Two Bedroom $1,846 1,057 $1.75
Three Bedroom $2,085 1,273 $1.64
REIS Submarket Trend Futures, Apartment 4Q 2013
Figure 4
Rent Avg. SF Avg. Rent PSF
Studio/Efficiency $2,003 461 $4.34
One Bedroom $2,740 821 $3.34
Two Bedroom $3,524 1,083 $3.25
Three Bedroom -$ 0 -$
www.theascenttysons.com, as of 2/24/2014
The Ascent Unit Mix Rent Details
Current Asking Rents and Sizes
4Q 2013
4Q 2013
Current Metro Average Rents and Sizes
Suburban Virginia Unit Mix Rent Details
Tysons Submarket Unit Mix Rent Details
Current Submarket Rents and Sizes
4Q 2013
33 UNIVERSITY OF MARYLAND
According to a report by Transwestern, Northern Virginia’s “Class A absorption remains strong and continues
to outpace deliveries at this stage of the development cycle. Net absorption is at 6,493 Class A and B
apartments across the metro.” According to Reis new construction is anticipated to total 17,368 units (3,474
per year on average) from 2013 to 2017, while net absorption is forecast to reach 14,833 (2,967 per year on
average) (Figure 5).
Figure 5
REIS Observer 4Q 2013
Reis data shows that, “the mean cap rate fell to 3.5% in the third quarter of 2013 after finishing the first
quarter at 5.7%. The low cap rate implies the sale of a prime property in the third quarter. Rolling cap rates
settled at 4.8% in the fourth quarter of 2013 and are expected to vary between 4.5% and 5.1% going forward.
29
Our cap rates are conservative in the 6% range.
The supply of housing shows that multifamily units will continue to dominate the housing stock.
“Conversions of apartments to condominiums, once an active trend here, has ceased since 2009.” However,
the condo market is slated to make a slight comeback in terms of planned units. 30
Figure 6
Tysons Cor/Fairfax Apartment Condo Other
Completed 535 0 42
Under Construction 1,887 0 241
Planned/Proposed 9,310 375 456
Total 11,732 375 739
Grand Total 12,846
New Construction Project Tally
REIS New Construction Listing 4Q 2013
Through phasing the Parc Seven development builds in flexibility to adjust to the market. We have planned
for apartments and condominiums but that could change to all for-rent units if need be.
29 Reis Observer Q4 2013.
30 REIS New Construction Listing 4Q 2013
0
1000
2000
3000
4000
5000
6000
7000
No.ofUnits
Northern Virginia Apartment
Supply and Demand Trends
Completed
Absorbed
34 UNIVERSITY OF MARYLAND
HOTEL MARKET
Today there are 11 hotels in Tysons Corner. As the office and residential population grows in Tysons, so too
will demand for more hotels. The master plan projects that Tysons will have 80,000-100,000 residents by
2050 and over 200,000 employees, compared to 17,500 residents and 100,000 employees today. With such
a dramatic increase in economic activity, Tysons Corner will need more hotels to accommodate visitors. Local
developer MRP is currently building two Hilton banner hotels at Tysons Overlook, while Macerich plans for a
new 310-key Grand Hyatt at Tysons Corner.
With currently no planned hotels at the Greensboro Metro Station, where the Silver Line serves as a direct
link between Washington, D.C. and Dulles International Airport, a hotel is a natural fit for the sight.
Recognizing that there are numerous other hotel options in the market we selected a unique hotel that will
differentiate itself in the market and integrate well with our overall vision. Hotel Zetta is a popular luxury
hotel in San Francisco owned and operated by Viceroy Hotel Group, a hotel manager with hotels throughout
the world under their flagship Viceroy Hotels and Resorts banner and Urban Retreats banner. The tasteful,
modern hotel invites style-seeking travelers and local professionals to work, connect, play and get inspired.
CIVIC CENTER
There are many different museums and performance venues throughout Virginia, but the Tysons Corner
region has minimal civic attractions. Keeping in line with the desires of Fairfax County’s desire for the south
Central 7 District to be a hub for public enjoyment we considered a variety of potential uses for our site. Our
goal is to bring a well-integrated public attraction to our site that will serve the community and drive further
traffic to the project.
Currently the region is home to one of the leading performing arts venues, Wolf Trap. As America’s National
Park for the Performing Arts, it enhances the culture in the region though artistic and educational programs.
Wolf Trap is run through a public private partnership with the U.S. Department of the Interior, National Park
Service.31 Much of the venue is outdoors and features performances ranging from pop and country to
orchestra, theatre, and opera, as well as innovative performance art and multimedia presentations.
The Tyson Corner Comprehensive Plan envisions a redevelopment of the south Tysons Central 7 sub-district
that will focus on civic uses.32
According to the District Recommendation, “The signature focal point of the
Tysons Central 7 District is the civic center’s great public space, the ‘Civic Commons’ which should be about
three to four acres.” The goal of the vision is to create a new public identity for the district and provide space
for large public gatherings. We are currently negotiating with several cultural and artistic programs that may
have an interest in expanding their facilities and presence to our site in Tysons Corner. We would like to
propose an allocation of cost to Fairfax County for input as far as the organization that will occupy this
portion of our site.
31
Wolftrap - http://www.wolftrap.org/Learn_About_Wolf_Trap.aspx
32
Tysons Comprehensive Plan – FAIRFAX COUNTY COMPREHENSIVE PLAN, 2013 Edition AREA II Tysons Corner Urban Center,
Amended through 2-12-2013 District Recommendations pages 131-134
35 UNIVERSITY OF MARYLAND
The Northern Virginia Children’s Science Museum is currently looking for 40,000 with the possibility of future
expansion. The science center will be an interactive children’s museum focused on science, technology,
engineering and math or “STEM”. To compliment this user the site will also house an IMAX Theater. With the
advent of new technology popular feature length Hollywood films are now shot in 3-D and played on IMAX
screens. This unique theater will show educational IMAX productions during the day and full length films in
the evening and on weekend, serving as a round the clock traffic driver.
To facilitate the Science Center’s potential for future growth we plan to leave a warm lit shell of 40,000
square feet. In the interim this space will serve as yet another unique destination and attraction. We will
lease the space to Premier Exhibitions (NASDAQ:PXRI) a company that organizes traveling exhibitions and
displays them at high-profile locations throughout the world. Currently they have two permanent exhibition
display sites at Luxor in Las Vegas and in Atlanta where they are headquartered. Some of the recent well
known exhibits include RMS Titanic and Bodies… The Exhibition.
36 UNIVERSITY OF MARYLAND
FINANCIAL ANALYSIS
INTRODUCTION
Parc Seven is a financially viable development project with strong cash flow potential. Throughout our
financial analysis, we took on a more conservative approach in our assumptions to demonstrate the
performance strength of the project. We also made various strategic decisions with this project in order to
mitigate risk for the developer; first by breaking the project into four independent phases that were planned
to be fluid in order to react to market demand without overcommitting the developer to specific programing
uses, second this approach calls for the six (6) resulting blocks of the project to be subdivided into separate
ownership entities in order to limit risk and allow for easier underwriting on smaller blocks, and additionally
by maintaining our strongest existing tenants for as long as possible we were able to maintain $5million in
cash flow on the property during the first 4-years of build-out, and $2.5million for an additional 2-years;
resulting in a total of $25million in cash flow during the first 6-years of construction due to our strategic
phasing.
ACQUISITIONS
The proposed development of Parc Seven spans a 12.8-acre site, predominately owned by Federal Realty
Investment Trust (FRIT). The development also includes a 18,526 square foot low rise building at 8399
Leesburg Pike. The parcel is particularly essential because it is the corner of the site and the first impression
for vehicular traffic.
In 2013 the land was valued at $1,667,340 and the building at $4,154,530 for a total assessed value of
$5,821,870. In November of 2008 it was sold to the Commonwealth of Virginia for $6,100,00040
. Because the
block will contain the science and civic center for the community, we have assumed acquisition of the parcel
through contribution by the Commonwealth of Virginia.
40
Fairfax County Tax Assessment. 8399 Leesburg Pike.
http://icare.fairfaxcounty.gov/Datalets/Datalet.aspx?sIndex=0&idx=2
37 UNIVERSITY OF MARYLAND
ASSUMPTIONS
PARC SEVEN AT GREENSBORO STATION - TOTAL USES AND SOURCES
EXHIBIT 1: PARC SEVEN USAGE OF FUNDS
USES - Development Costs Total
Acquisition
Land & Building Acquisition 54,324,661$
Total Acquisition 54,324,661$
Construction
Demolition 16,810,160$
Infrastructure & Urban Plaza 1,805,639$
Retail 56,475,952$
Office 97,382,707$
Hotel 67,532,887$
Apartment 123,487,446$
Condominium 39,725,137$
Civic 11,681,525$
Parking 43,120,413$
Taxes/Ins. During Const. 1,173,413$
Total Construction 459,195,279$
Construction Financing
Points & Fees (Origination) 2,211,926$
Interest Expense 31,582,715$
Total Construction Financing 33,794,641$
Soft Costs
Soft Costs 100,813,129$
Total Soft Costs 100,813,129$
Permanent Financing
Points & Fees (Origination) 2,228,977$
Transfer/Recording Fees 668,893$
Title Insurance, Recording, Management 535,000$
Total Permanent Financing 3,432,870$
Reserves
Lease-up Reserves 1,815,000$
Operating Reserves 2,230,000$
Replacement Reserve 2,800,000$
Total Reserves 6,845,000$
Development Fees
Development General & Administration 13,716,783$
Development Fee 13,716,783$
Total Development Fees 27,433,566$
Total Development Cost 685,839,146$
PARCEL C - ESTIMATED DEVELOPMENT COSTS
38 UNIVERSITY OF MARYLAND
EXHIBIT 2: PARC SEVEN SOURCES OF FUNDS
The financial analysis details all four phases of construction through lease up totaling to a development cost
of $695,839,146. $445,795,445 will be financed via loan syndication and the remaining $240,043,701 will be
financed with owner equity. Each phase of the development will be financed separately, giving the
development team the option to analyze market conditions at different intervals over the nine-year
construction schedule and determine if development should proceed to full completion. Thus, there is the
option to halt development after the completion of the first few phases if future market conditions are
unfavorable.
The phasing has been coordinated to preserve the net operating income of the current shopping center for as
long as possible. Block C was chosen as the first phase of the development for a variety of financially
advantageous reasons. This block’s proximity to Greensboro Metro Station makes it the best candidate for
initial development. Positioning an office tower closest to Greensboro Metro Station gives the building high
visibility and ease of accessibility. These qualities justify the per square foot rent we intend to charge for the
office space. By carving an arch within the first few stories of the building, pedestrians can walk through the
building and into the entertainment/retail areas that will be constructed during the later phases of
development. Additionally, construction of Phase One is least intrusive to existing retailers at Pike 7 Plaza
and will not disrupt the current retail center’s cash flow and business operations. Lastly, Block C requires no
demolition as it is currently a surface parking lot.
Phase One of the development is Block C at the southeast corner of the site. This block will contain 329,000
square feet of rentable office space, first floor retail and a partial level of underground parking (PPU).
Construction will commence on January 15, 2016, with substantial completion occurring on December 29,
2017. The total development cost for Phase I is $93,262,041.
SOURCES - Development Financing Proposed
Funding
Equity
Equity - Owner(s) (Land/Building) 58,984,802$
Equity - Owner Other 181,058,899$
Equity - Investors, LP, and/or LLC -$
Debt
1st Mortgage 445,795,445$
Other Mortgage -$
Other
City Loan (Soft) -$
County Loan (Soft) -$
Grants -$
Total Financing/Equity: 685,839,146$
39 UNIVERSITY OF MARYLAND
EXHIBIT 3: PROGRAMMING MIX FOR PHASE I
Phase II of the development will require the demolition of BB&T bank and roughly one third of the shopping
center up to the center’s breezeway. The partial demolition of Pike 7 Plaza is necessary to make room for
temporary surface parking for remaining tenants in the plaza and new tenants in Parcel C. The abandon
building located on Parcel A will also be demolished along with the Goodyear building so that the shopping
center’s visibility from Leesburg Pike is not completely obstructed by the construction of Parcel B. Parcel B
will contain 250 hotel rooms along with new office space, with retail on the first floor, a partial level of
parking underground (PPU) and a full level of underground parking (P1LU). Construction of Phase II will
commence on January 1, 2018, with substantial completion occurring on December 31, 2019. The loss of
revenue from retailers located on Parcel F will be mitigated by the opening of new retail stores in Parcel C.
The total development cost for Phase II is $196,446,408.
EXHIBIT 4: PROGRAMMING MIX FOR PHASE II
Phase III will require the demolition of the remainder of Pike 7 Plaza on Parcels D and E to make way for 593
apartment units. Phase III will also see the construction of 105 for-sale condominiums on Parcel F making it
the largest and most costly phase of the development. During the construction of Phase II, the development
team will reanalyze the market to determine the risk involved in proceeding with this large phase of the
project. If construction is green lit, it will begin on January 1, 2020, with substantial completion occurring on
December 31, 2021. The total development cost for Phase III is $319,517,708.
TDC: 93,262,041$
ASSUMPTIONS:
Bld. Footprint 28,270
Uses GSF NSF
Office 355,566 328,899
Retail 11,149 10,313
Parking 27,619 27,619
Total 394,334 366,830
PHASE I
Parcel C - Office Building
TDC: 196,446,408$
ASSUMPTIONS:
Bld. Footprint 79,540
Uses GSF NSF
Hotel 270,738 234,188
Office 229,280 212,084
Retail 119,310 110,362
Parking 159,080 159,083
Total 778,408 715,717
PHASE II
Parcel B - Hotel/Office
40 UNIVERSITY OF MARYLAND
EXHIBIT 5: PROGRAMMING MIX FOR PHASE III
Phase IV is the last phase of the development on the last remaining parcel, Parcel A. This building will contain
over 43,000 square feet of rentable civic space along with over 150,000 square feet of retail and partial
parking underground. Phase IV contains the development of Parcel A because the land contained within
Parcel A must be acquired from the state of Virginia; if there are any complications with acquisition, the
development team did not want it to hold up initial construction of the development. Construction of this
phase will commence on January 3, 2022, with substantial completion occurring on December 29, 2023. This
is the least costly phase of development with a total development cost of $76,612,988.
TDC: 319,517,708$
Total Const. Cost: 67,319,249$
ASSUMPTIONS:
Bld. Footprint 57,965
Uses GSF NSF
Apartment 214,650 185,672
Retail 57,965 53,618
Parking 115,930 115,930
Total 433,331 433,332
PHASE III
Parcel D - Retail/Multifamily
Total Const. Cost: 86,263,404$
ASSUMPTIONS:
Bld. Footprint 70,898
Uses GSF NSF
Apartment 348,089 301,097
Retail 70,902 65,584
Parking 70,902 70,902
Total 571,595 571,596
PHASE III
Parcel E - Retail/Multifamily
Total Const. Cost: 49,650,568$
ASSUMPTIONS:
Bld. Footprint 35,634
Uses GSF NSF
Condo 150,983 130,600
Retail 35,638 32,965
Parking 70,345 70,345
Total 256,966 233,910
PHASE III
Parcel F - Condominium
41 UNIVERSITY OF MARYLAND
EXHIBIT 6: PROGRAMMING MIX FOR PHASE IV
The project will stabilize approximately one year after substantial completion of Parcel A on January 1, 2025
and the projected sale date is in year 2027. Exhibit 7 shows the project’s start of construction, stabilization,
exit year, and the internal rate of return.
EXHIBIT 7: PROJECT SNAPSHOT
Exhibit 8 breaks down the project’s capital injection for each phase from a leveraged and unleveraged
position as well as the before tax and after tax cash flow. Capturing the current income stream provided by
Pike Seven Plaza will increase the estimated cash flow of the project by $24,166,666 during the five and a half
years of development. This current cash flow is highlighted blue. The cash flow for years 2022 and 2023 is
highlighted in orange to show the boost in revenue received from the sale of the condominiums in Parcel F.
TDC: 76,612,988$
ASSUMPTIONS:
Bld. Footprint 46,831
Uses GSF NSF
Civic 46,831 43,319
Retail 163,909 151,615
Parking 70,247 70,247
Total 280,987 265,181
Parcel A - Civic Building
PHASE IV
Project Snapshot
Total Development Cost: 671,035,133$ BEFORE TAX LEVERAGED
Project Price Per Square Foot: 1,163$ 2027 27.86%
Construction Commences: 2016 AFTER TAX LEVERAGED
Stabilization Year: 2025 2027 25.83%
Exit Year: 2027 UNLEVERAGED
Before Tax Sales Price: 764,961,326$ 2027 14.91%
Rate of Return
Projected Internal
42 UNIVERSITY OF MARYLAND
EXHIBIT 8.1: BEFORE-TAX, AFTER-TAX 10 YEAR PROJECTED INTERNAL RATE OF RETURN
LLC Current Cash Flow Before-Tax LLC
Equity Cash Flow Before Property Before-tax
Year Pay-In (Estimated) Taxes Sale Distribution
1/1/2016 (32,641,714)$ 12,500,000$ -$ (20,141,714)$
1/1/2017 -$ 5,000,000$ (5,535,519)$ (535,519)$
1/1/2018 (68,756,243)$ 3,333,333$ (1,011,551)$ (66,434,461)$
1/1/2019 -$ 3,333,333$ 4,678,435$ 8,011,768$
1/1/2020 (111,831,198)$ -$ 6,684,016$ (105,147,182)$
1/1/2021 -$ -$ 51,537,826$ 51,537,826$
1/1/2022 (26,814,546)$ -$ 31,519,394$ 4,704,848$
1/1/2023 -$ -$ 27,351,053$ 27,351,053$
1/1/2024 -$ -$ 28,723,079$ 28,723,079$
1/1/2025 -$ -$ 30,380,315$ 30,380,315$
1/1/2026 -$ -$ 32,819,586$ 764,961,326$ 797,780,912$
Total (240,043,701)$ 24,166,666$ 207,146,635$ 764,961,326$ 756,230,926$
Internal Rate of Return Before Tax: 27.86%
Before Tax Net Present Value: 110,845,922$
Hurdle Rate: 15.00%
NPV Rate: 15.00%
BEFORE TAX -LEVERAGED
LLC Current Cash Flow After-Tax LLC
Equity Cash Flow After Property After-tax
Year Pay-In (Estimated) Taxes Sale Distribution
1/1/2016 (32,641,714)$ 7,375,000$ -$ (25,266,714)$
1/1/2017 -$ 2,950,000$ (2,806,935)$ 143,065$
1/1/2018 (68,756,243)$ 1,966,666$ (160,154)$ (66,949,730)$
1/1/2019 -$ 1,966,666$ 4,226,269$ 6,192,935$
1/1/2020 (111,831,198)$ -$ 5,326,791$ (106,504,407)$
1/1/2021 -$ -$ 61,439,849$ 61,439,849$
1/1/2022 (26,814,546)$ -$ 40,984,406$ 14,169,860$
1/1/2023 -$ -$ 37,109,982$ 37,109,982$
1/1/2024 -$ -$ 38,012,975$ 38,012,975$
1/1/2025 -$ -$ 39,536,574$ 39,536,574$
1/1/2026 -$ -$ 40,744,358$ 609,086,765$ 649,831,124$
Total (240,043,701)$ 14,258,333$ 264,414,114$ 609,086,765$ 647,715,511$
Internal Rate of Return After Tax: 25.83%
After Tax Net Present Value: 88,981,633$
Hurdle Rate: 15.00%
NPV Rate: 15.00%
AFTER TAX - LEVERAGED
43 UNIVERSITY OF MARYLAND
EXHIBIT 8.2: UNLEVERAGED 10 YEAR PROJECTED INTERNAL RATE OF RETURN
The dimensions of the site are shown in Exhibit 9. The total size of the site in approximately 577,234 square
feet with over 57,000 square feet allocated to park/civic space.
EXHIBIT 9: SITE DIMENSIONS AND BUILDING FOOTPRINTS
The development features a combination of retail, hotel, office, residential, and civic space totaling over 2.5
million square feet. The total square footage of each use is detailed in Exhibit 10.
LLC Current Cash Flow Property LLC
Equity Cash Flow Sale Distribution
Year Pay-In (Estimated)
1/1/2016 (83,639,432)$ 7,375,000$ -$ (76,264,432)$
1/1/2017 -$ 2,950,000$ (1,868,287)$ 1,081,713$
1/1/2018 (196,446,408)$ 1,966,666$ 2,655,681$ (191,824,061)$
1/1/2019 -$ 1,966,666$ 18,932,380$ 20,899,046$
1/1/2020 (319,517,708)$ -$ 20,937,961$ (298,579,747)$
1/1/2021 -$ -$ 80,726,451$ 80,726,451$
1/1/2022 (76,612,989)$ -$ 60,708,019$ (15,904,969)$
1/1/2023 -$ -$ 57,286,283$ 57,286,283$
1/1/2024 -$ -$ 58,658,309$ 58,658,309$
1/1/2025 -$ -$ 61,031,246$ 61,031,246$
1/1/2026 -$ -$ 62,754,816$ 1,086,363,239$ 1,149,118,055$
Total (676,216,537)$ 6,883,333$ 421,822,859$ 1,086,363,239$ 846,227,894$
Unleveraged Internal Rate of Return: 14.91%
Unleveraged Net Present Value: (1,720,734)$
Hurdle Rate: 15.00%
NPV Rate: 15.00%
UNLEVERAGED
Total Site Size 577,234
Total Building FP 319,138
Urban Plaza 33,443
Park Space 24,000
Roads 117,423
Sidewalks 83,230
Parcel A Size 99,716
Parcel B Size 112,219
Parcel C Size 64,314
Parcel D Size 101,563
Parcel E Size 128,903
Parcel F Size 70,519
Site Dimensions (Sq./ft.)
Building A 46,831
Building B 79,540
Building C 28,270
Building D 57,965
Building E 70,898
Building F 35,634
Building Footprints (Sq./ft.)
44 UNIVERSITY OF MARYLAND
EXHIBIT 10: PRORAMMING MIX
A breakdown of land and building acquisition is shown in Exhibit 11. The acquisition cost is based off of the
assessed value of the property for the most recent tax year. Acquisition of Parcel A includes the assessed
value of the 18,000 square feet of land and the building not currently owned by Federal Realty Investment
Trust. The development team plans to purchase this land from the state of Virginia so that it can be
incorporated into the development. This parcel is vital to achieve full build out of Parcel A. The average price
per square foot of the existing buildings and land is $100.31. The acquisition price for each parcel is
determined by multiplying this number by the total square footage of each parcel.
EXHIBIT 11: ACQUISITION COSTS
Hotel 270,738
Office 584,846
Apartment 562,739
Condo 150,983
Retail 458,873
Civic 46,831
Infrastructure 200,653
Green Space 57,443
Gallery Walk 17,300
Parking 514,123
Total Sq./Ft. 2,864,529
Total Programming Mix
8365 Leesburg Pike 3,007,840$
8371 Leesburg Pike 36,165,240$
8365 Leesburg Pike 12,998,160$
Total Value Existing Site 52,171,240$
Apprx. Land Square Footage 558,708
Price Per Square Foot 93.38$
Building Price $4,062,560
Land Price $1,667,340
Total Value Existing Site $5,729,900
Land Square Footage 18,526
Price Per Square Foot 309.29$
Total Acquisition Price 57,901,140$
Total Size of Site 577,234$
Total Site Price PSF 100.31$
Acquisition of Parcel A
Site Acquisition
45 UNIVERSITY OF MARYLAND
The demolition and construction costs per square foot were provided by Tishman Construction Corporation
and detailed in Exhibit 12.
EXHIBIT 12: CONSTRUCTION COSTS PER SQUARE FOOT
Parking spaces were deduced using an average parking space size of 243 square feet. Parc Seven will have
2,116 parking spaces available. The cost for construction of surface and underground parking was also
provided by Tishman Construction Corporation. This is shown in Exhibit 13.
EXHIBIT 13: PARKING SIZING AND COSTS
For the purposes of this pro forma, we are estimating that operating expenses would be approximately 35
percent of the project’s gross operating income (not including taxes and leasing concessions). We have also
taken into consideration the core loss factor, which is indicated in Exhibit 14.
EXHIBIT 14: SOFT COST ESTIMATION AND CORE LOSS
Each phase will be financed via a 24 month construction loan that will be taken out by a permanent loan at
substantial completion. The construction loan is assumed to have a 10% retainage paid out at the end of
Demolition 3.50$ per sq./ft.
Retail 139.25$ per sq./ft.
Condo 263.11$ per sq./ft.
Apartment 219.44$ per sq./ft.
Office 166.51$ per sq./ft.
Hotel 249.44$ per sq./ft.
Civic 249.44$ per sq./ft.
Open Space Costs 4.60$ per sq./ft.
Roadway Costs 9.30$ per sq./ft.
Sidewalk Costs 5.90$ per sq./ft.
Construction Costs
Parking - Avg. Size 243 SF/space
Total Parking Spaces 2,116
Above Grade Parking 70.55$ per sq./ft.
Below Grade Parking 104.76$ per sq./ft.
Surface Grade Parking 12.00$ per sq./ft.
Sizing - Parking
Parking Estimated Costs
Soft Cost 35.00% of GOI
Core Loss Office/Retail 7.50% of GSF
Core Loss Residential 13.50% of GSF
% Non-Leasable space
Other Details
46 UNIVERSITY OF MARYLAND
loan’s 24 month term. Each phase of the project will be financed via loan syndication and issued by a Lead
Arranger. It is assumed that our permanent loan will be structured as a balloon, and we intend to refinance
the balloon payment at the end of the loan term as long as the project remains financially viable. We have
assumed an interest rate of 5.25% for permanent financing in an effort to approach this analysis
conservatively. This is detailed in Exhibit 15.
EXHIBIT 15: FINANCING ASSUMPTIONS
The rents that we intend to charge for each use have been deduced via the market analysis conducted by the
development team. We are assuming $75 per month for each space that we have designated as income
producing parking. The rents for each use is shown in Exhibit 16.
EXHIBIT 16: RENTAL RATES
The unit mix for the apartment buildings located on Parcel D and Parcel E was determined by a residential
market analysis. Exhibits 17 and 18 show the square footage for each unit type, and the rent that the
development team intends to charge for each type. It was determined that three bedroom units were not
desirable in this particular area, and were not included in the unit mix.
LTV: 65%
Rate: 5.25%
Term (Years): 25
Origination: 0.50%
Fees: 0.15%
Permanent Financing
Months: 24
Loan Origination: 0.50%
Rate: 6.75%
Retainage: 10%
Construction Financing
Trophy Office 54.00$ per SF
Hotel 50.00$ per SF
Retail 75.00$ per SF
Multifamily 42.00$ per SF
Civic 50.00$ per SF
Parking 75.00$ per space
Rental Rates
47 UNIVERSITY OF MARYLAND
EXHIBIT 16: UNIT SQUARE FOOTAGE
EXHIBIT 17: UNIT RENTAL RATES
Workforce housing has been factored into the unit mix for the apartment buildings. The maximum amount
of rent the development team could charge for workforce housing was determined by accounting for the
area’s average median income (AMI). This is shown in Exhibit 18.
EXHIBIT 18: WORKFORCE HOUSING MONTLY RENTAL RATES
Parcel D and E contain a total of 593 apartment units. The unit breakdown for each parcel is shown in
Exhibits 19 and 20.
Type Sq./Ft Mix Total SF
Studio/1BA 460 1 460
1BR/1BA 820 2 1,640
2BR/2BA 1,080 1 1,080
2,360 4 3,180
Average unit size is: 795
Apartment Rentals
Type Rent Mix Total $
Studio/1BA 2,000$ 1 2,000
1BR/1BA 2,700$ 2 5,400
2BR/2BA 3,500$ 1 3,500
8,200$ 4 10,900
Average unit rent is: 2,725
Apartment Rentals
Max/Inc. Rent
WFH- AMI % $107,096 30.00% Monthly
101-120% 5.00% $107,096 32,129$ 2,677$
81-100% 5.00% 86,748$ 26,024$ 2,169$
71-80% 5.00% 76,038$ 22,811$ 1,901$
61-70% 3.00% 65,329$ 19,599$ 1,633$
50-60% 2.00% 53,548$ 16,064$ 1,339$
Workforce Apartment Rents
48 UNIVERSITY OF MARYLAND
EXHIBIT 19: UNIT MIX FOR PARCEL D
EXHIBIT 20: UNIT MIX FOR PARCEL E
Parcel F contains for-sale condominiums. Workforce housing has also been taken into account when
determining the unit mix. The unit mix for Parcel F is shown Exhibit 21.
EXHIBIT 21: CONDOMINIUM UNIT MIX FOR PARCEL F
Studio 30 2,000$ 59,215$
S -WFH 27 1,885$ 50,884$
1-Bdrm 104 2,700$ 281,380$
1 -WFH 9 2,300$ 20,700$
2-Bdrm 48 3,500$ 166,626$
2 -WFH 9 2,677$ 24,097$
TOTAL 226 602,901$
UNIT MIX - PARCEL D
Studio 56 2,000$ 111,596$
S -WFH 36 1,577$ 56,774$
1-Bdrm 166 2,700$ 447,108$
1 -WFH 18 2,300$ 41,400$
2-Bdrm 74 3,500$ 258,293$
2 -WFH 18 2,677$ 48,193$
TOTAL 367 963,364$
UNIT MIX - PARCEL E
Studio 18 450,000$ 8,100,000$
S -WFH 10 405,900$ Avg. 4,059,000$
1-Bdrm 40 550,000$ 22,000,000$
1 -WFH 9 452,833$ Avg. 4,075,500$
2-Bdrm 25 685,000$ 17,125,000$
2 -WFH 3 568,550$ Avg. 1,705,650$
TOTAL 105 543,478$ 57,065,150$
CONDOMINIUM UNIT MIX
49 UNIVERSITY OF MARYLAND
The uses and sources for each phase are shown in Exhibits 22, 23, 24, and 25.
EXHIBIT 22: PHASE ONE SOURCES & USES
EXHIBIT 23: PHASE II USES AND SOURCES OF FUNDS
EXHIBIT 24: PHASE III USES AND SOURCES OF FUNDS
EXHIBIT 25: PHASE IV USES AND SOURCES OF FUNDS
USES - Development Costs Total
Total Acquisition 6,451,203$
Total Construction 63,790,505$
Total Construction Financing 3,901,462$
Total Soft Costs 13,989,306$
Total Permanent Financing 469,082$
Total Reserves 930,000$
Total Development Fees4% 3,730,482$
Total Development Cost 93,262,041$
SOURCES - Development Financing Proposed
Funding
Equity
Equity - Owner(s) (Land/Building) 6,451,203$
Equity - Owner Other 26,190,511$
Debt
1st Mortgage (Conventional) 60,620,326
Total Financing/Equity: 93,262,041$
PARCEL C - Estimated Development Costs
USES - Development Costs Total
Total Acquisition 22,990,209$
Total Constrcution 131,052,757$
Total Construction Financing 8,026,981$
Total Soft Costs 23,573,569$
Total Permanent Financing 980,036$
Total Reserves 1,965,000$
Total Development Fees 4% 7,857,856$
Total Development Cost 196,446,408$
SOURCES - Development Financing Proposed
Funding
Equity
Equity - Owner(s) (Land/Building) 22,990,209$
Equity - Owner Other 45,766,034$
Debt
1st Mortgage (Conventional) 127,690,166
Total Financing/Equity: 196,446,408$
PARCEL B - Estimated Development Costs
USES - Development Costs Total
Total Acquisition 30,536,388$
Total Construction 205,348,799$
Total Construction Financing 18,139,144$
Total Soft Costs 47,927,656$
Total Permanent Financing 1,600,012$
Total Reserves 3,185,000$
Total Development Fees 4% 12,780,708$
Total Development Cost 319,517,708$
SOURCES - Development Financing Proposed
Funding
Equity
Equity - Owner(s) (Land/Building) 19,541,086$
Equity - Owner Other 92,290,112$
Debt
1st Mortgage (Conventional) 207,686,511
Total Financing/Equity: 319,517,708$
PARCELS D, E and F - TOTAL DEVELOPMENT COSTS
USES - Development Costs Total
Total Acquisition 11,157,021$
Total Construction 42,193,057$
Total Construction Financing 3,727,053$
Total Soft Costs 15,322,598$
Total Permanent Financing 383,740$
Total Reserves 765,000$
Total Development Fees 4% 3,064,520$
Total Development Cost 76,612,988$
SOURCES - Development Financing Proposed
Funding
Equity
Equity - Owner(s) (Land/Building) 10,002,304$
Equity - Owner Other 16,812,242$
Debt
1st Mortgage (Conventional) 49,798,442
Total Financing/Equity: 76,612,989$
PARCEL A - TOTAL DEVELOPMENT COSTS
50 UNIVERSITY OF MARYLAND
PHASE I - BREAKDOWN
We’ve positioned the office high-rise on Parcel C nearest the Metro station to justify charging new office
rents in an effort to minimize risk and increase yield for this portion of development. The office high-rise will
include 114 parking spaces and 11,149 square feet of first floor retail space along with the 355,566 square
feet of office space. The total development cost for Phase 1 is over $93,000,000.
The office high-rise is the first building constructed, and we are projecting lease-up activity over the course of
24 months. There will be a flurry of pre-leasing activity given the building’s proximity to the Metro and the
unique arch built within the building to draw retail tenants. We project that all the retail and three floors of
office will be pre-leased with full occupancy on December 31, 2019. The follow leasing factors have been
taken into consideration is shown in Exhibit 26.
EXHIBIT 26: LEASING CONCESSION FACTORS
In Phase I, adjacent parking is available in existing surface lots. As a result, we show parking with this building
contributing to NOI towards the end of the two year lease-up period.
A detailed financial breakdown of the first two years of operation during lease-up is given in Exhibit 27.
EXHIBIT 27: TWO YEAR LEASE-UP PROJECTION
(See Appendix V.1 for full chart – Phase I Lease-up Schedule)
Tenant Improvement Allowance 15.00%
Free Rent Impact 10.00%
Other Concessions 2.00%
2018 1ST YEAR LEASE UP SCHEDULE January June December Total
UNITS/FLOORS LEASED PER MONTH:
RENTAL INCOME: 417,477$ 770,498$ 909,722$ 8,697,401$
Total Potential Income 1,553,023$ 1,553,023$ 1,553,023$ 18,636,276$
EFFECTIVE GROSS REVENUE: 417,477$ 770,498$ 909,722$ 8,697,401$
TOTAL OPERATING EXPENSES: 442,937$ 442,937$ 442,937$ 5,315,242$
NET OPERATING INCOME (NOI): 220,822$ 478,528$ 580,161$ 5,341,873$
2019 2ND YEAR LEASE UP SCHEDULE January June December Total
UNITS/FLOORS LEASED PER MONTH:
RENTAL INCOME: 956,129$ 1,191,477$ 1,553,023$ 14,894,618$
Total Potential Income 1,553,023$ 1,553,023$ 1,553,023$ 18,636,276$
EFFECTIVE GROSS REVENUE: 956,129$ 1,191,477$ 1,553,023$ 14,894,618$
TOTAL OPERATING EXPENSES: 442,937$ 442,937$ 442,937$ 5,315,242$
NET OPERATING INCOME (NOI): 614,039$ 569,819$ 877,133$ 4,550,599$
51 UNIVERSITY OF MARYLAND
Exhibit 28 shows the construction draw schedule for the two years of construction. It is assumed that the
draws are equally divided over 24 months with 10% retainage paid in the final month of construction leading
up to substantial completion.
EXHIBIT 28: PHASE I CONSTRUCTION DRAW
(See Appendix V.2 for full chart – Phase I Construction Draw)
A detail financial analysis for the first 10 years of operation following lease-up has been created for this report.
Below, Exhibits 29 through 34 detail this analysis. For the income and expense state, an annual rental increase of 3%
and annual expense increase of 3.25% has been factored into the projection with a 5.25% vacancy and concession
rate.
EXHIBIT 29: PHASE I BASIS & DEPRECIATION BREAKDOWN
(See Appendix V.3 for full chart – Phase I Basis & Depreciation Breakdown)
EXHIBIT 30: INCOME & EXPENSE STATEMENT
Phase I
CONSTRUCTION DRAW SCHEDULE
Construction Months: 24
Construction Loan: 63,790,505$
Loan Origination: 0.50% 318,953$
Rate: 6.75%
Retainage: 10.00%
Month Draw Retainage Net Draw Balance Interest
Jan-16 2,416,307$ (241,631)$ 2,174,676$ 2,174,676$ 12,233$
Dec-16 2,416,307$ (241,631)$ 2,174,676$ 26,096,116$ 146,791$
Dec-17 8,215,444$ 2,657,938$ 13,772,950$ 63,790,505$ 212,031$
TOTALS 63,790,505$ 63,790,505$ 3,582,510$
Uses (Non Basis) Commercial 7 - Year Amortize
TDC Basis Expense Depreciable Depreciation (Expense)
Total Development Cost 90,226,732$ 89,050,196$ 7,236,203$ 82,598,993$ -$ 391,535$
INCOME & EXPENSE STATEMENT Year 1 Year 5 Year 10
Period Beginning Date Jan-20 Jan-24 Jan-29
Period Ending Date Dec-20 Dec-24 Dec-29
TOTAL POTENTIAL RENTAL INCOME: 19,195,364$ 21,604,552$ 25,045,597$
Vacancy & Credit Loss 978,404$ 1,101,203$ 1,276,596$
EFFECTIVE RENTAL INCOME: 18,216,960$ 20,503,349$ 23,769,001$
GROSS OPERATING INCOME: 18,216,960$ 20,503,349$ 23,769,001$
TOTAL OPERATING EXPENSES: 7,609,570$ 8,648,093$ 10,147,771$
NET OPERATING INCOME (NOI): 10,607,390$ 11,855,256$ 13,621,230$
52 UNIVERSITY OF MARYLAND
(See Appendix V.4 for full chart – Phase I Income & Expense Statement)
EXHIBIT 31: PHASE I MORTGAGE & DEPRECIATION SCHEDULE
(See Appendix V.5 for full chart – Phase I Mortgage & Depreciation Schedule
Exhibit 32 determines both the before and after tax sale proceed returns. It also accounts for accumulated
depreciation at time of sale and the block’s adjusted basis. A 6 percent capitalization rate is used to determine the
sales price.
EXHIBIT 32: PHASE I SALES SCHEDULE
(See Appendix V.6 for full chart – Phase I Sales Schedule)
Year 1 Year 5 Year 10
Period Beginning Date: Jan-20 Jan-24 Jan-29
Period Ending Date: Dec-20 Dec-24 Dec-29
1st Mortgage Calculation
Yearly Principal Reduction 1,126,026$ 1,388,517$ 1,804,284$
Yearly Interest Expense 2,541,206$ 2,278,715$ 1,862,948$
Commercial Cost Recovery (Depreciation) Calculation 39 Year Straight Line
Beginning Balance 78,363,147$ 69,891,456$ 59,301,841$
Remaining Book Value 76,245,224$ 67,773,533$ 57,183,918$
Total Annual Cost Recovery 2,117,923$ 2,117,923$ 2,117,923$
Amortization
Ending Balance 344,551$ 281,905$ 203,598$
Sale Schedule Year 1 Year 5 Year 10
Jan-20 Jan-24 Jan-29
Period Beginning Date Cap Rate Dec-20 Dec-24 Dec-29
Period Ending Date 6.00%
= Total Sale Proceeds Before Tax 118,393,332$ 143,086,387$ 178,899,692$
= Sales Proceeds After Tax 95,964,614$ 115,206,324$ 143,309,246$
Calculations
Acquisition Basis 89,050,196$ 89,050,196$ 89,050,196$
+ Capital Additions -$ -$ -$
- Cost Recovery 4,235,846$ 4,235,846$ 4,235,846$
= Adjusted Basis 84,814,351$ 84,814,351$ 84,814,351$
Sales Price 176,789,836$ 197,587,601$ 227,020,502$
- Cost of Sale 10,607,390$ 11,855,256$ 13,621,230$
- Adjusted Basis 84,814,351$ 84,814,351$ 84,814,351$
= Total Gain 81,368,096$ 100,917,994$ 128,584,921$
53 UNIVERSITY OF MARYLAND
EXHIBIT 33: PHASE I 10 YEAR FINANCIAL STATEMENT
(See Appendix V.7 for full chart – Phase I Financial Statement)
EXHIBIT 34: PHASE I BEFORE-TAX, AFTER-TAX AND UNLEVERAGED IRR AND NPV
(See Appendix V.8 for full chart – Phase I Before-Tax, After-Tax and Unleveraged IRR and NPV)
ANNUAL CASH FLOW ANALYSIS
Net Operating Income 10,607,390$ 11,855,256$ 13,621,230$
- Annual Debt Service 3,667,232$ 3,667,232$ 3,667,232$
= Cash Flow Before Tax 6,940,158$ 8,188,024$ 9,953,998$
- Less Tax Liability 2,432,366$ 3,051,612$ 3,946,126$
Cash Flow After Tax 4,507,792$ 5,136,412$ 6,007,872$
Debt Service Coverage Ratio: 2.89 3.23 3.71
Internal Rate of Return Before Tax: 24.11%
Before Tax Net Present Value: 28,434,588$
Internal Rate of Return After Tax: 20.51%
After Tax Net Present Value: 14,954,679$
Unleveraged Internal Rate of Return: 16.41%
Unleveraged Net Present Value: 7,685,446$
Parc 7 at Greensboro Station

More Related Content

Similar to Parc 7 at Greensboro Station

Land h+development+ +110110+(1)
Land h+development+ +110110+(1)Land h+development+ +110110+(1)
Land h+development+ +110110+(1)Cynthia Frost
 
Request for Proposal City of Sudbury
Request for Proposal City of SudburyRequest for Proposal City of Sudbury
Request for Proposal City of SudburyRaquel Shirazi
 
SBS Retail Brochure Magazine 2015.1
SBS Retail Brochure Magazine 2015.1SBS Retail Brochure Magazine 2015.1
SBS Retail Brochure Magazine 2015.1Joyce Reweda
 
ROSSETTI Sports + Community Design
ROSSETTI Sports + Community DesignROSSETTI Sports + Community Design
ROSSETTI Sports + Community DesignAshley Venturini
 
The Square at Broadway Place
The Square at Broadway PlaceThe Square at Broadway Place
The Square at Broadway PlaceRLEST8Meg
 
University of Missouri HEEF Real Estate Proposal
University of Missouri HEEF Real Estate ProposalUniversity of Missouri HEEF Real Estate Proposal
University of Missouri HEEF Real Estate ProposalJoshua Vaslie
 
MODE_Sector-Brochure_UrbanDesign&MasterPlanning_V2_Email
MODE_Sector-Brochure_UrbanDesign&MasterPlanning_V2_EmailMODE_Sector-Brochure_UrbanDesign&MasterPlanning_V2_Email
MODE_Sector-Brochure_UrbanDesign&MasterPlanning_V2_EmailRhonan OBrien
 
Urban Design Portfolio Tim Hays
Urban Design Portfolio Tim HaysUrban Design Portfolio Tim Hays
Urban Design Portfolio Tim HaysTim Hays
 
Historic West End Initiative - November 2017 Community Meeting
Historic West End Initiative - November 2017 Community Meeting Historic West End Initiative - November 2017 Community Meeting
Historic West End Initiative - November 2017 Community Meeting Alysia Osborne, AICP
 
OCR: Fairfax County Revitalization Program
OCR: Fairfax County Revitalization ProgramOCR: Fairfax County Revitalization Program
OCR: Fairfax County Revitalization ProgramFairfax County
 
The Evolving City of Los Angeles (Robert Jernigan) - ULI fall meeting - 102711
The Evolving City of Los Angeles (Robert Jernigan) - ULI fall meeting - 102711The Evolving City of Los Angeles (Robert Jernigan) - ULI fall meeting - 102711
The Evolving City of Los Angeles (Robert Jernigan) - ULI fall meeting - 102711Virtual ULI
 
From Vision to Reality Storrs Center
From Vision to Reality Storrs CenterFrom Vision to Reality Storrs Center
From Vision to Reality Storrs Centersneapa
 
mblj_Lee Rong Huan_3S1_31
mblj_Lee Rong Huan_3S1_31mblj_Lee Rong Huan_3S1_31
mblj_Lee Rong Huan_3S1_31Projectsss
 
ndmarkCenterProject-Narrative&FinancialSummary(02-18-15)
ndmarkCenterProject-Narrative&FinancialSummary(02-18-15)ndmarkCenterProject-Narrative&FinancialSummary(02-18-15)
ndmarkCenterProject-Narrative&FinancialSummary(02-18-15)henry gala
 
Strategic plan poster final
Strategic plan poster finalStrategic plan poster final
Strategic plan poster finalVanessa Baratta
 
Historic West End Initiative - February 2018 Community Meeting
Historic West End Initiative - February 2018 Community MeetingHistoric West End Initiative - February 2018 Community Meeting
Historic West End Initiative - February 2018 Community MeetingAlysia Osborne, AICP
 
Activity Centers Strategy - Council draft mins report 20-07-15
Activity Centers Strategy - Council draft mins report 20-07-15Activity Centers Strategy - Council draft mins report 20-07-15
Activity Centers Strategy - Council draft mins report 20-07-15Stonnington
 

Similar to Parc 7 at Greensboro Station (20)

DRA general quals
DRA general qualsDRA general quals
DRA general quals
 
DRA_General_Quals
DRA_General_QualsDRA_General_Quals
DRA_General_Quals
 
Land h+development+ +110110+(1)
Land h+development+ +110110+(1)Land h+development+ +110110+(1)
Land h+development+ +110110+(1)
 
Request for Proposal City of Sudbury
Request for Proposal City of SudburyRequest for Proposal City of Sudbury
Request for Proposal City of Sudbury
 
SBS Retail Brochure Magazine 2015.1
SBS Retail Brochure Magazine 2015.1SBS Retail Brochure Magazine 2015.1
SBS Retail Brochure Magazine 2015.1
 
ROSSETTI Sports + Community Design
ROSSETTI Sports + Community DesignROSSETTI Sports + Community Design
ROSSETTI Sports + Community Design
 
The Square at Broadway Place
The Square at Broadway PlaceThe Square at Broadway Place
The Square at Broadway Place
 
University of Missouri HEEF Real Estate Proposal
University of Missouri HEEF Real Estate ProposalUniversity of Missouri HEEF Real Estate Proposal
University of Missouri HEEF Real Estate Proposal
 
MODE_Sector-Brochure_UrbanDesign&MasterPlanning_V2_Email
MODE_Sector-Brochure_UrbanDesign&MasterPlanning_V2_EmailMODE_Sector-Brochure_UrbanDesign&MasterPlanning_V2_Email
MODE_Sector-Brochure_UrbanDesign&MasterPlanning_V2_Email
 
Urban Design Portfolio Tim Hays
Urban Design Portfolio Tim HaysUrban Design Portfolio Tim Hays
Urban Design Portfolio Tim Hays
 
Historic West End Initiative - November 2017 Community Meeting
Historic West End Initiative - November 2017 Community Meeting Historic West End Initiative - November 2017 Community Meeting
Historic West End Initiative - November 2017 Community Meeting
 
OCR: Fairfax County Revitalization Program
OCR: Fairfax County Revitalization ProgramOCR: Fairfax County Revitalization Program
OCR: Fairfax County Revitalization Program
 
The Evolving City of Los Angeles (Robert Jernigan) - ULI fall meeting - 102711
The Evolving City of Los Angeles (Robert Jernigan) - ULI fall meeting - 102711The Evolving City of Los Angeles (Robert Jernigan) - ULI fall meeting - 102711
The Evolving City of Los Angeles (Robert Jernigan) - ULI fall meeting - 102711
 
From Vision to Reality Storrs Center
From Vision to Reality Storrs CenterFrom Vision to Reality Storrs Center
From Vision to Reality Storrs Center
 
mblj_Lee Rong Huan_3S1_31
mblj_Lee Rong Huan_3S1_31mblj_Lee Rong Huan_3S1_31
mblj_Lee Rong Huan_3S1_31
 
Graphic & Design
Graphic & DesignGraphic & Design
Graphic & Design
 
ndmarkCenterProject-Narrative&FinancialSummary(02-18-15)
ndmarkCenterProject-Narrative&FinancialSummary(02-18-15)ndmarkCenterProject-Narrative&FinancialSummary(02-18-15)
ndmarkCenterProject-Narrative&FinancialSummary(02-18-15)
 
Strategic plan poster final
Strategic plan poster finalStrategic plan poster final
Strategic plan poster final
 
Historic West End Initiative - February 2018 Community Meeting
Historic West End Initiative - February 2018 Community MeetingHistoric West End Initiative - February 2018 Community Meeting
Historic West End Initiative - February 2018 Community Meeting
 
Activity Centers Strategy - Council draft mins report 20-07-15
Activity Centers Strategy - Council draft mins report 20-07-15Activity Centers Strategy - Council draft mins report 20-07-15
Activity Centers Strategy - Council draft mins report 20-07-15
 

Parc 7 at Greensboro Station

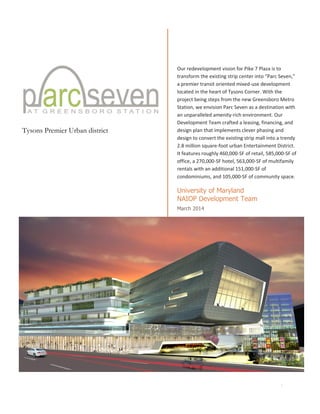
  • 1. I Tysons Premier Urban district Our redevelopment vision for Pike 7 Plaza is to transform the existing strip center into “Parc Seven,” a premier transit oriented mixed-use development located in the heart of Tysons Corner. With the project being steps from the new Greensboro Metro Station, we envision Parc Seven as a destination with an unparalleled amenity-rich environment. Our Development Team crafted a leasing, financing, and design plan that implements clever phasing and design to convert the existing strip mall into a trendy 2.8 million square-foot urban Entertainment District. It features roughly 460,000-SF of retail, 585,000-SF of office, a 270,000-SF hotel, 563,000-SF of multifamily rentals with an additional 151,000-SF of condominiums, and 105,000-SF of community space. University of Maryland NAIOP Development Team March 2014
  • 3. Acknowledgements Much appreciation and many thanks to everyone on the team who worked hard and contributed many hours to the creation of this report and provided invaluable insight: Chau Pham Development Team Aaron Loeb Amy Weber Ryan Smyth Samuel Vana Tyler Krehbiel Taylor Cooper Tatiana Joseph Meghan Walsh Timur Ryspekov Anthony Notarfrancesco
  • 5. TABLE OF CONTENTS I. Project Summary.................................................................................................... 8 Strategy...............................................................................................................................................................10 Site Plan ..............................................................................................................................................................11 II. Site Analysis ..........................................................................................................12 Location...............................................................................................................................................................12 Traffic and Mobility..........................................................................................................................................12 Zoning/Regulatory Conditions.......................................................................................................................14 Community Interests .......................................................................................................................................14 III. Development Plan and Design ..............................................................................15 Traffic, Circulation and Parking .....................................................................................................................15 Architecture and Landscape...........................................................................................................................19 LEED .....................................................................................................................................................................21 IV. Market Analysis.................................................................................................... 22 National Economy.............................................................................................................................................22 Local Conditions................................................................................................................................................22 Market Overview..............................................................................................................................................26 Market.................................................................................................................................................................27 Office Market ....................................................................................................................................................................27 Retail Market.....................................................................................................................................................................29 Housing Market ................................................................................................................................................................31 Hotel Market .....................................................................................................................................................................34 Civic Center........................................................................................................................................................................34 V. Financial Analysis ................................................................................................. 36 Introduction .......................................................................................................................................................36 Acquisitions........................................................................................................................................................36 Assumptions.......................................................................................................................................................37 Phasing................................................................................................................................................................54 Phase I.................................................................................................................................................................................55 Phase II................................................................................................................................................................................56 Phase III...............................................................................................................................................................................57 Phase IV ..............................................................................................................................................................................58 Project Schedule ...............................................................................................................................................59 VI. Appendices........................................................................................................... 60 I. Team Members........................................................................................................................................60 II. Site Analysis Supplement ...................................................................................................................62 III. Design Supplement..............................................................................................................................64 IV. Market Supplement.............................................................................................................................70 V. Financial Supplement..........................................................................................................................72 VII. Faculty Advisor....................................................................................................................................108 VIII. Consultants..........................................................................................................................................109
  • 7. UNIVERSITY OF MARYLAND Colvin Institute of Real Estate Development School of Architecture, Planning & Preservation The 2014 NAIOP Capital Challenge Maryland/DC Intercollegiate Real Estate Case Competition
  • 8. 8 UNIVERSITY OF MARYLAND PROJECT SUMMARY Being Located in Tysons Corner, Virginia; Parc Seven will be an exciting transit oriented mixed-use development, abutted by the new Silver Line Metro Station known as Greensboro. Envisioning a destination with an unparalleled amenity-rich environment, our Development Team crafted a leasing, financing, and design plan that implements clever phasing and design to convert the existing strip mall into a 2.8 million square-foot urban district. This new development will contain 6 individual blocks that will support a mixture of office, retail, entertainment, civic, and living options. Parc Seven features roughly 460,000-SF of retail, 585,000-SF of office, a 270,000-SF hotel, 563,000-SF of multifamily rentals with an additional 151,000-SF of condominiums, 47,000-SF of community civic space, and nearly 60,000-SF of open space that includes; an urban plaza designated by a grand arch connecting Parc Seven users to the metro, a large outdoor park that will support events and provide outdoor seating to our premier food market and open-air cafés. Rapidly transforming Tysons Corner and our project will appeal to the next generation of office users and residents who prefer mass transit and an amenity rich urban lifestyles. Total Development Costs $685,839,146 ($240.88 PSF) Total Equity $240,043,701 (35%) Total Debt $445,795,445 (65%) Project Program 2,864,529 GSF Retail 254,473 GSF Entertainment 204,200 GSF Office 584,846 GSF Hotel (250-Key) 270,738 GSF (750-SF per room) Residential – Rental 562,739 GSF (550 Units) Condominiums 150,983 GSF (120 units) Civic Space 46,831 GSF Park Space 24,000 GSF Urban Plaza 33,443 GSF Subterranean Gallery Walk 17,300 GSF Infrastructure 200,653 GSF Parking 514,123 GSF (2,116 Spaces) Overall Project Construction Timeline 129 Months (10 years, 3 months) Phasing Four Phases (5-years each) Start Preconstruction July 2014 Project Delivery March 2025 Loan Request $445,795,445 Requested Terms 65% LTV, 5.25%, 25-yr term, non-recourse, 1.25 DCR Investor Returns Entire Project After-Tax Sale Proceeds (Yr-10) $605,976,130 Leveraged ATCF IRR 25.52% Leveraged BTCF IRR 27.07% Unleveraged ATCF IRR 19.39% Profit (Yr-1) $52,661,104 ROI (1st Full Year) 21.9% TOTAL PROJECT BREAKDOWN
  • 9. 9 UNIVERSITY OF MARYLAND Phase I (Block “C”) Total Development $93,262,041 ($240.88 PSF) Total Equity $32,641,714 (35%) Total Debt $60,620,326 (65%) Use Program 394,994 GSF Office 355,566 Retail 11,149 Parking 27,619 (114 spaces) Construction Timeline 52 Months (5-years) Start Preconstruction July 2014 Construction January 2015 Lease-up Start June 2016 Delivery May 2019 . Investor Returns After-Tax Sale (Yr-10) $135,066,502 Leveraged BTCF IRR 22.20% Leveraged ATCF IRR 18.94% Unleveraged ATCF IRR 14.58% Profit (Yr-1) $4,089,717 Phase III (Block “D”,”E” & “F”) Total Development $93,262,041 ($240.88 PSF) Total Equity $32,641,714 (35%) Total Debt $60,620,326 (65%) Use Program 1,135,404 GSF Condominiums 150,983 (120 units) Apartments 562,739 (550 units) Retail 164,505 Parking 257,177 (1,058 spaces) Construction Timeline 52 Months (5-years) Start Preconstruction July 2018 Construction January 2020 Lease-up Start April 2021 Delivery March 2023 Investor Returns After-Tax Sale (Yr-10) $325,217,966 Leveraged BTCF IRR 19.72% Leveraged ATCF IRR 14.27% Unleveraged ATCF IRR 10.71% Profit (Yr-1) $4,547,107 Phase II (Block “B” & demo “A” & “F” for parking) Total Development $93,262,041 ($240.88 PSF) Total Equity $32,641,714 (35%) Total Debt $60,620,326 (65%) Use Program 778,404 GSF Office 229,280 Retail 119,310 Hotel 270,738 (250 Key) Parking 27,619 (655 spaces) Construction Timeline 52 Months (5-years) Start Preconstruction July 2016 Construction January 2018 Lease-up Start May 2019 Delivery April 2021 Investor Returns After-Tax Sale (Yr-10) $213,555,321 Leveraged BTCF IRR 19.89% Leveraged ATCF IRR 16.37% Unleveraged ATCF IRR 31.39% Profit (Yr-1) $5,986,521 Phase IV (Block “A”) Total Development $93,262,041 ($240.88 PSF) Total Equity $32,641,714 (35%) Total Debt $60,620,326 (65%) Use Program 280,987 GSF Civic 46,831 Retail 163,909 Parking 70,247 (289 spaces) Construction Timeline 52 Months (5-years) Start Preconstruction June 2020 Construction January 2022 Lease-up Start April 2023 Delivery March 2025 Investor Returns After-Tax Sale (Yr-10) $83,864,507 Leveraged BTCF IRR 23.06% Leveraged ATCF IRR 14.71% Unleveraged ATCF IRR 29.28% Profit (Yr-1) $2,124,458 PROJECT PHASING BREAKDOWN
  • 10. 10 UNIVERSITY OF MARYLAND STRATEGY Unique to Our Project:  Phased site development plan crafted to mitigate risk and breakdown project into financially independent subdivided blocks that allow for market driven fluidity in use programming  Strategic phasing enables property to generate operating income over 5½-year period totaling about $25m  Robust development plan delivers high density which creates critical mass to ensure our specialized mix of uses are activated  Active 24/7 environment  Pedestrian-focused infrastructure that promotes traffic calming and walkability  Unique architectural features lend to the sites placemaking and character by capitalizing on our sites unique features and frame view corridors (the “Parc Seven Archway", main project gateway, urban plazas, and unique art installations)  The 47,000-SF “Tetrault Science and Learning Center” will serve as a destination for Northern Virginia’s new Science Center, IMAX Theater, and public exhibition space.  The 17,300-SF “Grove Market” provides local healthy food options to fill void in market and create a strong draw within the community  The 17,000-SF subterranean “Gallery Walk” will exhibit year-round art installations, artisan markets, and community events that provide a cultural draw  Phased urban retail strategy integrating a focused merchant offering that will support a mix of national and local retailers at the “Shoppes at Parc Seven”  Will become Tyson’s premier “Entertainment District” featuring over 200,000-SF of offerings  Class-A office with close proximity to a variety of retail, public spaces, housing, and entertainment options with accessibility to metro will draw the next generation of high-tech office users  200-Key Luxury Boutique Hotel — a perfect marriage between design, art, and technology Our site’s proximity to the metro is a catalyst for high density transit-oriented development (TOD) to replace the currently underutilized suburban retail center. Our strategy is to reposition the site into an Entertainment District with a dense urban retail core surrounded by complementary secondary uses such as multifamily rentals, condos, class-A office, a boutique hotel, and attractive public space. The combination of metro access, expressive architecture, vibrant retail, tech friendly office, stylish hotel and a new science center are the elements that make Parc Seven unique among other existing and proposed developments in Tysons Corner.
  • 11. 11 UNIVERSITY OF MARYLAND SITE PLAN Figure 1.1 - Proposed Conceptual Site Plan for Parc Seven and Designated Blocks. Figure 1.2 - Proposed Phasing Plan. Phase One – Office, Parc Seven Archway, Retail, & Parking Phase Two – Office, Retail, Entertainment Options, Hotel, & Parking Phase Three – Apartments, Condos, Retail, Road Infrastructure, Grove Market, Subterranean Gallery Walk, & Parking Phase Four – Tetrault Civic Center, Retail, & Parking
  • 12. 12 UNIVERSITY OF MARYLAND SITE ANALYSIS LOCATION The property, Pike 7 Plaza is located in the southern portion of the Tysons Central District. The address, 8350 Leesburg Pike, Vienna Virginia, is at the intersection of Leesburg Pike and Gosnell Road (Figure 1). It is less than a mile from Tysons Galleria, and within one fourth of a mile of the new Greensboro Metro Station on the Silver Line. Pike 7 Plaza is 12.8 acres, and currently holds a suburban retail center, facing Leesburg Pike. To the west of the site are residential neighborhoods and to the northeast and southwest are retail uses. Figure 1.3 Map locating project site. Image Source Underlay: Google Maps. TRAFFIC AND MOBILITY Leesburg Pike is the primary roadway providing vehicular access to the site. It connects to the Capital Beltway I-495 and the greater Washington Metropolitan Area, and to the Dulles Access Road 267 which leads to the Dulles International Airport. It is also convenient to I-66 which links to Arlington and Washington, D.C. on the east and Fairfax on the west. The secondary access to the site is via Gosnell Street, which intersects Route 123 and Westpark Drive linking to the Tysons Galleria. From Dulles Toll Road to Tysons Corner, Leesburg Pike has an Average Daily Traffic (ADT) count of 61,000 automobile trips. This high ADT count makes this site desirable. However, the steep topography blocks much of the retails’ visibility from the road (Figure 4). The majority of the site is blocked by the highway and cannot be seen easily from vehicles going north on Leesburg Pike (Figure 6). There is better visibility for vehicles driving southward, which is why acquiring the plot of land in the northern corner is
  • 13. 13 UNIVERSITY OF MARYLAND essential. This lot will allow us to place an architecturally unique landmark, the STEM Civic Center, on the north-most corner of the site to capture the attention to the site. The corner must be treated as a vehicular landmark/gateway for drivers. Figure 4. View 1 from Leesburg Pike driving north. Figure 6. View 2 from Leesburg driving south. The southeast corner of the site is closest to the Greensboro metro station, which makes it the natural gateway for pedestrians. Residents and visitors will enter the site through an arch which is an architectural feature of the office building above. Tysons Corner is currently an auto-oriented suburban area. Approximately eighty percent of commuters drive to work. Eight percent of commuters use public transportation, three percent walk and two percent use a taxicab, motorcycle, bicycle, or other means. Our transit-oriented development will help reduce automobile dependency and encourage multi-modal connectivity. Figure 5. Map of site, showing vehicular movement & viewpoints.
  • 14. 14 UNIVERSITY OF MARYLAND ZONING/REGULATORY CONDITIONS The site is currently zoned C-7 Commercial District. However, the Planned Tysons Corner Urban District or PTC District is defined in the adopted Comprehensive Plan to implement a larger mix of uses and densities to transform Tysons from a suburban office park into an urban, mixed-use, transit oriented, bicycle and pedestrian oriented community. We plan to rezone the property and have accounted for this additional lead-time in the project schedule. Parc Seven is structured to take advantage of this new zoning district that encourages the highest densities closest to the transit station. The site is located within one-quarter mile of the station, informing our strategy for development. Block C, the closest to the Metro, will be a 355,570 sf, 16 story office tower. Moving north on Leesburg Pike will be an 11-story hotel, attached to a 10-story office building (Building B), and a 4 story civic center (Building A). The southern portion of the site includes Building F, 8 stories of condominiums. Buildings E and D are apartment buildings at 8 and 6 stories, respectively. COMMUNITY INTERESTS The community of Tysons Corner would like to see a transformation of the region. It is currently dominated by the car and very suburban in nature. There is a push to create more walkability and a grid of streets. The anticipation of Metro has been a driver for this type of development. There is support from the community to increase the amount of green space and utilize public transportation as a means of travel. Tysons Corner is seeing a mix of uses and an increase in density. The Board of Supervisors in Fairfax County suggested that the sub district of our proposed development would be ideal for a museum or other arts and education related use. Our development plan is in line with these interests and addresses the goals of the community for the future of Tysons Corner. We intend to proactively engage with the community throughout the duration of the project to ensure a mutually beneficial environment to facilitate the transformation of Tysons Corner. There is a drive in Tysons Corner to facilitate growth in the technology research market. By incorporating a science and technology museum in the civic building, Parc Seven will be at the forefront of this trend. Not only will the residents be able to lead the technology sector through research and development, but also exhibit their work in the museum for others to discover. Exhibitions curated in the museum will be geared towards this theme.
  • 15. 15 UNIVERSITY OF MARYLAND DEVELOPMENT PLAN AND DESIGN TRAFFIC, CIRCULATION AND PARKING Overview Our proposed development for Parc Seven will increase density, which will stimulate property values in the surrounding areas. Taking advantage of this increased value can create enough revenue to pay for the entire projects infrastructure improvements.1 Economic analysis shows that introducing high levels of residences into the heart of “Edge Cities”, like Parc Seven, can create balanced lively communities that actually experience reduced traffic congestion. Our community can generate added wealth that supports a wide variety of amenities and activities including; an upgraded sensitively designed transit system.2 Parc Seven has good auto access but no residents and amenities other than retail. To balance the flow in and out of the project throughout the day; residential units, office, entertainment options, hotel, public gathering space and placemaking elements should be added. This will add more transit riders throughout the day and ultimately reduce dependence on the automobile with the opening of Greensboro Station.3 If implemented correctly, this development can pay for future public improvements. Traffic The primary access to Pike 7 Plaza is Leesburg Pike, which connects to the Capital Beltway I-495. Leesburg Pike also intersects with Dulles Access Road 267 which leads to the Dulles International Airport. Connections to Arlington, Washington, D.C., and Fairfax is also possible via I-66. The secondary access to the site occurs from Gosnell Street entering from behind the site. Circulation Visitors driving to the site will arrive southward on Leesburg Pike, while those who arrive via the metro will arrive northward from Greensboro Metro station. Pedestrians and vehicles may also enter the site from Gosnell Street. In line with the Fairfax County Comprehensive Plan, the proposed development has additional roadways to increase the network of streets. Figure 8 shows a diagram comparing the current circulation network to the proposed network. Dividing the site into six blocks allows more roads, which increases connectivity to the larger network. The additional roads will also mitigate future traffic that occurs with new, dense development. According to the Fairfax County Comprehensive Plan, the current service road behind the site is planned to become an avenue. This means that the new development must also face what could be an avenue in the future. Another road running east-west of the site is proposed as the main street of the development, named Grove Street. This street will allow vehicular access in both directions, along with bike lanes. Street parking will be on both sides to act as a buffer between pedestrians and vehicles. To alleviate traffic into the site, there will be three other access roads from Leesburg Pike. Individuals may also enter from the proposed avenue behind the site. 1 Tysons Corner Collaborative. “Taming Tysons Corner – Transforming the Quintessential Edge City”, date NA. 2 Tysons Corner Collaborative. “Taming Tysons Corner – Transforming the Quintessential Edge City”, date NA. 3 Tysons Corner Collaborative. “Taming Tysons Corner – Transforming the Quintessential Edge City”, date NA.
  • 16. 16 UNIVERSITY OF MARYLAND Figure 1. The current circulation network vs. the proposed network. Mass Transit The development of Parc Seven will raise demand for arrival by mass transit. To increase the use of Metrorail for trips to, from and within Tysons, a system of circulators is proposed in the Fairfax County Comprehensive Plan 2013. One of the conceptual circulator routes runs through the site (Figure 2). This will conveniently bring transit users directly to the main street of the site.
  • 17. 17 UNIVERSITY OF MARYLAND Figure 2. Conceptual circulator. Source: Fairfax County Comprehensive Plan (2013). Cyclists and Pedestrians Pedestrian movement is paramount to the site’s success. Even though the site is considered “very walkable” with a walk score of 77/1004, it is not pedestrian friendly. The high score is due to the site’s proximity to resources and amenities that can be accomplished on foot. However, the site is geared towards vehicles, lacking safe pedestrian connections to the site. The walk along Leesburg Pike is unpleasant due to the immediacy of the sidewalk to high-speed traffic. In the proposed development, the pedestrian network is improved with more connections. Figure 10 diagrams the proposed pedestrian pathways, which are linked to the urban plazas at both entries, as well as the park within the development. Pedestrians coming from Greensboro Metro Station can enter through the southern gate arch into Parc Seven, which frames a view to the public art at the traffic circle. This guides pedestrians to Grove Street, connecting them to the park and urban plaza. 4 “Tysons corner Walk Score,” Walk Score, http://www.walkscore.com/score/8387-leesburg-pike-vienna-va-22182, accessed February 25, 2014.
  • 18. 18 UNIVERSITY OF MARYLAND Figure 3. Pedestrian movement The allowance for wide sidewalks gives room for trees and outdoor dining, ensuring pedestrian safety and accessibility. Grove Street has street parking to act as a buffer between pedestrians and vehicles (Appendix II.1 - “Site Analysis Supplement”). To keep cars from speeding, the speed limit will be low. The higher connectivity and pedestrian-friendly network will encourage higher foot traffic, which is desirable for retail and businesses. To encourage multi-modal transportation, bicycle lanes will be designated for every road throughout the development with connections to bike racks and storage facilities. The typical street plan diagram illustrates a variety of street sections featured in the development (Appendix II.2 - “Site Analysis Supplement”). Bicycle parking ratios recommended by the Fairfax Comprehensive Plan were used to determine the amount of bike racks needed shown in Appendix II. 3 - “Site Analysis Supplement”. Parking To alleviate traffic, there will be parking throughout the site at almost every block. This will make it convenient for both visitors and those who live or work in the development. The amount of parking spaces allocated is based on the required parking ratios listed in the Fairfax County Comprehensive Plan and the Fairfax Zoning Ordinance Article 11. The chart in Appendix II.4 - “Site Analysis Supplement” shows the required parking ratios for the site based on its proximity to the Greensboro Metro Station in comparison with requirements prior to the addition of the transit station. With the new metro station nearby, the public transit proximity would be great enough to reduce expected parking needs and lower costs.
  • 19. 19 UNIVERSITY OF MARYLAND With Fairfax County’s push towards lowering vehicular traffic into the area, there is currently no on-site parking allotted for Greensboro Metro Station. When the Silver Line opens, the only station with on-site parking lot will be Wiehle Avenue, in Reston, which will have 2,300 parking spaces. The closest station providing parking is the McLean Metro Station, which has a privately owned interim lot that accommodates 700 vehicles. The next closest metro station with on-site parking is West Falls Church Metro Station, which has 2,009 parking spaces and charges $4.75 per day.5 This rate will be charged for Parc Seven’s hourly rate parking. For the residential units, the rate will be $75 per month per vehicle. Parking must be charged to encourage people to use sustainable modes of transportation. ARCHITECTURE AND LANDSCAPE Design The plan embraces a boulevard through the site in accordance with the Fairfax County Comprehensive Plan’s proposed streets. This thoroughfare directs transit users through the southern arched threshold beneath the office building to the retail and entertainment offerings. This design is a hybrid of smart growth urban planning and energy-efficient architecture. The architectural features of the buildings contend with the high- tech, trendy focus for the development. Buildings Each building is wrapped with a mix of national and local retailers on the first two floors. The uses work in correlation to create harmonious daily experiences and a 24/7 environment. Block A The Civic Center is located at the northeastern point of the site and serves multiple functions, both in façade design and programming. The façade is prominent and unique to serve as an icon and notable approach to Parc Seven. The roof of the structure becomes a ramp at the ground level and invites pedestrians to the rooftop seasonal restaurant and breathtaking views. National tenant are highly visible from Leesburg Pike, drawing customers to the site. (See Appendix III.1 – “Tetrault Performing Arts Center Rendering”) Block B Parallel to Leesburg Pike, the hotel at Parc Seven accommodates 250 guest rooms. Featuring an expansive, but technologically engineered curtain wall system, the façade of the hotel is open and light filled while serving as noise insulation from the metro and busy road adjacent. The vibrant décor and sustainable architecture lend an innovative, creative vibe that invites travelers and visitors to work, connect, and play. (See Appendix III.2 – “Zetta Hotel Precedent”) 5 “West Falls Church-VT/UVA,” Washington Metropolitan Area Transit Authority, http://www.wmata.com, (February 25, 2014).
  • 20. 20 UNIVERSITY OF MARYLAND Block C Block C celebrates an architectural quality and technology beyond the 21st century. The southeastern gateway is a mix of tech-savvy office and retail. This building is open to pedestrians at the ground level featuring a voluminous 40-foot open-air, covered space surrounded by daily use retailers. Here, office users might converse over coffee or visitors might admire the art installations. This block also features the grand Archway into Parc Seven plaza—given the site its iconic name. This entrance was strategically designed to greet metro riders and guide them into the project. The archway also serves to frame the view corridors into the project and provide access to the subterranean “Grove Gallery Walk” (III.5 – Renderings of “Parc Seven Archway Entrance into the Project”). Blocks D and E Situated the furthest from Leesburg Pike, these residential buildings take full advantage of the privacy with large windows to the courtyards. Both buildings are lifted on a podium of retail, creating an elevated outdoor terrace for the residents. The massing of the two buildings is carved to accommodate the open air Grove Market and plaza space, allowing the Grove Market vendors to spill out on the plaza space for entertainment and community events. The high-end fitness center is strategically placed at the corner of Gosnell Road and Grove Street. Due to its location, the fitness center is also provided the opportunity to offer highly visible classes on the plaza space. (Appendix III.3 – “Grove Market and Apartment Rendering). Also being installed on this block is the entrance to the subterranean artist Gallery, “The Grove Gallery Walk” that terminates underground at the parking garage for Block “C’s” office building (see Appendix III.5 – “Grove Gallery Walk Renderings”). Block F Building F will consist of luxury condominiums overlooking the Circle at Parc Seven. It will include multi-level retail, connected by a pedestrian walkway for convenience to other amenities. This clock will also abut the Traffic Circle. (Appendix III.4 – View of Condominiums from Grove Traffic Circle”). Landscape, Site, Parking and Open Space. The existing conditions and site topography are used as an advantage to the basis of the site design. The elevation drop of 30 feet is embraced with structured parking on the first and second floors with access from Leesburg Pike, Grove Street and the secondary streets. While allowing for over 2,000 parking spaces, this design tucks away the structured garages from the public view. While the car is allowed on site, it is promptly directed to parking garage entrances along the outer roads. By keeping the car to the exterior, other modes of transportation are promoted to traverse the site. Where the car is allowed through the site, a variety of traffic calming strategies will be implemented in the final design of Parc Seven. This may include a transition of pavement that will suggest slower speeds are required and keep pedestrians as the focus. The public park located between Blocks D and E functions as an extension of Grove Market as well as a gathering space for entertainment. This space features hardscaping and landscaping that encourages an exchange of merchandise and ideas. A connection to the Grove Gallery Walk located in the park will encourage the community to experience the subterranean park and walkway. The 17,000-SF “Gallery Walk” will exhibit year-round art installations, artisan markets, and community events. (see Appendix III.5 – “Grove Gallery Walk Renderings”).
  • 21. 21 UNIVERSITY OF MARYLAND LEED The Fairfax County Comprehensive Plan indicates that new developments should be more sustainable than the Tysons Corner of today. The Department of Planning and Zoning in Fairfax County also requires certain levels of “green” certification to be approved. A widely accepted method of environmental measures is the U.S. Green Building Council’s Leadership in Energy and Environmental Design (LEED) program. The density of Parc Seven as well as other sustainable features in the site is expected to consume less energy than the current development, anticipating obtaining close to net-zero usage. Various design strategies, uses and goals for our site are estimated to certify the buildings of Parc Seven with a LEED Silver rating, or better. A LEED Scorecard has been provided in the Appendix that more fully communicates the sustainability of the development.
  • 22. 22 UNIVERSITY OF MARYLAND MARKET ANALYSIS NATIONAL ECONOMY Economic growth will strengthen in 2014, averaging 2.7% or better for the year.9 Economic indicators released since the last national update suggests the economy accelerated in the second half of 2013. The gains will come as business and consumer confidence strengthens and Europe begins to emerge from its long slumber, brightening overseas sales prospects. Increased business spending, growing consumer confidence, the continued housing renaissance and healthy export gains all add up to an increasingly strong economy, which will support net monthly hiring that could hit 200,000 new jobs.10 The December employment report from the Bureau of Labor Statistics (BLS) revealed mixed news on the state of the labor market. According to the Kiplinger Report, consumer spending and confidence is still way below normal levels by the standards of past economic expansions. As job growth returns and consumers feel more secure, a cycle of spending will create more consumer income that produces more spending. If this occurs in 2014, quarterly growth is likely to exceed an annualized pace of 3%. Retail sales will accelerate steadily in 2014, gaining between 5.2% and 5.7%, following a more modest 4.5% increase in 2013.11 A stronger economy, enjoying declining unemployment plus wage gains, will help. Sales in first-quarter 2014 are expected to top year-earlier figures by around 5.5%--nearly double the pace of growth seen at the close of the first quarter of 2013. In 2014, retail sales will also be sustained by about a 3% increase in personal income. In addition, consumers will have adapted to the 2013 increase in the payroll tax and will be no longer as hesitant to spend.12 LOCAL CONDITIONS Fairfax County had a population of about 1.12 million persons. Based on the current comprehensive plan, Fairfax County has the capacity to add an additional 300,000 residents over the next three to four decades. Over 44,000 of these residents are expected to be added by 2020. Although the number of older adults will grow faster than other age groups, children under 20 will continue to increase in number.13 They also have approximately 410,000 housing units, and about 400,000 households demonstrating an average household size of 2.76.14 Fairfax County is in the process of becoming a Metro-based market with new stations from Tysons Corner to Reston and further on to Dulles International opening in 2014. In terms of economic growth, competition in the office market from the west is not new, however it is likely to intensify as Tysons becomes a valid choice for companies and agencies seeking a Metro location along with a substantial supply of new office buildings 9 Kiplinger - http://www.kiplinger.com/tool/business/T019-S000-kiplinger-s-economic- outlooks/#VL3GrsbFp757YtAU.99 10 Kiplinger - http://www.kiplinger.com/tool/business/T019-S000-kiplinger-s-economic- outlooks/#VL3GrsbFp757YtAU.99 11 Bureau of Economic Analysis - http://www.bea.gov/newsreleases/national/pi/2014/pi1213.htm 12 Bureau of Economic Analysis - http://www.bea.gov/newsreleases/national/pi/2014/pi1213.htm 13 County of Fairfax, Virginia, “Responding Now and in the Future: Trends and Implications for Fairfax County Residents”. Oct 2013. 14 U.S. Census Bureau, 1970, 1980, 1990, 2000 and 2010 Decennial Censuses, 2001 to 2025 estimates and forecasts, Fairfax County Department of Neighborhood and Community Services
  • 23. 23 UNIVERSITY OF MARYLAND that will soon become available.15 Since 1980 the development of new office space in Tysons has been nearly equivalent to the amount of space developed in Arlington’s urban villages – 24.1 million square feet in Tysons vs. 27.5 million square feet in Arlington. The Silver Line will also connect Reston and Herndon to Metro with another 29.8 million square feet of office space resulting in a Silver Line office base larger than Arlington’s. The Council of Governments (COG) cooperative forecasts indicate that between 2005 and 2030, Tysons will see the most new jobs when compared to its neighbors at 50,400 new jobs capturing 4.3% of the region’s job growth, about 2% higher than the Rosslyn-Ballston and Jefferson Davis Corridors.16 Mixed-use developments built correctly—adding density and developing underutilized land—will increase property values in the surrounding areas, in some cases doubling or tripling in value. Tysons will be well positioned to use this added value to pay for infrastructure improvements as well as help fund the transit system.17 Economic analysis shows that introducing high levels of residences into the heart of Edge Cities can create balanced, lively communities with reduced traffic congestion. The community can generate added wealth that supports a wide variety of amenities, and activities, including an upgraded, more sensitively designed transit system.18 Edge Cities have good auto access and a large unemployment base but few residents. To balance the flow in and out of a community, the proportion of residential units should be increased. This will add more transit riders and ultimately reduce dependence on the automobile The total population in Tysons Corner was 19,627 in 2010. Of this, the average age was 35.8 years.20 In the census tract which Parc Seven exists the current population is 815 with a projected increase to 1,316 in the next 5 years.21 According to a study using the 2006-2010 American Community Survey Public Use Micro-data Sample (PUMS) the average in-migrant to Fairfax County was under the age of 30 and highly educated (Bachelor’s degree or higher). The average current resident is slightly older, but because of net in-migration, the area’s population is slightly younger. The chart below (Fairfax County Population by Age)22 echoes this trend. A combined average of 46% under the age of 35 is projected to continue through year 2030. While Tysons has a young population, 96.6 percent of residents have graduated high school23 (a large amount 15 Arlington Economic Development Research Paper. “Tysons and the Silver Line: Threat or Benefit?”, January 2012 16 Arlington Economic Development Research Paper. “Tysons and the Silver Line: Threat or Benefit?”, January 2012 17 Tysons Corner Collaborative. “Taming Tysons Corner – Transforming the Quintessential Edge City”, date NA. 18 Tysons Corner Collaborative. “Taming Tysons Corner – Transforming the Quintessential Edge City”, date NA. 20 2010 Demographic Profile 21 Fairfax County Department of Neighborhood and Community Services; Economic, Demographic and Statistical Research, 2013 22 U.S. Census Bureau and Fairfax County Department of Neighborhood and Community Services, Demographic Repots 2012 23 Educational Attainment, 2008 – 2012 American Community Survey 5-Year Estimates
  • 24. 24 UNIVERSITY OF MARYLAND being the in-migrants 25 years and older). 24 According to the Fairfax County Economic Development Authority, “Thirty-one percent of persons 25 and older in Fairfax County have a bachelor’s degree, and 27.5 percent have a graduate or professional degree—among the highest percentages in the United States. (U.S. Census Bureau)” 25 “Forecasts for the Washington metropolitan area, Northern Virginia and Fairfax County for population and jobs are shown in Figures 1 and 2 respectively. The metropolitan area is expected to grow from an estimated level of 5.4 million in 2010 to a forecast level of 8.3 million in 2050. Northern Virginia would grow from 2.4 million to 3.9 million, and Fairfax County would increase from 1.03 million to 1.56 million (intermediate forecast). Jobs would increase for 2010 to 2050 from 3.3 million to 5.7 million for the metropolitan area with Northern Virginia increasing from 1.4 million to 2.6 million, and Fairfax County from 680,000 to 1,280,000 (intermediate forecast) by 2050.”26 Households Tysons Corner will see a large increase in rental units in the coming years as Metro’s Silver Line attracts a more transient demographic that favors mixed-used developments. Projects within a ½ mile radius of a Metro station are prime locations for dense apartment complexes. Income The latest Census Bureau’s American Community survey ranked Fairfax County as one of the wealthiest counties in the nation. Median household and family income has just reached pre-recession levels and is 24 http://www.fairfaxcounty.gov/demogrph/pdf/migration2006-2010.pdf 25 http://www.fairfaxcountyeda.org/sites/default/files/pdf/fairfax_facts.pdf 26 GMU Center for Regional Analysis: Forecast for Tysons Corner to 2050, Stephen S. Fuller, PhD, Director, John McClain, AICP, Sr. Fellow And Deputy Director 9/17/2008 FAIRFAX COUNTY POPULATION BY AGE Source: U.S. Census Bureau and Fairfax County Department of Neighborhood and Community Services, Demographic Repots 2012
  • 25. 25 UNIVERSITY OF MARYLAND expected to steadily increase in the coming years. The percentage of income spent on housing has increased for households that rent, but this has occurred in conjunction with rising incomes. ESTIMATED MEDIAN INCOME AND MEDIAN FAMILY INCOME (2007-2012) Year Median HH Income Median Family Income 2007 $105,200 $122,000 2008 $107,400 $126,900 2009 $102,500 $122,600 2010 $103,000 $122,200 2011 $105,800 $119,600 2012 $107,100 $124,800 Sources: Department of Neighborhood and Community Services and U.S. Census Bureau, 1980, 1990 and 2000 Decennial Censuses 2001 Supplementary Census Survey and 2002-2012 American Community Surveys. Note: Figures are rounded to the nearest $100. The percentage of renter households spending 30% or more of their income on housing has risen over the past decade. Source: U.S. Census Bureau, 1980, 1990, and 2000 Censuses and 2005 and 2011 ACS. Parc Seven is poised to take advantage of the strong demographics at play in Tysons, and the larger region. It’s accessibility to Metro and focus on a mix of uses caters to highly educated, well paid, active individuals; and places Parc Seven among the most desirable developments in Tysons. These demographic factors influenced our projected rental rates, by allowing us to be aggressive.
  • 26. 26 UNIVERSITY OF MARYLAND MARKET OVERVIEW NEW DEVELOPMENT AROUND THE GREENSBORO METRO STATION PROJECT PLAN TYPE OFFICE SF RETAIL SF HOTEL KEYS RESIDENTIAL UNITS OWNER COMMENTS Greensboro Station Mixed-Use 1,999,364 170,000 400 1,615 The Meridian Group Pending approval Tysons Central Mixed-Use 631,000 173,000 200 1,200 NVCommercial/Clyde's Real Estate Group Approved, Total of 2.0 msf. Greensboro Park Place Mixed-Use - 10,000 - 500 Beacon Capital Pending approval Park Crest Residential - - - 300 Northwestern Mutual Under Construction TOTALS 2,630,364 353,000 600 3,615 The Silver Line, Envisioning A New Tysons Corner, Cushman & Wakefield, December 2013. The Silver Line, Envisioning A New Tysons Corner, Cushman & Wakefield, December 2013.
  • 27. 27 UNIVERSITY OF MARYLAND MARKET OFFICE MARKET National Office Trends With a stabilizing economy and increasingly better jobs reports in recent months the U.S. office market continues to improve. Overall employment only improved 1.4% but office using employment grew at 2.6% in 2013. Dallas/Ft. Worth, Chicago and Los Angeles were among the fastest growing markets in the U.S. and primarily driven by the technology sector. Vacancy rates dropped 50 basis points in 2013 to lowest their lowest level since 2009, with positive net absorption of 15 million square feet. Office development continued to rise, with 18.6 million square feet of new in 2013, nearly double 2012’s tally of 9.9 million square feet. Asking rates increased nearly 5% over the year Tyson’s Office Market Tysons Corner contains over 46 million square feet of office space making it one of the largest suburban office markets in the United States and the largest in the Washington, D.C. metropolitan area. The submarket which saw exponential growth over the past twenty years, is now home to countless nationally recognized companies including Capital One, Ernst & Young, Price Waterhouse Cooper, Federal Home Loan Mortgage Corporation (Freddie Mac), Booze Allen Hamilton, SAIC and many other non-profits and government contractors supporting the federal government. As a result the area with a population of only 20,000 sees a daytime population surge of 100,000. The direct office vacancy rate during the fourth quarter of 2013 was 12.7 percent, representing a downward trend from 13.4 percent during the third quarter of 2013 and 14 percent at the end of 2012. Office rents reflect the soft market, with an average effective office rent of $21.35 per square foot at fourth quarter of 2013, down 2.1 percent from year-end 2012. The decreasing effective rents are due to the still elevated vacancy rate. However, the average asking office rents for new office space was $54.75 per square foot at year-end 2013. If the Rosslyn, Ballston Corridor is any indication of what may happen in Tysons, “Within a quarter mile radius of the Metro, few properties deviate from the asking average rent by more than a few dollars. However, buildings with direct, internal Metro access were able to ask and approximately 6% premium over market averages. Given Fairfax County is encouraging a similar pattern of development along the Silver Line, within a quarter mile radius of Metro stops, this pattern is likely to be echoed.” 27 The new Silver Line connecting Washington D.C. with Dulles Airport has spurred area development through projects surrounding the Greensboro Metro Station are lagging behind other area stations. Developer Meridian Group recently purchased the former SAIC headquarters with plans to renovate three existing office properties at the site and eventually add more than 2 million square feet of mixed-use development on the 18-acre site. Cvent, Inc., an event management company, recently leased 130,000 square feet of newly renovated space in the building. Adjacent to the site NV Commercial and Clyde’s Real Estate Group are developing the 1.8 million Tyson’s Central which will include at least 631,000 square feet of office space. Tysons West, a development by JBG Companies currently under construction will contain 400,000 square feet 27 The Silver Line, Envisioning a New Tysons Corner, Cushman & Wakefield, December 2013.
  • 28. 28 UNIVERSITY OF MARYLAND of office space. Developer Hines plans to put in place 525,000 square feet of office space by mid-year 2014 at 7900 Tysons One Place Parc Seven Office Vision The technology sector remains one of the country’s hottest industries with blockbuster tech company buyouts and fast growing companies frequenting the news. The trend is also evident among today’s top young talent. At Harvard Business School, 18% of job-seeking students landed tech-sector spots this year, up from 12% in 2012 (compared to an 8% decrease in financial sector jobs, from 35% to 27%). For the first time at Stanford Graduate School of Business tech companies overtook financial services, with 32% of the class accepting tech jobs and just 26% heading into finance. Two years ago, those figures were 13% and 36%, respectively. A similar shift is under way in many other top schools (1). Strategically located between Washington, D.C. and Dulles Airport, Tyson’s serves as the gateway to the “Dulles Technology Corridor”, a technology and defense business cluster whose global reach and proximity to the nation’s capital has drawn the highest concentration of technology workers in the U.S., according to TechAmerica. Technology employment opportunities continue to grow with a 4% increase over the past two years, reaching 20.6% total growth since 2001(3). The Washington D.C. Metro was also recently ranked the 2nd Best Place in America for Tech Jobs by Forbes Magazine. Parc Seven’s goal is to facilitate an environment that will allow Tyson’s to benefit from this explosive technology sector job growth. We will work together with Fairfax County to incentivize technology companies that are looking to leverage the areas major economic drivers like its three regional airports and the United States Department of Defense. These companies will be further drawn by the notion that our trendy live-work-play environment will attract top young talent that is otherwise not enthused by Tyson’s Corner. We will anchor our two full service high-tech office buildings near the metro with some of the hottest and fastest growing companies in the tech sector that – will leverage Fairfax County’s major economic drivers. Here are some examples: Gogo Inc (NASDAQ: GOGO) is a provider of in-flight broadband internet service and other connectivity services for commercial and business aircrafts. Gogo recently launched Gogo Text & Talk, an app that allows users to make in-flight cell phone calls, and text messaging. We believe a presence in this market will offer the opportunity for high profile exposure near three regional airports that serve as hubs for several major airliners, as well as the world’s leading aerospace, defense and aircraft manufacturers like Airbus, Boeing, Lockheed Martin, and Northrop Grumman. Vuzix is a multinational technology firm headquartered in Rochester, New York that manufactures and sells computer display devices and software including video eyewear and smart glasses for consumer, commercial, and entertainment products. Recently the company received a grant from the U.S. Office of Naval Research to integrate Google Glass-like, see-through optics into a standard pair of goggles for the U.S. Navy. The idea is to superimpose computer-generated information on a soldier’s view of the real world. Our unique location near Washington D.C. and with direct access to the U.S. Department of Defense will provide an incredible growth opportunity for this company. Apple Inc. (NASDAQ: AAPL) has recently become more open about their aggressive foray into the healthcare industry. A company like Apple may leverage the rapidly growing INOVA healthcare network and their dynamic growth Plan as well as proximity to the FDA.
  • 29. 29 UNIVERSITY OF MARYLAND RETAIL MARKET Retail Strategy With proximity to the Greensboro Metro Station and visibility from Leesburg Pike, Parc Seven will include a range of retail and activity driven spaces. We intend to provide 350,000 square feet of retail to the development. There will be various services for the residents of Parc Seven including a bank, dry cleaners, and pharmacy. These uses are seen as the high volume, credit tenants that will bring in customers to the development. We have carefully arranged the retailers such that the national tenants will predominately deliver into the project during the first and second phase of development, and receive the most visibility from the main roads. The smaller boutiques, local shops, and the Grove Market are planned to deliver after in the 3rd phase of development. As shown in Figure 1, there will be a healthy mix of retail types on each block. With Parc Seven as an entertainment destination, we are proposing a state-of-the-art music venue where the musician and audience come together for a truly unique experience of entertainment and dining through a new concept that combines bowling, bocce, and exceptional cuisine. Two major hubs of entertainment will be created both at the “Grove Circle” and the Civic Center. The “Parc Plaza” will house our local food hub known as the “Grove Market”. Parc Seven will cultivate awareness for healthy living both with the offerings at the Grove Market and the fitness center we are proposing. The fitness center will provide an artful arrangement of activity and atmosphere, complete with spa, salon, healthy snack bar, gear shop, endless pools, luxurious locker rooms, and the rooftop pool and lounge. National Retail Trends The retail market is finally emerging from the depths of recession. Improving retail fundamentals are the result of an economic uptick and still historically low new retail development. According to data from NCREIF in 111 U.S. metropolitan areas just 6.5 million square feet of new retail construction occurred in 2013 and 8 million square feet is expected in 2014. REIS recently reported the national vacancy rate for neighborhood and community shopping centers at 10.4%, a subtle 30 basis point drop from last year. Effective rents grew 1.4% in 2013 which, is triple the rate of growth in 2012. Meanwhile, countless retailers remain susceptible to the increasing popularity of online retail, which has already claimed numerous victims. Bricks and mortar retailers are slowly adapting to the new reality by learning how to relate to customers in the dynamic consumer landscape. In today’s market, it is crucial that Landlords understand and adapt to the new reality by creating an appealing customer destination to facilitate their tenant’s success. Ultimately, this will yield strong tenant sales which landlord’s will capitalize on by way of tenant retention and consistent rent growth. According to REIS, high-end retail destinations are thriving with vacancy rates reported well below 5%. Tysons Retail Market Tysons Corner is a regional retail hub which draws from a diverse customer base throughout Northern Virginia, Washington, D.C. and Maryland. Two high-end regional malls, Tysons Corner Center and Tysons Galleria, dominate the landscape. Macerich’s Tysons Corner Center is now the ninth largest mall in the United
  • 30. 30 UNIVERSITY OF MARYLAND States with nearly 2.5 million square feet. General Growth Properties’ Tysons Galleria includes 30 exclusive- to-market retailers. New competitive development on Leesburg Pike are Tyson’s Central and Westpark Drive which calls for 173,000 and 60,000 square feet of retail respectively both with no specific tenancy mix. The Tysons market and especially Leesburg Pike (Route 7) is identified as “a place all national retailers want a presence”. Leases are triple net across the board. The submarket enjoys a consistently strong absorption rate and positive rent growth. Average retail vacancy rate is at an incredibly low 1.4% for community and neighborhood centers according to REIS. Average allowances offered to new tenants are $12.22 per square foot for improvements with minimal free rent. Asking rents for anchor tenants range from $17.46 to $37.40 per square foot, with an average of $24.97. In-line asking rates range from $28.97 to $51.05 per square foot, with an average of $40.80. However, recent leasing activity indicates that economic improvement and excitement over the much anticipated Silver Line Metro’s has driven rent much higher. Chipotle recently leased small shop space down the block for the subject property at 8461 Leesburg Pike for $100 per square foot. Parc Seven Retail Vision Parc Seven retail component will leverage its close proximity to the Greensboro Metro Station and visibility from high traffic Leesburg Pike. The tenancy will feature a diverse mix of more than 60 national, regional and local retailers in 450,000 square feet. Service oriented and convenience retailers will benefit both residents and commuters alike. Large national credit tenants will pay a premium for prime visibility along Leesburg Pike while smaller boutique shops are prominent along the projects central multi-level retail corridor. Figure 1 - Proposed Retail Mix
  • 31. 31 UNIVERSITY OF MARYLAND At the heart of Parc Seven will be Grove Market, a high-end food market concept comprising of a variety of fine restaurants, food and beverage stations, bakeries and retail items. This truly unique shopping experience with its exclusive offerings will create a strong sense of place for residents, office users and guests driving long term value for the project. Simultaneously it will serve as an incubator for local restaurant and food concepts. The vendor mix within The Grove will be modeled after other great food markets around the country; Chelsea Market and Eataly in New York City, The Ferry Building in San Francisco and Reading Terminal. Our goal is to become a food destination with high-quality offerings of local products served by top tier vendors and food entrepreneurs with a healthy balance between take home groceries and consume on the spot food offerings. Parc Seven will also feature an array of popular entertainment and activity options for residents and visitors. Vida is a state of the art lifestyle gym complete with a spa, salon, snack bar, apparel shop and rooftop pool and lounge. A trendy music venue where the musician and audience come together for a distinctive entertainment experience and a new concept that combines bowling, bocce, and exceptional dining will highlight the project. The “Grove Plaza” will serve as a food centric zone and contain the Grove Market. See Appendix IV.1 -“Market Supplement” for chart describing retail mix by use, and Appendix IV.2 -“Market Supplement” for the chart describing the retail mix per building. HOUSING MARKET The vision of Tysons as a new urban center relies upon Tysons transitioning from being known as home to the “largest concentration of office space in Northern Virginia to becoming a 24/7 live/work/play environment”. The integration of uses inside neighborhoods is pivotal and housing takes center stage. “Fairfax County has predicted the population of Tysons Corner will grow to 100,000 by 2050. With over 20,000 dwelling units currently proposed, the groundwork for such tremendous growth is undeniably in place.28 Existing conditions in Tysons Corner-Vienna and Fairfax City vary slightly from the Metro Suburban Virginia data in that asking rents are higher. Vacancy rates and concessions are also higher due to the increase in supply. Figure 1 Submarket Inventory (Buildings) Inventory (Units) Asking Rent $ Vac % Free Rent (mos) Expenses % (Apartment) Tysons Cor/Fairfax 41 13,670 $1,743 6.80% 0.69 41.20% Average Suburban Virginia Lease Terms 3.80% 0.29 41.30% REIS Observer 4Q 2013 Tysons generally has higher rents when compared to Suburban Virginia. This may be due to larger unit sizes. Figure 2 shows the rents and unit sizes of Suburban Virginia as a whole. This includes all classes and ages of inventory. Figure 3 shows just the Tysons portion of the Suburban Virginia market. Figure 4 shows the rents and unit sizes of The Ascent, a recently completed multifamily development in Tysons by Greystar. The 28 The Silver Line, Envisioning a New Tysons Corner, Cushman & Wakefield, December 2013, PG 19.
  • 32. 32 UNIVERSITY OF MARYLAND Ascent is a Class A luxury high-rise currently in lease-up. Their rents are significantly higher than rents in Tysons and the units are significantly smaller. This trend of smaller units at higher rents is sweeping the Washington Metro area. Millennial’s are increasingly demanding studios and one bedroom units that are transit oriented, in cool neighborhoods where they can access food and entertainment easily. They increasingly do not own cars and have yet to accumulate a lot of stuff. The Ascent is in line with other multifamily developments of the same type in catering to this growing demographic. As such, the three bedroom unit has become unpopular because families with children do not generally live in luxury apartments geared toward singles and young couples. Parc Seven utilizes a similar methodology when determining our rents and unit sizes. That being said, according to a Transwestern report, “Class A rents declined by 1.1% over the past year (2013), down from the 2.7% growth posted at third quarter 2012.” Class A rents will face downward pressure over the next 24 months at the regional level due to the large slate of scheduled deliveries compared to projected demand levels.” Figure 2 Rent Avg. SF Avg. Rent PSF Studio/Efficiency $1,266 525 $2.41 One Bedroom $1,460 759 $1.92 Two Bedroom $1,717 1,043 $1.65 Three Bedroom $1,964 1,264 $1.55 REIS Observer 4Q 2013 Figure 3 Rent Avg. SF Avg. Rent PSF Studio/Efficiency $1,289 584 $2.21 One Bedroom $1,578 792 $1.99 Two Bedroom $1,846 1,057 $1.75 Three Bedroom $2,085 1,273 $1.64 REIS Submarket Trend Futures, Apartment 4Q 2013 Figure 4 Rent Avg. SF Avg. Rent PSF Studio/Efficiency $2,003 461 $4.34 One Bedroom $2,740 821 $3.34 Two Bedroom $3,524 1,083 $3.25 Three Bedroom -$ 0 -$ www.theascenttysons.com, as of 2/24/2014 The Ascent Unit Mix Rent Details Current Asking Rents and Sizes 4Q 2013 4Q 2013 Current Metro Average Rents and Sizes Suburban Virginia Unit Mix Rent Details Tysons Submarket Unit Mix Rent Details Current Submarket Rents and Sizes 4Q 2013
  • 33. 33 UNIVERSITY OF MARYLAND According to a report by Transwestern, Northern Virginia’s “Class A absorption remains strong and continues to outpace deliveries at this stage of the development cycle. Net absorption is at 6,493 Class A and B apartments across the metro.” According to Reis new construction is anticipated to total 17,368 units (3,474 per year on average) from 2013 to 2017, while net absorption is forecast to reach 14,833 (2,967 per year on average) (Figure 5). Figure 5 REIS Observer 4Q 2013 Reis data shows that, “the mean cap rate fell to 3.5% in the third quarter of 2013 after finishing the first quarter at 5.7%. The low cap rate implies the sale of a prime property in the third quarter. Rolling cap rates settled at 4.8% in the fourth quarter of 2013 and are expected to vary between 4.5% and 5.1% going forward. 29 Our cap rates are conservative in the 6% range. The supply of housing shows that multifamily units will continue to dominate the housing stock. “Conversions of apartments to condominiums, once an active trend here, has ceased since 2009.” However, the condo market is slated to make a slight comeback in terms of planned units. 30 Figure 6 Tysons Cor/Fairfax Apartment Condo Other Completed 535 0 42 Under Construction 1,887 0 241 Planned/Proposed 9,310 375 456 Total 11,732 375 739 Grand Total 12,846 New Construction Project Tally REIS New Construction Listing 4Q 2013 Through phasing the Parc Seven development builds in flexibility to adjust to the market. We have planned for apartments and condominiums but that could change to all for-rent units if need be. 29 Reis Observer Q4 2013. 30 REIS New Construction Listing 4Q 2013 0 1000 2000 3000 4000 5000 6000 7000 No.ofUnits Northern Virginia Apartment Supply and Demand Trends Completed Absorbed
  • 34. 34 UNIVERSITY OF MARYLAND HOTEL MARKET Today there are 11 hotels in Tysons Corner. As the office and residential population grows in Tysons, so too will demand for more hotels. The master plan projects that Tysons will have 80,000-100,000 residents by 2050 and over 200,000 employees, compared to 17,500 residents and 100,000 employees today. With such a dramatic increase in economic activity, Tysons Corner will need more hotels to accommodate visitors. Local developer MRP is currently building two Hilton banner hotels at Tysons Overlook, while Macerich plans for a new 310-key Grand Hyatt at Tysons Corner. With currently no planned hotels at the Greensboro Metro Station, where the Silver Line serves as a direct link between Washington, D.C. and Dulles International Airport, a hotel is a natural fit for the sight. Recognizing that there are numerous other hotel options in the market we selected a unique hotel that will differentiate itself in the market and integrate well with our overall vision. Hotel Zetta is a popular luxury hotel in San Francisco owned and operated by Viceroy Hotel Group, a hotel manager with hotels throughout the world under their flagship Viceroy Hotels and Resorts banner and Urban Retreats banner. The tasteful, modern hotel invites style-seeking travelers and local professionals to work, connect, play and get inspired. CIVIC CENTER There are many different museums and performance venues throughout Virginia, but the Tysons Corner region has minimal civic attractions. Keeping in line with the desires of Fairfax County’s desire for the south Central 7 District to be a hub for public enjoyment we considered a variety of potential uses for our site. Our goal is to bring a well-integrated public attraction to our site that will serve the community and drive further traffic to the project. Currently the region is home to one of the leading performing arts venues, Wolf Trap. As America’s National Park for the Performing Arts, it enhances the culture in the region though artistic and educational programs. Wolf Trap is run through a public private partnership with the U.S. Department of the Interior, National Park Service.31 Much of the venue is outdoors and features performances ranging from pop and country to orchestra, theatre, and opera, as well as innovative performance art and multimedia presentations. The Tyson Corner Comprehensive Plan envisions a redevelopment of the south Tysons Central 7 sub-district that will focus on civic uses.32 According to the District Recommendation, “The signature focal point of the Tysons Central 7 District is the civic center’s great public space, the ‘Civic Commons’ which should be about three to four acres.” The goal of the vision is to create a new public identity for the district and provide space for large public gatherings. We are currently negotiating with several cultural and artistic programs that may have an interest in expanding their facilities and presence to our site in Tysons Corner. We would like to propose an allocation of cost to Fairfax County for input as far as the organization that will occupy this portion of our site. 31 Wolftrap - http://www.wolftrap.org/Learn_About_Wolf_Trap.aspx 32 Tysons Comprehensive Plan – FAIRFAX COUNTY COMPREHENSIVE PLAN, 2013 Edition AREA II Tysons Corner Urban Center, Amended through 2-12-2013 District Recommendations pages 131-134
  • 35. 35 UNIVERSITY OF MARYLAND The Northern Virginia Children’s Science Museum is currently looking for 40,000 with the possibility of future expansion. The science center will be an interactive children’s museum focused on science, technology, engineering and math or “STEM”. To compliment this user the site will also house an IMAX Theater. With the advent of new technology popular feature length Hollywood films are now shot in 3-D and played on IMAX screens. This unique theater will show educational IMAX productions during the day and full length films in the evening and on weekend, serving as a round the clock traffic driver. To facilitate the Science Center’s potential for future growth we plan to leave a warm lit shell of 40,000 square feet. In the interim this space will serve as yet another unique destination and attraction. We will lease the space to Premier Exhibitions (NASDAQ:PXRI) a company that organizes traveling exhibitions and displays them at high-profile locations throughout the world. Currently they have two permanent exhibition display sites at Luxor in Las Vegas and in Atlanta where they are headquartered. Some of the recent well known exhibits include RMS Titanic and Bodies… The Exhibition.
  • 36. 36 UNIVERSITY OF MARYLAND FINANCIAL ANALYSIS INTRODUCTION Parc Seven is a financially viable development project with strong cash flow potential. Throughout our financial analysis, we took on a more conservative approach in our assumptions to demonstrate the performance strength of the project. We also made various strategic decisions with this project in order to mitigate risk for the developer; first by breaking the project into four independent phases that were planned to be fluid in order to react to market demand without overcommitting the developer to specific programing uses, second this approach calls for the six (6) resulting blocks of the project to be subdivided into separate ownership entities in order to limit risk and allow for easier underwriting on smaller blocks, and additionally by maintaining our strongest existing tenants for as long as possible we were able to maintain $5million in cash flow on the property during the first 4-years of build-out, and $2.5million for an additional 2-years; resulting in a total of $25million in cash flow during the first 6-years of construction due to our strategic phasing. ACQUISITIONS The proposed development of Parc Seven spans a 12.8-acre site, predominately owned by Federal Realty Investment Trust (FRIT). The development also includes a 18,526 square foot low rise building at 8399 Leesburg Pike. The parcel is particularly essential because it is the corner of the site and the first impression for vehicular traffic. In 2013 the land was valued at $1,667,340 and the building at $4,154,530 for a total assessed value of $5,821,870. In November of 2008 it was sold to the Commonwealth of Virginia for $6,100,00040 . Because the block will contain the science and civic center for the community, we have assumed acquisition of the parcel through contribution by the Commonwealth of Virginia. 40 Fairfax County Tax Assessment. 8399 Leesburg Pike. http://icare.fairfaxcounty.gov/Datalets/Datalet.aspx?sIndex=0&idx=2
  • 37. 37 UNIVERSITY OF MARYLAND ASSUMPTIONS PARC SEVEN AT GREENSBORO STATION - TOTAL USES AND SOURCES EXHIBIT 1: PARC SEVEN USAGE OF FUNDS USES - Development Costs Total Acquisition Land & Building Acquisition 54,324,661$ Total Acquisition 54,324,661$ Construction Demolition 16,810,160$ Infrastructure & Urban Plaza 1,805,639$ Retail 56,475,952$ Office 97,382,707$ Hotel 67,532,887$ Apartment 123,487,446$ Condominium 39,725,137$ Civic 11,681,525$ Parking 43,120,413$ Taxes/Ins. During Const. 1,173,413$ Total Construction 459,195,279$ Construction Financing Points & Fees (Origination) 2,211,926$ Interest Expense 31,582,715$ Total Construction Financing 33,794,641$ Soft Costs Soft Costs 100,813,129$ Total Soft Costs 100,813,129$ Permanent Financing Points & Fees (Origination) 2,228,977$ Transfer/Recording Fees 668,893$ Title Insurance, Recording, Management 535,000$ Total Permanent Financing 3,432,870$ Reserves Lease-up Reserves 1,815,000$ Operating Reserves 2,230,000$ Replacement Reserve 2,800,000$ Total Reserves 6,845,000$ Development Fees Development General & Administration 13,716,783$ Development Fee 13,716,783$ Total Development Fees 27,433,566$ Total Development Cost 685,839,146$ PARCEL C - ESTIMATED DEVELOPMENT COSTS
  • 38. 38 UNIVERSITY OF MARYLAND EXHIBIT 2: PARC SEVEN SOURCES OF FUNDS The financial analysis details all four phases of construction through lease up totaling to a development cost of $695,839,146. $445,795,445 will be financed via loan syndication and the remaining $240,043,701 will be financed with owner equity. Each phase of the development will be financed separately, giving the development team the option to analyze market conditions at different intervals over the nine-year construction schedule and determine if development should proceed to full completion. Thus, there is the option to halt development after the completion of the first few phases if future market conditions are unfavorable. The phasing has been coordinated to preserve the net operating income of the current shopping center for as long as possible. Block C was chosen as the first phase of the development for a variety of financially advantageous reasons. This block’s proximity to Greensboro Metro Station makes it the best candidate for initial development. Positioning an office tower closest to Greensboro Metro Station gives the building high visibility and ease of accessibility. These qualities justify the per square foot rent we intend to charge for the office space. By carving an arch within the first few stories of the building, pedestrians can walk through the building and into the entertainment/retail areas that will be constructed during the later phases of development. Additionally, construction of Phase One is least intrusive to existing retailers at Pike 7 Plaza and will not disrupt the current retail center’s cash flow and business operations. Lastly, Block C requires no demolition as it is currently a surface parking lot. Phase One of the development is Block C at the southeast corner of the site. This block will contain 329,000 square feet of rentable office space, first floor retail and a partial level of underground parking (PPU). Construction will commence on January 15, 2016, with substantial completion occurring on December 29, 2017. The total development cost for Phase I is $93,262,041. SOURCES - Development Financing Proposed Funding Equity Equity - Owner(s) (Land/Building) 58,984,802$ Equity - Owner Other 181,058,899$ Equity - Investors, LP, and/or LLC -$ Debt 1st Mortgage 445,795,445$ Other Mortgage -$ Other City Loan (Soft) -$ County Loan (Soft) -$ Grants -$ Total Financing/Equity: 685,839,146$
  • 39. 39 UNIVERSITY OF MARYLAND EXHIBIT 3: PROGRAMMING MIX FOR PHASE I Phase II of the development will require the demolition of BB&T bank and roughly one third of the shopping center up to the center’s breezeway. The partial demolition of Pike 7 Plaza is necessary to make room for temporary surface parking for remaining tenants in the plaza and new tenants in Parcel C. The abandon building located on Parcel A will also be demolished along with the Goodyear building so that the shopping center’s visibility from Leesburg Pike is not completely obstructed by the construction of Parcel B. Parcel B will contain 250 hotel rooms along with new office space, with retail on the first floor, a partial level of parking underground (PPU) and a full level of underground parking (P1LU). Construction of Phase II will commence on January 1, 2018, with substantial completion occurring on December 31, 2019. The loss of revenue from retailers located on Parcel F will be mitigated by the opening of new retail stores in Parcel C. The total development cost for Phase II is $196,446,408. EXHIBIT 4: PROGRAMMING MIX FOR PHASE II Phase III will require the demolition of the remainder of Pike 7 Plaza on Parcels D and E to make way for 593 apartment units. Phase III will also see the construction of 105 for-sale condominiums on Parcel F making it the largest and most costly phase of the development. During the construction of Phase II, the development team will reanalyze the market to determine the risk involved in proceeding with this large phase of the project. If construction is green lit, it will begin on January 1, 2020, with substantial completion occurring on December 31, 2021. The total development cost for Phase III is $319,517,708. TDC: 93,262,041$ ASSUMPTIONS: Bld. Footprint 28,270 Uses GSF NSF Office 355,566 328,899 Retail 11,149 10,313 Parking 27,619 27,619 Total 394,334 366,830 PHASE I Parcel C - Office Building TDC: 196,446,408$ ASSUMPTIONS: Bld. Footprint 79,540 Uses GSF NSF Hotel 270,738 234,188 Office 229,280 212,084 Retail 119,310 110,362 Parking 159,080 159,083 Total 778,408 715,717 PHASE II Parcel B - Hotel/Office
  • 40. 40 UNIVERSITY OF MARYLAND EXHIBIT 5: PROGRAMMING MIX FOR PHASE III Phase IV is the last phase of the development on the last remaining parcel, Parcel A. This building will contain over 43,000 square feet of rentable civic space along with over 150,000 square feet of retail and partial parking underground. Phase IV contains the development of Parcel A because the land contained within Parcel A must be acquired from the state of Virginia; if there are any complications with acquisition, the development team did not want it to hold up initial construction of the development. Construction of this phase will commence on January 3, 2022, with substantial completion occurring on December 29, 2023. This is the least costly phase of development with a total development cost of $76,612,988. TDC: 319,517,708$ Total Const. Cost: 67,319,249$ ASSUMPTIONS: Bld. Footprint 57,965 Uses GSF NSF Apartment 214,650 185,672 Retail 57,965 53,618 Parking 115,930 115,930 Total 433,331 433,332 PHASE III Parcel D - Retail/Multifamily Total Const. Cost: 86,263,404$ ASSUMPTIONS: Bld. Footprint 70,898 Uses GSF NSF Apartment 348,089 301,097 Retail 70,902 65,584 Parking 70,902 70,902 Total 571,595 571,596 PHASE III Parcel E - Retail/Multifamily Total Const. Cost: 49,650,568$ ASSUMPTIONS: Bld. Footprint 35,634 Uses GSF NSF Condo 150,983 130,600 Retail 35,638 32,965 Parking 70,345 70,345 Total 256,966 233,910 PHASE III Parcel F - Condominium
  • 41. 41 UNIVERSITY OF MARYLAND EXHIBIT 6: PROGRAMMING MIX FOR PHASE IV The project will stabilize approximately one year after substantial completion of Parcel A on January 1, 2025 and the projected sale date is in year 2027. Exhibit 7 shows the project’s start of construction, stabilization, exit year, and the internal rate of return. EXHIBIT 7: PROJECT SNAPSHOT Exhibit 8 breaks down the project’s capital injection for each phase from a leveraged and unleveraged position as well as the before tax and after tax cash flow. Capturing the current income stream provided by Pike Seven Plaza will increase the estimated cash flow of the project by $24,166,666 during the five and a half years of development. This current cash flow is highlighted blue. The cash flow for years 2022 and 2023 is highlighted in orange to show the boost in revenue received from the sale of the condominiums in Parcel F. TDC: 76,612,988$ ASSUMPTIONS: Bld. Footprint 46,831 Uses GSF NSF Civic 46,831 43,319 Retail 163,909 151,615 Parking 70,247 70,247 Total 280,987 265,181 Parcel A - Civic Building PHASE IV Project Snapshot Total Development Cost: 671,035,133$ BEFORE TAX LEVERAGED Project Price Per Square Foot: 1,163$ 2027 27.86% Construction Commences: 2016 AFTER TAX LEVERAGED Stabilization Year: 2025 2027 25.83% Exit Year: 2027 UNLEVERAGED Before Tax Sales Price: 764,961,326$ 2027 14.91% Rate of Return Projected Internal
  • 42. 42 UNIVERSITY OF MARYLAND EXHIBIT 8.1: BEFORE-TAX, AFTER-TAX 10 YEAR PROJECTED INTERNAL RATE OF RETURN LLC Current Cash Flow Before-Tax LLC Equity Cash Flow Before Property Before-tax Year Pay-In (Estimated) Taxes Sale Distribution 1/1/2016 (32,641,714)$ 12,500,000$ -$ (20,141,714)$ 1/1/2017 -$ 5,000,000$ (5,535,519)$ (535,519)$ 1/1/2018 (68,756,243)$ 3,333,333$ (1,011,551)$ (66,434,461)$ 1/1/2019 -$ 3,333,333$ 4,678,435$ 8,011,768$ 1/1/2020 (111,831,198)$ -$ 6,684,016$ (105,147,182)$ 1/1/2021 -$ -$ 51,537,826$ 51,537,826$ 1/1/2022 (26,814,546)$ -$ 31,519,394$ 4,704,848$ 1/1/2023 -$ -$ 27,351,053$ 27,351,053$ 1/1/2024 -$ -$ 28,723,079$ 28,723,079$ 1/1/2025 -$ -$ 30,380,315$ 30,380,315$ 1/1/2026 -$ -$ 32,819,586$ 764,961,326$ 797,780,912$ Total (240,043,701)$ 24,166,666$ 207,146,635$ 764,961,326$ 756,230,926$ Internal Rate of Return Before Tax: 27.86% Before Tax Net Present Value: 110,845,922$ Hurdle Rate: 15.00% NPV Rate: 15.00% BEFORE TAX -LEVERAGED LLC Current Cash Flow After-Tax LLC Equity Cash Flow After Property After-tax Year Pay-In (Estimated) Taxes Sale Distribution 1/1/2016 (32,641,714)$ 7,375,000$ -$ (25,266,714)$ 1/1/2017 -$ 2,950,000$ (2,806,935)$ 143,065$ 1/1/2018 (68,756,243)$ 1,966,666$ (160,154)$ (66,949,730)$ 1/1/2019 -$ 1,966,666$ 4,226,269$ 6,192,935$ 1/1/2020 (111,831,198)$ -$ 5,326,791$ (106,504,407)$ 1/1/2021 -$ -$ 61,439,849$ 61,439,849$ 1/1/2022 (26,814,546)$ -$ 40,984,406$ 14,169,860$ 1/1/2023 -$ -$ 37,109,982$ 37,109,982$ 1/1/2024 -$ -$ 38,012,975$ 38,012,975$ 1/1/2025 -$ -$ 39,536,574$ 39,536,574$ 1/1/2026 -$ -$ 40,744,358$ 609,086,765$ 649,831,124$ Total (240,043,701)$ 14,258,333$ 264,414,114$ 609,086,765$ 647,715,511$ Internal Rate of Return After Tax: 25.83% After Tax Net Present Value: 88,981,633$ Hurdle Rate: 15.00% NPV Rate: 15.00% AFTER TAX - LEVERAGED
  • 43. 43 UNIVERSITY OF MARYLAND EXHIBIT 8.2: UNLEVERAGED 10 YEAR PROJECTED INTERNAL RATE OF RETURN The dimensions of the site are shown in Exhibit 9. The total size of the site in approximately 577,234 square feet with over 57,000 square feet allocated to park/civic space. EXHIBIT 9: SITE DIMENSIONS AND BUILDING FOOTPRINTS The development features a combination of retail, hotel, office, residential, and civic space totaling over 2.5 million square feet. The total square footage of each use is detailed in Exhibit 10. LLC Current Cash Flow Property LLC Equity Cash Flow Sale Distribution Year Pay-In (Estimated) 1/1/2016 (83,639,432)$ 7,375,000$ -$ (76,264,432)$ 1/1/2017 -$ 2,950,000$ (1,868,287)$ 1,081,713$ 1/1/2018 (196,446,408)$ 1,966,666$ 2,655,681$ (191,824,061)$ 1/1/2019 -$ 1,966,666$ 18,932,380$ 20,899,046$ 1/1/2020 (319,517,708)$ -$ 20,937,961$ (298,579,747)$ 1/1/2021 -$ -$ 80,726,451$ 80,726,451$ 1/1/2022 (76,612,989)$ -$ 60,708,019$ (15,904,969)$ 1/1/2023 -$ -$ 57,286,283$ 57,286,283$ 1/1/2024 -$ -$ 58,658,309$ 58,658,309$ 1/1/2025 -$ -$ 61,031,246$ 61,031,246$ 1/1/2026 -$ -$ 62,754,816$ 1,086,363,239$ 1,149,118,055$ Total (676,216,537)$ 6,883,333$ 421,822,859$ 1,086,363,239$ 846,227,894$ Unleveraged Internal Rate of Return: 14.91% Unleveraged Net Present Value: (1,720,734)$ Hurdle Rate: 15.00% NPV Rate: 15.00% UNLEVERAGED Total Site Size 577,234 Total Building FP 319,138 Urban Plaza 33,443 Park Space 24,000 Roads 117,423 Sidewalks 83,230 Parcel A Size 99,716 Parcel B Size 112,219 Parcel C Size 64,314 Parcel D Size 101,563 Parcel E Size 128,903 Parcel F Size 70,519 Site Dimensions (Sq./ft.) Building A 46,831 Building B 79,540 Building C 28,270 Building D 57,965 Building E 70,898 Building F 35,634 Building Footprints (Sq./ft.)
  • 44. 44 UNIVERSITY OF MARYLAND EXHIBIT 10: PRORAMMING MIX A breakdown of land and building acquisition is shown in Exhibit 11. The acquisition cost is based off of the assessed value of the property for the most recent tax year. Acquisition of Parcel A includes the assessed value of the 18,000 square feet of land and the building not currently owned by Federal Realty Investment Trust. The development team plans to purchase this land from the state of Virginia so that it can be incorporated into the development. This parcel is vital to achieve full build out of Parcel A. The average price per square foot of the existing buildings and land is $100.31. The acquisition price for each parcel is determined by multiplying this number by the total square footage of each parcel. EXHIBIT 11: ACQUISITION COSTS Hotel 270,738 Office 584,846 Apartment 562,739 Condo 150,983 Retail 458,873 Civic 46,831 Infrastructure 200,653 Green Space 57,443 Gallery Walk 17,300 Parking 514,123 Total Sq./Ft. 2,864,529 Total Programming Mix 8365 Leesburg Pike 3,007,840$ 8371 Leesburg Pike 36,165,240$ 8365 Leesburg Pike 12,998,160$ Total Value Existing Site 52,171,240$ Apprx. Land Square Footage 558,708 Price Per Square Foot 93.38$ Building Price $4,062,560 Land Price $1,667,340 Total Value Existing Site $5,729,900 Land Square Footage 18,526 Price Per Square Foot 309.29$ Total Acquisition Price 57,901,140$ Total Size of Site 577,234$ Total Site Price PSF 100.31$ Acquisition of Parcel A Site Acquisition
  • 45. 45 UNIVERSITY OF MARYLAND The demolition and construction costs per square foot were provided by Tishman Construction Corporation and detailed in Exhibit 12. EXHIBIT 12: CONSTRUCTION COSTS PER SQUARE FOOT Parking spaces were deduced using an average parking space size of 243 square feet. Parc Seven will have 2,116 parking spaces available. The cost for construction of surface and underground parking was also provided by Tishman Construction Corporation. This is shown in Exhibit 13. EXHIBIT 13: PARKING SIZING AND COSTS For the purposes of this pro forma, we are estimating that operating expenses would be approximately 35 percent of the project’s gross operating income (not including taxes and leasing concessions). We have also taken into consideration the core loss factor, which is indicated in Exhibit 14. EXHIBIT 14: SOFT COST ESTIMATION AND CORE LOSS Each phase will be financed via a 24 month construction loan that will be taken out by a permanent loan at substantial completion. The construction loan is assumed to have a 10% retainage paid out at the end of Demolition 3.50$ per sq./ft. Retail 139.25$ per sq./ft. Condo 263.11$ per sq./ft. Apartment 219.44$ per sq./ft. Office 166.51$ per sq./ft. Hotel 249.44$ per sq./ft. Civic 249.44$ per sq./ft. Open Space Costs 4.60$ per sq./ft. Roadway Costs 9.30$ per sq./ft. Sidewalk Costs 5.90$ per sq./ft. Construction Costs Parking - Avg. Size 243 SF/space Total Parking Spaces 2,116 Above Grade Parking 70.55$ per sq./ft. Below Grade Parking 104.76$ per sq./ft. Surface Grade Parking 12.00$ per sq./ft. Sizing - Parking Parking Estimated Costs Soft Cost 35.00% of GOI Core Loss Office/Retail 7.50% of GSF Core Loss Residential 13.50% of GSF % Non-Leasable space Other Details
  • 46. 46 UNIVERSITY OF MARYLAND loan’s 24 month term. Each phase of the project will be financed via loan syndication and issued by a Lead Arranger. It is assumed that our permanent loan will be structured as a balloon, and we intend to refinance the balloon payment at the end of the loan term as long as the project remains financially viable. We have assumed an interest rate of 5.25% for permanent financing in an effort to approach this analysis conservatively. This is detailed in Exhibit 15. EXHIBIT 15: FINANCING ASSUMPTIONS The rents that we intend to charge for each use have been deduced via the market analysis conducted by the development team. We are assuming $75 per month for each space that we have designated as income producing parking. The rents for each use is shown in Exhibit 16. EXHIBIT 16: RENTAL RATES The unit mix for the apartment buildings located on Parcel D and Parcel E was determined by a residential market analysis. Exhibits 17 and 18 show the square footage for each unit type, and the rent that the development team intends to charge for each type. It was determined that three bedroom units were not desirable in this particular area, and were not included in the unit mix. LTV: 65% Rate: 5.25% Term (Years): 25 Origination: 0.50% Fees: 0.15% Permanent Financing Months: 24 Loan Origination: 0.50% Rate: 6.75% Retainage: 10% Construction Financing Trophy Office 54.00$ per SF Hotel 50.00$ per SF Retail 75.00$ per SF Multifamily 42.00$ per SF Civic 50.00$ per SF Parking 75.00$ per space Rental Rates
  • 47. 47 UNIVERSITY OF MARYLAND EXHIBIT 16: UNIT SQUARE FOOTAGE EXHIBIT 17: UNIT RENTAL RATES Workforce housing has been factored into the unit mix for the apartment buildings. The maximum amount of rent the development team could charge for workforce housing was determined by accounting for the area’s average median income (AMI). This is shown in Exhibit 18. EXHIBIT 18: WORKFORCE HOUSING MONTLY RENTAL RATES Parcel D and E contain a total of 593 apartment units. The unit breakdown for each parcel is shown in Exhibits 19 and 20. Type Sq./Ft Mix Total SF Studio/1BA 460 1 460 1BR/1BA 820 2 1,640 2BR/2BA 1,080 1 1,080 2,360 4 3,180 Average unit size is: 795 Apartment Rentals Type Rent Mix Total $ Studio/1BA 2,000$ 1 2,000 1BR/1BA 2,700$ 2 5,400 2BR/2BA 3,500$ 1 3,500 8,200$ 4 10,900 Average unit rent is: 2,725 Apartment Rentals Max/Inc. Rent WFH- AMI % $107,096 30.00% Monthly 101-120% 5.00% $107,096 32,129$ 2,677$ 81-100% 5.00% 86,748$ 26,024$ 2,169$ 71-80% 5.00% 76,038$ 22,811$ 1,901$ 61-70% 3.00% 65,329$ 19,599$ 1,633$ 50-60% 2.00% 53,548$ 16,064$ 1,339$ Workforce Apartment Rents
  • 48. 48 UNIVERSITY OF MARYLAND EXHIBIT 19: UNIT MIX FOR PARCEL D EXHIBIT 20: UNIT MIX FOR PARCEL E Parcel F contains for-sale condominiums. Workforce housing has also been taken into account when determining the unit mix. The unit mix for Parcel F is shown Exhibit 21. EXHIBIT 21: CONDOMINIUM UNIT MIX FOR PARCEL F Studio 30 2,000$ 59,215$ S -WFH 27 1,885$ 50,884$ 1-Bdrm 104 2,700$ 281,380$ 1 -WFH 9 2,300$ 20,700$ 2-Bdrm 48 3,500$ 166,626$ 2 -WFH 9 2,677$ 24,097$ TOTAL 226 602,901$ UNIT MIX - PARCEL D Studio 56 2,000$ 111,596$ S -WFH 36 1,577$ 56,774$ 1-Bdrm 166 2,700$ 447,108$ 1 -WFH 18 2,300$ 41,400$ 2-Bdrm 74 3,500$ 258,293$ 2 -WFH 18 2,677$ 48,193$ TOTAL 367 963,364$ UNIT MIX - PARCEL E Studio 18 450,000$ 8,100,000$ S -WFH 10 405,900$ Avg. 4,059,000$ 1-Bdrm 40 550,000$ 22,000,000$ 1 -WFH 9 452,833$ Avg. 4,075,500$ 2-Bdrm 25 685,000$ 17,125,000$ 2 -WFH 3 568,550$ Avg. 1,705,650$ TOTAL 105 543,478$ 57,065,150$ CONDOMINIUM UNIT MIX
  • 49. 49 UNIVERSITY OF MARYLAND The uses and sources for each phase are shown in Exhibits 22, 23, 24, and 25. EXHIBIT 22: PHASE ONE SOURCES & USES EXHIBIT 23: PHASE II USES AND SOURCES OF FUNDS EXHIBIT 24: PHASE III USES AND SOURCES OF FUNDS EXHIBIT 25: PHASE IV USES AND SOURCES OF FUNDS USES - Development Costs Total Total Acquisition 6,451,203$ Total Construction 63,790,505$ Total Construction Financing 3,901,462$ Total Soft Costs 13,989,306$ Total Permanent Financing 469,082$ Total Reserves 930,000$ Total Development Fees4% 3,730,482$ Total Development Cost 93,262,041$ SOURCES - Development Financing Proposed Funding Equity Equity - Owner(s) (Land/Building) 6,451,203$ Equity - Owner Other 26,190,511$ Debt 1st Mortgage (Conventional) 60,620,326 Total Financing/Equity: 93,262,041$ PARCEL C - Estimated Development Costs USES - Development Costs Total Total Acquisition 22,990,209$ Total Constrcution 131,052,757$ Total Construction Financing 8,026,981$ Total Soft Costs 23,573,569$ Total Permanent Financing 980,036$ Total Reserves 1,965,000$ Total Development Fees 4% 7,857,856$ Total Development Cost 196,446,408$ SOURCES - Development Financing Proposed Funding Equity Equity - Owner(s) (Land/Building) 22,990,209$ Equity - Owner Other 45,766,034$ Debt 1st Mortgage (Conventional) 127,690,166 Total Financing/Equity: 196,446,408$ PARCEL B - Estimated Development Costs USES - Development Costs Total Total Acquisition 30,536,388$ Total Construction 205,348,799$ Total Construction Financing 18,139,144$ Total Soft Costs 47,927,656$ Total Permanent Financing 1,600,012$ Total Reserves 3,185,000$ Total Development Fees 4% 12,780,708$ Total Development Cost 319,517,708$ SOURCES - Development Financing Proposed Funding Equity Equity - Owner(s) (Land/Building) 19,541,086$ Equity - Owner Other 92,290,112$ Debt 1st Mortgage (Conventional) 207,686,511 Total Financing/Equity: 319,517,708$ PARCELS D, E and F - TOTAL DEVELOPMENT COSTS USES - Development Costs Total Total Acquisition 11,157,021$ Total Construction 42,193,057$ Total Construction Financing 3,727,053$ Total Soft Costs 15,322,598$ Total Permanent Financing 383,740$ Total Reserves 765,000$ Total Development Fees 4% 3,064,520$ Total Development Cost 76,612,988$ SOURCES - Development Financing Proposed Funding Equity Equity - Owner(s) (Land/Building) 10,002,304$ Equity - Owner Other 16,812,242$ Debt 1st Mortgage (Conventional) 49,798,442 Total Financing/Equity: 76,612,989$ PARCEL A - TOTAL DEVELOPMENT COSTS
  • 50. 50 UNIVERSITY OF MARYLAND PHASE I - BREAKDOWN We’ve positioned the office high-rise on Parcel C nearest the Metro station to justify charging new office rents in an effort to minimize risk and increase yield for this portion of development. The office high-rise will include 114 parking spaces and 11,149 square feet of first floor retail space along with the 355,566 square feet of office space. The total development cost for Phase 1 is over $93,000,000. The office high-rise is the first building constructed, and we are projecting lease-up activity over the course of 24 months. There will be a flurry of pre-leasing activity given the building’s proximity to the Metro and the unique arch built within the building to draw retail tenants. We project that all the retail and three floors of office will be pre-leased with full occupancy on December 31, 2019. The follow leasing factors have been taken into consideration is shown in Exhibit 26. EXHIBIT 26: LEASING CONCESSION FACTORS In Phase I, adjacent parking is available in existing surface lots. As a result, we show parking with this building contributing to NOI towards the end of the two year lease-up period. A detailed financial breakdown of the first two years of operation during lease-up is given in Exhibit 27. EXHIBIT 27: TWO YEAR LEASE-UP PROJECTION (See Appendix V.1 for full chart – Phase I Lease-up Schedule) Tenant Improvement Allowance 15.00% Free Rent Impact 10.00% Other Concessions 2.00% 2018 1ST YEAR LEASE UP SCHEDULE January June December Total UNITS/FLOORS LEASED PER MONTH: RENTAL INCOME: 417,477$ 770,498$ 909,722$ 8,697,401$ Total Potential Income 1,553,023$ 1,553,023$ 1,553,023$ 18,636,276$ EFFECTIVE GROSS REVENUE: 417,477$ 770,498$ 909,722$ 8,697,401$ TOTAL OPERATING EXPENSES: 442,937$ 442,937$ 442,937$ 5,315,242$ NET OPERATING INCOME (NOI): 220,822$ 478,528$ 580,161$ 5,341,873$ 2019 2ND YEAR LEASE UP SCHEDULE January June December Total UNITS/FLOORS LEASED PER MONTH: RENTAL INCOME: 956,129$ 1,191,477$ 1,553,023$ 14,894,618$ Total Potential Income 1,553,023$ 1,553,023$ 1,553,023$ 18,636,276$ EFFECTIVE GROSS REVENUE: 956,129$ 1,191,477$ 1,553,023$ 14,894,618$ TOTAL OPERATING EXPENSES: 442,937$ 442,937$ 442,937$ 5,315,242$ NET OPERATING INCOME (NOI): 614,039$ 569,819$ 877,133$ 4,550,599$
  • 51. 51 UNIVERSITY OF MARYLAND Exhibit 28 shows the construction draw schedule for the two years of construction. It is assumed that the draws are equally divided over 24 months with 10% retainage paid in the final month of construction leading up to substantial completion. EXHIBIT 28: PHASE I CONSTRUCTION DRAW (See Appendix V.2 for full chart – Phase I Construction Draw) A detail financial analysis for the first 10 years of operation following lease-up has been created for this report. Below, Exhibits 29 through 34 detail this analysis. For the income and expense state, an annual rental increase of 3% and annual expense increase of 3.25% has been factored into the projection with a 5.25% vacancy and concession rate. EXHIBIT 29: PHASE I BASIS & DEPRECIATION BREAKDOWN (See Appendix V.3 for full chart – Phase I Basis & Depreciation Breakdown) EXHIBIT 30: INCOME & EXPENSE STATEMENT Phase I CONSTRUCTION DRAW SCHEDULE Construction Months: 24 Construction Loan: 63,790,505$ Loan Origination: 0.50% 318,953$ Rate: 6.75% Retainage: 10.00% Month Draw Retainage Net Draw Balance Interest Jan-16 2,416,307$ (241,631)$ 2,174,676$ 2,174,676$ 12,233$ Dec-16 2,416,307$ (241,631)$ 2,174,676$ 26,096,116$ 146,791$ Dec-17 8,215,444$ 2,657,938$ 13,772,950$ 63,790,505$ 212,031$ TOTALS 63,790,505$ 63,790,505$ 3,582,510$ Uses (Non Basis) Commercial 7 - Year Amortize TDC Basis Expense Depreciable Depreciation (Expense) Total Development Cost 90,226,732$ 89,050,196$ 7,236,203$ 82,598,993$ -$ 391,535$ INCOME & EXPENSE STATEMENT Year 1 Year 5 Year 10 Period Beginning Date Jan-20 Jan-24 Jan-29 Period Ending Date Dec-20 Dec-24 Dec-29 TOTAL POTENTIAL RENTAL INCOME: 19,195,364$ 21,604,552$ 25,045,597$ Vacancy & Credit Loss 978,404$ 1,101,203$ 1,276,596$ EFFECTIVE RENTAL INCOME: 18,216,960$ 20,503,349$ 23,769,001$ GROSS OPERATING INCOME: 18,216,960$ 20,503,349$ 23,769,001$ TOTAL OPERATING EXPENSES: 7,609,570$ 8,648,093$ 10,147,771$ NET OPERATING INCOME (NOI): 10,607,390$ 11,855,256$ 13,621,230$
  • 52. 52 UNIVERSITY OF MARYLAND (See Appendix V.4 for full chart – Phase I Income & Expense Statement) EXHIBIT 31: PHASE I MORTGAGE & DEPRECIATION SCHEDULE (See Appendix V.5 for full chart – Phase I Mortgage & Depreciation Schedule Exhibit 32 determines both the before and after tax sale proceed returns. It also accounts for accumulated depreciation at time of sale and the block’s adjusted basis. A 6 percent capitalization rate is used to determine the sales price. EXHIBIT 32: PHASE I SALES SCHEDULE (See Appendix V.6 for full chart – Phase I Sales Schedule) Year 1 Year 5 Year 10 Period Beginning Date: Jan-20 Jan-24 Jan-29 Period Ending Date: Dec-20 Dec-24 Dec-29 1st Mortgage Calculation Yearly Principal Reduction 1,126,026$ 1,388,517$ 1,804,284$ Yearly Interest Expense 2,541,206$ 2,278,715$ 1,862,948$ Commercial Cost Recovery (Depreciation) Calculation 39 Year Straight Line Beginning Balance 78,363,147$ 69,891,456$ 59,301,841$ Remaining Book Value 76,245,224$ 67,773,533$ 57,183,918$ Total Annual Cost Recovery 2,117,923$ 2,117,923$ 2,117,923$ Amortization Ending Balance 344,551$ 281,905$ 203,598$ Sale Schedule Year 1 Year 5 Year 10 Jan-20 Jan-24 Jan-29 Period Beginning Date Cap Rate Dec-20 Dec-24 Dec-29 Period Ending Date 6.00% = Total Sale Proceeds Before Tax 118,393,332$ 143,086,387$ 178,899,692$ = Sales Proceeds After Tax 95,964,614$ 115,206,324$ 143,309,246$ Calculations Acquisition Basis 89,050,196$ 89,050,196$ 89,050,196$ + Capital Additions -$ -$ -$ - Cost Recovery 4,235,846$ 4,235,846$ 4,235,846$ = Adjusted Basis 84,814,351$ 84,814,351$ 84,814,351$ Sales Price 176,789,836$ 197,587,601$ 227,020,502$ - Cost of Sale 10,607,390$ 11,855,256$ 13,621,230$ - Adjusted Basis 84,814,351$ 84,814,351$ 84,814,351$ = Total Gain 81,368,096$ 100,917,994$ 128,584,921$
  • 53. 53 UNIVERSITY OF MARYLAND EXHIBIT 33: PHASE I 10 YEAR FINANCIAL STATEMENT (See Appendix V.7 for full chart – Phase I Financial Statement) EXHIBIT 34: PHASE I BEFORE-TAX, AFTER-TAX AND UNLEVERAGED IRR AND NPV (See Appendix V.8 for full chart – Phase I Before-Tax, After-Tax and Unleveraged IRR and NPV) ANNUAL CASH FLOW ANALYSIS Net Operating Income 10,607,390$ 11,855,256$ 13,621,230$ - Annual Debt Service 3,667,232$ 3,667,232$ 3,667,232$ = Cash Flow Before Tax 6,940,158$ 8,188,024$ 9,953,998$ - Less Tax Liability 2,432,366$ 3,051,612$ 3,946,126$ Cash Flow After Tax 4,507,792$ 5,136,412$ 6,007,872$ Debt Service Coverage Ratio: 2.89 3.23 3.71 Internal Rate of Return Before Tax: 24.11% Before Tax Net Present Value: 28,434,588$ Internal Rate of Return After Tax: 20.51% After Tax Net Present Value: 14,954,679$ Unleveraged Internal Rate of Return: 16.41% Unleveraged Net Present Value: 7,685,446$