Transcriptome analysis identifies over 1,300 plant genes modulated during cell division
1. Transcriptome analysis during cell division in plants
Peter Breyne*†‡
, Rozemarijn Dreesen*†
, Klaas Vandepoele*, Lieven De Veylder*, Frank Van Breusegem*,
Lindy Callewaert*, Stephane Rombauts*, Jeroen Raes*, Bernard Cannoot*, Gilbert Engler§
, Dirk Inze´*¶
,
and Marc Zabeau*
*Department of Plant Systems Biology, Flanders Interuniversity Institute for Biotechnology, Ghent University, K.L. Ledeganckstraat 35, B-9000 Ghent,
Belgium; and §Laboratoire Associe´ de l’Institut National de la Recherche Scientifique, Ghent University, B-9000 Ghent, Belgium
Communicated by Marc C. E. Van Montagu, Ghent University, Ghent, Belgium, September 16, 2002 (received for review May 15, 2002)
Using synchronized tobacco Bright Yellow-2 cells and cDNA-
amplified fragment length polymorphism-based genomewide ex-
pression analysis, we built a comprehensive collection of plant cell
cycle-modulated genes. Approximately 1,340 periodically ex-
pressed genes were identified, including known cell cycle control
genes as well as numerous unique candidate regulatory genes. A
number of plant-specific genes were found to be cell cycle mod-
ulated. Other transcript tags were derived from unknown plant
genes showing homology to cell cycle-regulatory genes of other
organisms. Many of the genes encode novel or uncharacterized
proteins, indicating that several processes underlying cell division
are still largely unknown.
Essential genes controlling cell cycle progression have been
characterized in different organisms. Recently, genomewide
expression analysis in yeast (1) and human cells (2) using
microarrays has enlarged the collection of cell cycle-modulated
genes to several hundred genes with known and unknown
functions. Their transcriptional regulation is strict, and genes
involved in the same biological process are most often coex-
pressed. In plants, the basic regulatory mechanisms controlling
cell cycle progression also have been studied (3). Although the
core cell cycle genes are conserved among higher eukaryotes,
basic developmental differences between plants and other or-
ganisms imply that plant-specific regulatory pathways exist that
control cell division (4). Especially for events occurring at
mitosis, plants are thought to have developed unique mecha-
nisms regulating karyo- and cytokinesis. A typical plant cell is
surrounded by a rigid wall and cannot, as such, divide by
constriction. Instead, a new cell wall between daughter nuclei is
formed by a unique cytoskeletal structure called the phragmo-
plast, whose position is dictated by another cytoskeletal array
called the preprophase band (5). Another major difference
between plant and animal mitosis is found in the structure of the
mitotic spindles: in animals they are tightly centered at the centro-
some, whereas in plants they have a diffuse appearance (6).
To identify plant genes involved in cell division and control of
cell cycle progression, we performed a genomewide expression
analysis of cell cycle-modulated genes in the tobacco Bright
Yellow-2 (BY2) cell line. This unique cell line can be synchro-
nized to high levels with different types of inhibitors of cell cycle
progression (7, 8). Because of the lack of extensive molecular
resources such as genomic sequences, cDNA clones, or ESTs for
tobacco, a microarray-based approach cannot be used for tran-
scriptome analysis. Therefore, we used the cDNA-amplified
fragment length polymorphism (AFLP) technology to identify
and characterize cell cycle-modulated genes in BY2. cDNA-
AFLP is a sensitive and reproducible fragment-based technology
that has a number of advantages over other methods for genome-
wide expression analysis (9): it does not require prior sequence
information, it allows the identification of novel genes, and it
provides quantitative expression profiles. After a detailed anal-
ysis, we found that Ϸ10% of the transcripts are periodically
expressed, in agreement with the results obtained in yeast (1).
This comprehensive collection of plant cell cycle-modulated
genes provides a basis for unraveling the basic mechanisms
underlying the plant cell cycle.
Materials and Methods
Synchronization of BY2 Cells and Sampling of Material. Synchroni-
zation, sampling of material, and evaluation of cell cycle pro-
gression and synchrony levels were performed (www.psb.
rug.ac.be͞papers͞pebre͞pnas.htm). Briefly, tobacco (Nicotiana
tabacum L. cv. BY2) cultured cell suspension was synchronized
by blocking cells in early S phase with aphidicolin (Sigma; 5
mg͞liter). After removal of the drug, samples were taken every
hour, starting from the release from the aphidicolin block (time
0) until 11 h later. The mitotic index was determined by counting
the number of cells undergoing mitosis under fluorescence
microscopy after the DNA had been stained with 5 mg͞liter
4Ј,6-diamidino-2-phenylindole (Sigma). DNA content was mea-
sured by flow cytometry.
cDNA-AFLP Analysis. RNA extraction, cDNA synthesis, and
cDNA-AFLP analysis were performed (www.psb.rug.ac.be͞
papers͞pebre͞pnas.htm). Double-stranded cDNA (500 ng) was
used for cDNA-AFLP analysis. The restriction enzymes used
were BstYI and MseI (New England Biolabs).
For preamplifications, a MseI primer without selective nucle-
otides was combined with a BstYI primer containing either a T
or a C as nucleotide at the 3Ј extremity. The obtained amplifi-
cation mixtures were diluted 600-fold and 5 l was used for final
selective amplifications (www.psb.rug.ac.be͞papers͞pebre͞
pnas.htm). All possible primer combinations with a total of two
and three additional selective nucleotides were used for tran-
script profiling.
Characterization of AFLP Fragments. Bands corresponding to dif-
ferentially expressed transcripts were isolated from the gel, and
eluted DNA was reamplified under the same conditions as for
selective amplification. Sequence information was obtained ei-
ther by direct sequencing of the reamplified PCR product with
the selective BstYI primer or after cloning the fragments in
pGEM-T easy (Promega) and sequencing of individual clones.
The obtained sequences were compared with nucleotide and
protein sequences in the publicly available databases by BLAST
sequence alignments (10). When available, tag sequences were
replaced with longer EST or isolated cDNA sequences to
increase the chance of finding significant homology. Based on
the homology, transcript tags were classified in functional groups
as shown in Table 1.
Quantitative Measurements of the Expression Profiles and Data
Analysis. Gel images were analyzed quantitatively with AFLP-
QUANTARPRO image analysis software (Keygene, Wageningen,
Abbreviations: AFLP, amplified fragment length polymorphism; BY2, Bright Yellow-2; CDK,
cyclin-dependent kinase.
†P.B. and R.D. contributed equally to this work.
‡Present address: Institute for Forestry and Game Management, B-9500 Geraardsbergen,
Belgium.
¶To whom correspondence should be addressed. E-mail: dirk.inze@gengenp.rug.ac.be.
www.pnas.org͞cgi͞doi͞10.1073͞pnas.222561199 PNAS ͉ November 12, 2002 ͉ vol. 99 ͉ no. 23 ͉ 14825–14830
CELLBIOLOGY
2. The Netherlands). All visible AFLP fragments were scored, and
individual band intensities were measured per lane. The ob-
tained data were used to determine the quantitative expression
profile of each transcript. The raw data were corrected for
differences in total lane intensities, after which each individual
gene expression profile was variance-normalized (www.psb.
rug.ac.be͞papers͞pebre͞pnas.htm). CLUSTER and TREEVIEW
software (11) was used for hierarchical, average linkage cluster-
ing. Quality-based clustering was performed with a newly de-
veloped software program (12). This program is similar to
K-means clustering, except that the number of clusters need not
be defined in advance and the expression profiles that do not fit
in any cluster are rejected. The minimal number of tags in a
cluster and the required probability of genes belonging to a
cluster were set to 10 and 0.95, respectively. With these param-
eters, 86% of all of the tags were grouped in 21 distinct clusters.
Results and Discussion
Identification and Characterization of Cell Cycle-Modulated Genes.
Tobacco BY2 cells were synchronized by blocking cells in early
S phase with aphidicolin, an inhibitor of DNA polymerase ␣.
After the inhibitor had been released, 12 time points at 1-h
intervals, covering the cell cycle from S phase until M͞G1
transition, were sampled. Flow cytometry and determination of
the mitotic index showed that most cells exited S phase 4 h after
release from blocking and that the peak of mitosis was reached
at 8 h. mRNA extracted from each time point was subjected to
cDNA-AFLP-based transcript profiling. Quantitative temporal
accumulation patterns of Ϸ10,000 transcript tags were deter-
mined and analyzed. In total, Ϸ1,340 transcript tags were
modulated significantly during the cell cycle. Hierarchical clus-
tering (13) of the expression profiles resulted in four large groups
with expression peaks at S, early G2, late G2, or M phase. Within
each of these groups, several smaller clusters of genes with
similar expression patterns were distinguished (Fig. 1). By
quality-based clustering (14) (see Materials and Methods), 21
different clusters were identified (see www.psb.rug.ac.be͞
papers͞pebre͞pnas.htm). In agreement with the hierarchical
clustering analysis, the four largest clusters (Fig. 2, clusters 1–4)
correspond to the S, early G2, late G2, and M phases and together
contain 65% of all of the tags. An additional cluster (Fig. 2C,
cluster 5), not clearly separated in the hierarchical clustering,
includes genes with peak expression in G1 phase and contains
another 5% of the tags. The remaining clusters are much smaller
and most often (e.g., clusters 6, 9, 10, and 18) include genes with
narrow temporal expression patterns. In addition to these clus-
ters, three small groups of genes displaying elevated expression
during two cell cycle phases also were distinguished by quality-
based clustering (Fig. 2D).
Once the transcript tags were sequenced, homology searches
revealed that 36.5% of the tags were significantly homologous to
genes of known functions, and 13.1% of the tags matched a
cDNA or genomic sequence without allocated function. In
contrast, no homology with a known sequence was found for
50.4% of the tags. In agreement with findings in yeast and human
(1, 2), genes of known function belong to diverse functional
classes (Table 1), revealing that several biological processes are
at least partially under temporal transcriptional control during
the cell cycle in plants. In general, the observed transcript
accumulation profiles and cell cycle specificity correlate well
with the functional properties of the corresponding genes. It is
interesting that the number of transcription factors with G2-
phase specificity is high, which may be related to the induction
of genes involved in M phase-specific processes. The overrep-
resentation of RNA-processing genes in the M phase might
indicate that posttranscriptional regulation is involved in gene
activity during mitosis. Because de novo transcription is severely
reduced during mitosis (13), RNA processing (differential RNA
stability, alternative splicing) or specific chromatin deconden-
sation could be an alternative regulatory mechanism. Intrigu-
ingly, transcript tags with homology to a gene of unknown
function were overrepresented in the M phase as well (Table 1).
The principal differences in cell cycle events between plants and
other organisms occur during mitosis; therefore, it is tempting to
speculate that several of these transcripts correspond to still
uncharacterized plant-specific genes triggering these events.
Remarkably, several of the tags homologous to a publicly
available sequence have no Arabidopsis homolog, indicating that,
in addition to conserved genes, different plant species possess
unique sets of cell cycle-modulated genes. Although many of
these tags may be too short to significantly match an Arabidopsis
sequence, analysis of longer cDNA clones corresponding to a
subset of tags has revealed that Ϸ25% of the sequences are
indeed novel (unpublished results).
The Core Cell Cycle Machinery. Several tags coincide with genes
belonging to the core cell cycle machinery and exhibiting distinct
expression profiles (Fig. 3). Transcript tags from five B1- or
Table 1. Functional classification of transcript tags
Function Tags S, 27.7% G2, 15.8% M, 52.9% G1, 3.6%
Cell cycle control 30 5͞8 (0.078) 8͞5 (0.068) 14͞16 (0.114) 3͞1
Cell wall 35 6͞10 (0.047) 4͞6 (0.136) 25͞18 (7.1e؊3) 0͞1
Cytoskeleton 43 1͞12 (1.2eϪ5) 4͞7 (0.090) 38͞22 (2.1e؊7) 0͞2
Hormone response 13 6͞4 (0.113) 1͞2 (0.277) 6͞7 (0.185) 0͞0
Kinases͞phosphatases* 27 4͞8 (0.039) 1͞4 (0.059) 19͞14 (0.025) 1͞1
Protein synthesis 50 15͞14 (0.116) 5͞8 (0.087) 29͞26 (0.079) 1͞2
Proteolysis 21 2͞6 (0.026) 1͞3 (0.144) 17͞11 (0.039) 1͞1
Replication and modification 74 57͞20 (4.2e؊19) 8͞12 (1.0eϪ5) 8͞39 (1.0eϪ18) 1͞3
RNA processing 20 1͞6 (6.8eϪ3) 1͞3 (0.137) 18͞11 (8.1e؊4) 0͞0
Signal transduction 10 1͞3 (0.121) 3͞2 (0.201) 6͞5 (0.205) 2͞0
Stress response 20 6͞6 (0.192) 2͞3 (0.229) 10͞10 (0.159) 2͞1
Transcription factors 27 4͞8 (0.039) 10͞4 (3.0e؊3) 12͞14 (0.112) 1͞1
Transport and secretion† 31 5͞9 (0.047) 2͞5 (0.076) 21͞16 (0.031) 3͞1
Unknown function 175 37͞48 (0.015) 19͞28 (0.014) 112͞93 (8.3e؊4) 7͞6
The observed͞expected number of tags within the different cell cycle phases is given together with the probability values between
parentheses as calculated based on the binomial distribution function, except for the G1 phase because the figures were too small. A
significant enrichment of tags of a functional group within a particular cell cycle phase is indicated in bold.
*Only kinases and phosphatases with unknown biological function.
†Except small GTP-binding proteins, which are classified under signal transduction.
14826 ͉ www.pnas.org͞cgi͞doi͞10.1073͞pnas.222561199 Breyne et al.
3. B2-type cyclins as well as from a D2-type cyclin show mitotic
accumulation and exhibit a narrow temporal expression profile,
confirming previous studies (14, 15). Based on the transcription
patterns, the six A-type cyclins fall into three groups that
sequentially appear during the cell cycle, adding more data to
earlier observations (16). Two groups have a rather broad
window of transcript accumulation: one group, homologous to
A3-type cyclins, is expressed during S phase and disappears
during G2 phase, whereas the other corresponds to A2-type
cyclins and shows expression that increases at mid-S phase and
decreases during M phase, except for one transcript, which is
specific for S phase. The third group, containing an A1-type
cyclin, has the same expression pattern as the B- and D2-type
cyclins. Several tags derived from genes encoding the plant-
specific B-type cyclin-dependent kinases (CDKs) were also
identified. CDKB1 and CDKB2 peak at the G2͞M transition,
slightly before the mitotic cyclins, as described (17). In contrast
to what has been observed in partially synchronized alfalfa cell
cultures (18), the transcript levels of the tags homologous to a
C-type CDK accumulated differentially during the cell cycle.
The transcripts were present during late M phase and early S
phase, suggesting that CDKC is active during the G1 phase.
In addition to these well-characterized cell cycle-regulatory
genes, we have identified several tags derived from genes
encoding transcription factors and protein kinases or phospha-
tases with known or putative roles in cell cycle control. One tag
with a sharp peak of transcript accumulation 1 h before the B-
and D-type cyclins corresponds to a 3R-MYB transcription
factor. Recently, a closely related 3R-MYB has been shown to
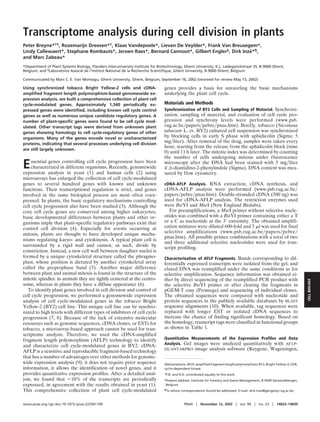
Fig. 1. Hierarchical clustering of cell cycle-modulated transcript tags. Only
the tags with a significant homology to a known sequence are included. Each
row represents a tag with the relative transcript accumulation patterns shown
over the 12 consecutive time points (columns). Red and green reflect, respec-
tively, transcriptional activation and repression relative to the average ex-
pression level over the time course; gray represents missing data. The den-
drogram shows the relationships between clusters of genes with similar
expression pattern. The main clusters, corresponding to the different cell cycle
phases, are indicated on the right. The full cluster based on the entire data set
can be obtained at www.psb.rug.ac.be͞papers͞pebre͞pnas.htm.
Fig. 2. Gene expression profiles obtained by quality-based clustering of all
transcript tags. Shown are the trend lines of 16 clusters containing 97% of the
genes and covering the entire time course as indicated at the top. S phase-
specific gene clusters are grouped in A, gene clusters with peak expression
between S and M phases in B, and the M and G1 phase-specific clusters in
C. (D) Three small clusters of genes with peak expression during two cell
cycle phases. An overview of the complete clusters can be obtained at
www.psb.rug.ac.be͞papers͞pebre͞pnas.htm.
Breyne et al. PNAS ͉ November 12, 2002 ͉ vol. 99 ͉ no. 23 ͉ 14827
CELLBIOLOGY
4. activate B-type cyclins and other genes with an M phase-specific
activator domain (19). Another tag peaking in the M phase is
homologous to the CCR4-associated protein CAF. CAF forms
a complex with CCR4 and DBF2, resulting in a transcriptional
activator involved in the regulation of diverse processes including
cell wall integrity, methionine biosynthesis, and M͞G1 transition
(20). Most of the tags with similarity to protein kinases and
phosphatases show M phase-specific accumulation (Table 1).
Although the true identity and putative cell cycle-related func-
tion remains unclear for the majority, one is highly homologous
to a dual-specificity phosphatase. This type of phosphatase plays
a crucial role in cell cycle control in yeast and animals (21).
Another M phase-specific tag is homologous to prohibitin. In the
mammalian cell cycle, prohibitin represses E2F-mediated tran-
scription via interaction with retinoblastoma, thereby blocking
cellular proliferation (22).
Protein degradation by the ubiquitin-proteasome pathway also
plays an important role in the control of cell cycle progression
at both G1͞S transition and exit from mitosis. Although there is
little evidence for cell cycle-modulated expression of the genes
encoding the various components of the ubiquitin-proteasome
complexes, some proteins accumulate in a cell cycle-dependent
way (23). In the human cell cycle study, several genes that are
implicated in proteolytic control of cell cycle progression have
been identified (2). Similarly, we isolated several tags from genes
encoding ubiquitin-conjugating enzyme (E3), ubiquitin-protein
ligase (E2), and proteasome components with an M phase-
specific expression pattern. Another transcript tag that accumu-
lates during late M phase is similar to cathepsin B-like proteins,
which are proteolytically active and degrade diverse nuclear
proteins, including retinoblastoma (24).
Although all core cell cycle-regulatory genes that control the
G2͞M transition whose expression is known to be cell cycle
modulated were identified, genes encoding proteins controlling
G1͞S transition, such as retinoblastoma and E2F, were not
found. These genes were probably missed because the G1͞S
transition was not included in our analysis, a hypothesis sup-
ported by the finding that the early targets of E2F, such as
polymerase ␣ and ribonucleotide reductase, are already present
at high levels at the beginning of the time course.
Genes Involved in DNA Replication and Modification. In agreement
with studies performed in yeast and human fibroblasts, tran-
scripts encoding proteins involved in DNA replication and
modification accumulated during S phase and exhibited broad
temporal expression profiles (Fig. 4). Different replication fac-
tors, DNA polymerase ␣, and histones H3 and H4 are already
present at the onset of the time course, indicating that they are
induced before the time point of the aphidicolin arrest. Inter-
estingly, most of histones H1, H2A, and H2B appear somewhat
later than H3 and H4, perhaps indicating that they are deposited
into the nucleosomes after H3 and H4 (25, 26). As expected
given that the three proteins are part of the replication-coupling
assembly factor complex that mediates chromatin assembly (26),
the profile of the homolog of the anti-silencing function 1 (ASF1)
protein is similar to that of histones H3 and H4. Genes encoding
high-mobility group proteins reach the highest accumulation
during late G2, consistent with the subsequent steps involved in
the chromatin folding and structuring. Tags derived from genes
encoding proteins involved in DNA modification, such as S-
Fig. 3. Expression profiles and hierarchical clustering of the main known and
putative core cell cycle genes. The identity of each tag is given on the right.
Fig. 4. Hierarchical clustering of transcript tags derived from genes involved in
DNA replication and modification. The identity of each tag is given on the right.
14828 ͉ www.pnas.org͞cgi͞doi͞10.1073͞pnas.222561199 Breyne et al.
5. adenosyl-L-methionine synthase and cytosine-5-methyltrans-
ferase are found in the histone cluster. Tags from methionine
synthase genes, precursors for S-adenosyl-L-methionine syn-
thase, accumulate during M phase. In contrast, these genes are
expressed during late S phase in yeast (1).
Genes involved in chromatin remodeling and transcriptional
activation or repression have been identified as well. One gene
is a histone deacetylase with highest transcript accumulation
during G2 phase. Another gene belongs to the SNF2 family of
chromodomain proteins with an M phase-specific expression
pattern. Interestingly, one tag corresponds to a mammalian
inhibitor of growth 1 (p33-ING1) protein. The human ING1
protein has DNA-binding activity and might be involved in
chromatin-mediated transcriptional regulation (27). The protein
was shown to accumulate during S phase (28), which is in
agreement with the expression profile we observed. The yeast
homologs of ING1 are components of the histone acetyltrans-
ferase complex and show similarity to the retinoblastoma-
binding protein 2 (29). Another tag, homologous to the
Arabidopsis MSI3 protein, follows a similar expression profile.
MSI-like proteins are involved in the regulation of histone
acetylation and deacetylation and in chromatin formation (30).
The expression profiles of the various ribonucleotide reduc-
tase genes are more complex. One gene is already expressed at
high levels at the beginning of the time course and its expression
is restricted to S phase, as described (31). In contrast, another
gene is highly expressed in S phase and reappears at lower levels
during M phase, whereas a third is M phase-specific. This latter
expression profile has also been described for a ribonucleotide
reductase gene from Xenopus where the encoded protein ap-
pears to be involved in microtubulin nucleation (32).
Numerous other transcript tags with S-phase specificity were
found in addition to the ones involved in DNA replication and
modification. Most interestingly, one of these tags is homologous
to a mammalian gene encoding a TRAF-interacting protein
(TRIP), which is a component of the tumor necrosis factor
(TNF) signaling complex, and promotes cell death when com-
plexed with TRAF (33). Another S phase-specific tag shows
homology to the RING finger domain of inhibitor of apoptosis
proteins that are also involved in the TNF signaling pathway.
Because the TNF signaling pathway is unknown in plants, a
detailed analysis will be required to determine the true func-
tional properties of these plant homologs.
Modulated Expression of Genes Required for Mitosis and Cytokinesis.
Several paralogous genes that encode either ␣- or -tubulin were
highly induced and accumulated before the mitotic index peak or
during early M phase (data not shown). Whereas, in yeast, tubulins
fluctuate only moderately during the cell cycle (1), we found that,
in BY2, tubulin genes are highly cell cycle-modulated. This tran-
scriptional regulation is in agreement with previous demonstrations
of de novo transcription of ␣- and -tubulin genes during different
cellular processes (34). In our analysis, no ␥-tubulin genes showed
up, confirming published data that the amount of ␥-tubulin is
constant in dividing BY2 cells (35).
Most of the kinesins we identified fall in the same cluster as
the tubulins peaking before mitosis. Interestingly, two tags have
a distinct transcription pattern and appear in another gene
cluster. Their window of transcript accumulation is very narrow
and coincides with the peak of mitosis. Most interestingly, these
tags correspond to the plant-specific phragmoplast-associated
type of kinesin, PAKRP1 (36). A chromokinesin not yet de-
scribed in plants was identified as well. This type of motor
protein uses DNA as cargo and plays a role in chromosome
segregation and metaphase alignment (37).
Among the M phase-specific kinases we identified, two were
unambiguously recognized to be involved in cytokinesis. One is
Aurora, a protein kinase with a key role in the control of
chromosome segregation, centrosome separation, and cytokine-
sis in yeast and animals (38), but not yet described in plants. The
other is NRK1, a mitogen-activated protein kinase kinase that is
phosphorylated by NPK1, a kinase involved in regulating the
outward growth of the phragmoplast and cell plates (39).
Hormonal Regulation and Cell Cycle-Modulated Gene Expression. A
number of genes belonging to the class of auxin-induced genes were
also differentially expressed. Cell cycle-modulated expression of
auxin-induced genes has never been observed before although
auxins together with cytokinins are the two major groups of plant
hormones that affect cell division (3). The genes we identified fall
into two groups based on their transcript accumulation profiles
(data not shown). The first group displays an early S phase-specific
expression pattern and consists of the parA, parB, and parC genes.
Induction of the par genes is most often observed in response to
stress conditions (40). The fact that the transcripts rapidly disappear
after release from the cell cycle-blocking agent might indicate a
stress response rather than a cell cycle-dependent auxin response.
More interesting is the second group of genes with transcripts
accumulating during early M phase. This group includes auxin
response factor 1 (ARF1), an auxin transporter as well as different
members of the early auxin response AUX͞IAA gene family. ARF1
is a transcription factor that binds to a particular auxin response
element (41). Additional studies suggest that the activity of ARF1
is controlled by its dimerization with members of the AUX1͞IAA
family (42). The similarity in temporal expression profiles we
observed supports these findings and suggests that these proteins
mediate an auxin response necessary for cell cycle progression.
Conclusion
Using tobacco BY2 as model system together with cDNA-AFLP-
based transcript profiling, we were able to build a comprehensive
inventory of plant cell cycle-modulated genes. The data obtained
confirm earlier results and observations, while numerous unique
findings were made. Detailed characterization of the transcript tags
corresponding to putative novel genes and genes of unknown
function will help further unravel the control mechanisms and
regulatory networks underlying the cell cycle and to identify and
characterize the genes involved in plant-specific processes occurring
during cell division. Very recently, a study using microarrays to
analyze cell cycle-modulated gene expression in Arabidopsis has
been published (43). The obtained data are in agreement with our
results and also indicate that a large number of genes involved in
different biological processes are differentially expressed.
We are grateful to Gerrit Beemster and Marnik Vuylsteke for comments,
the sequencing group for its cloning and sequencing efforts, Rudy Vander-
haeghen for isolating and analyzing cDNA clones, and Martine De Cock for
help with the manuscript. This work was funded in part by the European
Union (ECCO QLG2-CT1999-00454), Ge´noplante (Project BI1999087),
and CropDesign N.V. (0235). K.V. and L.C. are indebted to the Vlaams
Instituut voor de Bevordering van het Wetenschappelijk-Technologisch
Onderzoek in de Industrie for predoctoral fellowships. L.D.V. is a post-
doctoral fellow of the Fund for Scientific Research (Flanders).
1. Spellman, P. T., Sherlock, G., Zhang, M. Q., Iyer, V. R., Anders, K., Eisen,
M. B., Brown, P. O., Botstein, D. & Futcher, B. (1998) Mol. Biol. Cell 9,
3273–3297.
2. Cho, R. J., Huang, M., Campbell, M. J., Dong, H., Steinmetz, L., Sapinoso, L.,
Hampton, G., Elledge, S. J., Davis, R. W. & Lockhart, D. J. (2001) Nat. Genet.
27, 48–54.
3. Stals, H. & Inze´, D. (2001) Trends Plant Sci. 6, 359–364.
4. den Boer, B. G. W. & Murray, J. A. H. (2000) Trends Cell Biol. 10,
245–250.
5. Smith, L. G. (1999) Curr. Opin. Plant Biol. 2, 447–453.
6. Marc, J. (1997) Trends Plant Sci. 2, 223–230.
7. Nagata, T., Nemoto, Y. & Hasezawa, S. (1992) Int. Rev. Cytol. 132, 1–30.
Breyne et al. PNAS ͉ November 12, 2002 ͉ vol. 99 ͉ no. 23 ͉ 14829
CELLBIOLOGY
6. 8. Planchais, S., Glab, N., Inze´, D. & Bergounioux, C. (2000) FEBS Lett. 476,
78–83.
9. Breyne, P. & Zabeau, M. (2001) Curr. Opin. Plant Biol. 4, 138–142.
10. Altschul, S. F., Madden, T. L., Scha¨ffer, A. A., Zhang, J., Zhang, Z., Miller, W.
& Lipman, D. J. (1997) Nucleic Acids Res. 25, 3389–3402.
11. Eisen, M. B., Spellman, P. T., Brown, P. O. & Botstein, D. (1998) Proc. Natl.
Acad. Sci. USA 95, 14863–14868.
12. De Smet, F., Marchal, K., Mathijs, J., Thijs, G., De Moor, B. & Moreau, Y.
(2002) Bioinformatics 8, 735–746.
13. Gottesfeld, J. M. & Forbes, D. J. (1997) Trends Biochem. Sci. 22, 197–202.
14. Mironov, V., De Veylder, L., Van Montagu, M. & Inze´, D. (1999) Plant Cell
11, 509–521.
15. Sorrell, D. A., Combettes, B., Chaubet-Gigot, N., Gigot, C. & Murray, J. A. H.
(1999) Plant Physiol. 119, 343–351.
16. Reichheld, J.-P., Chaubet, N., Shen, W. H., Renaudin, J.-P. & Gigot, C. (1996)
Proc. Natl. Acad. Sci. USA 93, 13819–13824.
17. Porceddu, A., Stals, H., Reichheld, J.-P., Segers, G., De Veylder, L., De Pinho
Barroˆco, R., Casteels, P., Van Montagu, M., Inze´, D. & Mironov, V. (2001)
J. Biol. Chem. 276, 36354–36360.
18. Magyar, Z., Me´sza´ros, T., Miskolczi, P., Dea´k, M., Fehe´r, A., Brown, S.,
Kondorosi, E., Athanasiadis, A., Pongor, S., Bilgin, M., et al. (1997) Plant Cell
9, 223–235.
19. Ito, M., Araki, S., Matsunaga, S., Itoh, T., Nishihama, R., Machida, Y., Doonan,
J. H. & Watanabe, A. (2001) Plant Cell 13, 1891–1905.
20. Liu, H.-Y., Toyn, J. H., Chiang, Y.-C., Draper, M. P., Johnston, L. H. & Denis,
C. L. (1997) EMBO J. 16, 5289–5298.
21. Coleman, T. R. & Dunphy, W. G. (1994) Curr. Opin. Cell Biol. 6, 877–882.
22. Wang, S., Nath, N., Adlam, M. & Chellappan, S. (1999) Oncogene 18,
3501–3510.
23. del Pozo, J. C. & Estelle, M. (2000) Plant Mol. Biol. 44, 123–128.
24. Fu, Y.-H. F., Nishinaka, T., Yokoyama, K. & Chiu, R. (1998) FEBS Lett. 421,
89–93.
25. Luger, K., Ma¨der, A. W., Richmond, R. K., Sargent, D. F. & Richmond, T. J.
(1997) Nature 389, 251–260.
26. Tyler, J. K., Adams, C. R., Chen, S.-R., Kobayashi, R., Kamakaka, R. T. &
Kadonaga, J. T. (1999) Nature 402, 555–560.
27. Cheung, K.-J., Jr., & Li, G. (2001) Exp. Cell Res. 268, 1–6.
28. Garkavtsev, I. & Riabowol, K. (1997) Mol. Cell. Biol. 17, 2014–2019.
29. Loewith, R., Meijer, M., Lees-Miller, S. P., Riabowol, K. & Young, D. (2000)
Mol. Cell. Biol. 20, 3807–3816.
30. Ach, R. A., Taranto, P. & Gruissem, W. (1997) Plant Cell 9, 1595–1606.
31. Chaboute´, M.-E., Combettes, B., Cle´ment, B., Gigot, C. & Philipps, G. (1998)
Plant Mol. Biol. 38, 797–806.
32. Takada, S., Shibata, T., Hiraoka, Y. & Masuda, H. (2000) Mol. Biol. Cell 11,
4173–4187.
33. Lee, S. Y., Lee, S. Y. & Choi, Y. (1997) J. Exp. Med. 185, 1275–1285.
34. Stotz, H. U. & Long, S. R. (1999) Plant Mol. Biol. 41, 601–614.
35. Stoppin-Mellet, V., Peter, C. & Lambert, A. M. (2000) Plant Biol. 2,
290–296.
36. Lee, Y. R. J. & Liu, B. (2000) Curr. Biol. 10, 797–800.
37. Wang, S.-Z. & Adler, R. (1995) J. Cell Biol. 128, 761–768.
38. Bischoff, J. R. & Plowman, G. D. (1999) Trends Cell Biol. 9, 454–459.
39. Nishihama, R., Ishikawa, M., Araki, S., Soyano, T., Asada, T. & Machida, Y.
(2001) Genes Dev. 15, 352–363.
40. Abel, S. & Theologis, A. (1996) Plant Physiol. 111, 9–17.
41. Ulmasov, T., Hagen, G. & Guilfoyle, T. J. (1997) Science 276, 1865–1868.
42. Walker, L. & Estelle, M. (1998) Curr. Opin. Plant Biol. 1, 434–439.
43. Menges, M., Hennig, L., Gruissem, W. & Murray, J. A. (2002) J. Biol. Chem.,
in press.
14830 ͉ www.pnas.org͞cgi͞doi͞10.1073͞pnas.222561199 Breyne et al.