Hispanic Workers Occupational Fatal Injuries in 2014
1. Occupational Fatal Injuries Affecting Hispanic Workers in the
United States in 2014 - More Prevention Work is Needed
Rixio E. Medina, CSP, ASP, STS, CPP
Board of Certified Safety Professionals
Champaign, IL
Introduction
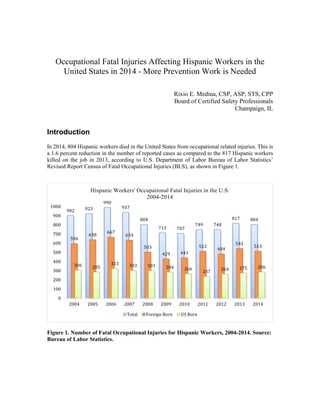
In 2014, 804 Hispanic workers died in the United States from occupational related injuries. This is
a 1.6 percent reduction in the number of reported cases as compared to the 817 Hispanic workers
killed on the job in 2013, according to U.S. Department of Labor Bureau of Labor Statistics’
Revised Report Census of Fatal Occupational Injuries (BLS), as shown in Figure 1.
Figure 1. Number of Fatal Occupational Injuries for Hispanic Workers, 2004-2014. Source:
Bureau of Labor Statistics.
902 923
990
937
804
713 707
749 748
817 804
596
638
667
634
503
429 441
512
484
542
513
306 285
323 303 301 284 266
237
264 275 286
0
100
200
300
400
500
600
700
800
900
1000
2004 2005 2006 2007 2008 2009 2010 2011 2012 2013 2014
Hispanic Workers' Occupational Fatal Injuries in the U.S.
2004-2014
Total Foreign Born US Born
2. 2
The preliminary result reveals that every day of the year two Hispanic workers died from job
related injuries, comprising 16.7 percent of the 4,821 fatal occupational injuries reported in the U.S.
in 2014, as shown in Figure 2.
Figure 2. Fatal Occupational Injuries for Worker’s Race or Ethnic Origin. Source: Bureau
of Labor Statistics, 2014.
This paper discusses data about Hispanics and Hispanic workers in the U.S., the
characterization of the occupational fatal injuries affecting Hispanic workers in 2014, some of the
accident prevention strategies applied to protect these workers, and the need to reinforce the
development of safety competency of Hispanic workers’ front-line supervisors to help improve
their safety performance.
Discussion
Hispanics and Hispanic Workers in the United States
The impact created by Hispanic workers’ fatal injuries is greater than the number of cases reported
in the U.S. To fully understand the severity that the inadequate safety performance of Hispanic
workers could pose to the nation’s social and economic wellbeing, we need to consider the
following information related to Hispanics and Hispanic workers, published by the U.S. Census
Bureau1
and the BLS2
:
• In 2014, the Hispanic population of the U.S. increased 1.2 million (2.1 percent) as compared
to 2013, reaching a new high of 55.4 million (17.4 percent of the total U.S. population).1
• Hispanics accounted for 48.3 percent of the 27.7 million foreign-born persons in the U.S. labor
force.2
• Hispanic workers in the U.S. made up 16.1 percent (approximately 23.5 million) of the total
workforce in 2014.2
69.1%
16.7%
9.9%
2.8% 1.5%
0%
10%
20%
30%
40%
50%
60%
70%
80%
90%
100%
White Hispanic Black or African
American
Asian Others
Percent
Fatal Occupational Injuries by Worker's Race or Ethnic
Group
2014
3. 3
• The unemployment rate for foreign-born Hispanics was 5.9 percent in 2014, while U.S. born
Hispanics’ unemployment rate was 8.8 percent.2
• Ten percent of Hispanic workers were represented by unions in 2014.2
• Hispanic is the largest ethnic or racial minority in the U.S. as of July 2013.1
• The world’s second largest Hispanic population lives in the U.S., second only to Mexico, as of
2010.1
• Of Hispanics 5 years of age and older, 74 percent spoke Spanish at home in 2012.1
• Of Hispanics 25 years of age and older, 64 percent had at least a high school education in 2012.1
• The Hispanic population is projected to increase to 25 percent of U.S. total population by 2030,
as presented in Figure 3.1
Figure 3. Percent Hispanic of the U.S. Population: 2004-2040. Source: U.S. Census Bureau
1980 Decennial Censuses; July 1, 2013, Population Estimates; 2012 National Population
Projections.
Fatal Injuries Cases
The latest revised Hispanic workers’ occupational fatal injuries data was reported by BLS in
September 2015 and is summarized in Table 1.
Just like the information published by the BLS for 2013, the most recent data reveals that the
majority of Hispanic workers killed by occupational injuries in 2014 were male, wage and salary
workers, born outside the U.S., Mexico being the predominant birthplace country. The leading
characteristics of these workers include their occupation as being in the construction trade, the
accidents as having happened in the construction industry, those incidents being transportation
incidents, with accidents happening mostly in the states of Texas and California, vehicles being the
primary source causing the injuries, as workers perform vehicular and transportation activities, with
multiple body parts of workers affected. The majority of the fatalities happened between the months
6%
9% 13%
17%
19%
22%
25%
Census
Estimate
Projection
Hispanic of the U.S. Population
1980-2040
2040 2030 2020 2013 2000 1990 1980
4. 4
of April and September, with Wednesday having the highest count in the work week, and industrial
places or premises as the leading locations.
Table 1. Characterization of Occupational Fatal Injuries Data. Bureau of Labor Statistics’
Preliminary Report Census of Fatal Occupational Injuries in 2014.
Characteristics Sub characteristics Number of
Deaths
Percentage
2014 2013 2014 2013
Fatal Injuries 804 817
Place of Birth Foreign-Born 513 542 64 66
Native-Born 291 275 36 34
Leading Birthplace
Countries for
Foreign-Born
Mexico 336 360 42 44
El Salvador 23 51 3 6
Guatemala 39 37 5 5
Honduras 23 21 3 3
Cuba 34 19 4 2
Employee Status Wage and salary workers 697 723 87 89
Self-employed 107 94 13 11
Gender Women 41 42 5 5
Men 763 774 95 95
Age 19 years or less 12 16 1 2
20 to 24 years 74 66 9 8
25 to 34 years 181 178 23 22
35 to 44 years 211 219 27 27
45 to 54 years 170 180 21 22
55 to 64 years 111 118 14 14
65 years and over 45 39 5 5
Leading
Occupations
Construction trades workers 186 198 23 24
Motor vehicle operators 122 109 15 13
Ground maintenance workers 59 70 7 9
Agriculture workers 44 55 6 7
Material moving workers 55 51 7 6
Leading Industries Construction 233 241 29 30
Administrative and support, waste
management, remediation services
100 116 13 14
Transportation and warehousing 84 83 10 10
Agriculture, forestry, fishing and
hunting
68 70 9 9
Manufacturing 64 54 8 7
5. 5
Table 1. Characterization of Occupational Fatal Injuries Data. Bureau of Labor Statistics’
Preliminary Report Census of Fatal Occupational Injuries in 2014.
Characteristics Sub characteristics Number of
Deaths
Percentage
2014 2013 2014 2013
Leading Events or
Exposure
Transportation incidents 289 267 36 33
Fall, slips and trip 178 179 22 22
Contact with objects, equipment 122 169 15 21
Violence, injuries by person or
animals
111 113 14 14
Fires and explosions 28 19 4 2
Leading State of
Incident
Texas 206 192 26 24
California 130 194 16 24
Florida 60 68 8 8
New York 50 32 6 4
Arizona 31 25 4 3
Primary Source
Causing the Injury
Vehicles 308 299 38 37
Persons, plants, animals, minerals 140 137 17 17
Structure and surfaces 124 140 15 17
Machinery 75 78 9 10
Parts and materials 40 49 5 5
Part of Body
Affected
Multiple body parts 354 364 44 45
Head 177 183 22 22
Body system 121 109 15 13
Trunk 101 124 13 15
Neck 39 30 5 4
Worker Activity Vehicular and transportation
operations
291 266 36 32
Construction, repair, cleaning 209 224 26 27
Using or operating tools/machinery 111 100 14 17
Physical activity, walkinh 61 52 8 6
Material handling 43 65 5 8
Trimester of
Incident
January – March 164 165 20 20
April – June 213 226 27 28
July – September 236 225 29 27
October – December 191 201 24 25
6. 6
Table 1. Characterization of Occupational Fatal Injuries Data. Bureau of Labor Statistics’
Preliminary Report Census of Fatal Occupational Injuries in 2014.
Barriers Affecting Hispanic Workers’ Safety
Barriers identified by several stakeholders as common conditions that affect the safety performance
of Hispanic workers include:
• Working hazardous or dirty jobs in hazardous industries such as construction and agriculture.
• Limited English proficiency and communication difficulty with supervisors and coworkers.
• Workers’ cultural barriers, perceiving risk and relationship with people in position of authority
differently.
• Insufficient or no knowledge of how to safely use tools, machinery, equipment and material.
• Lacking knowledge of workers’ rights and an unwillingness to report job hazards or unsafe
working conditions for fear of losing their jobs, retaliation or, in some cases, deportation.
• Limited or improper use of personal protective equipment.
Hispanic Workers’ Supervisors - Safety Force Multiplier
Many initiatives to improve the safety and workers’ rights knowledge of Hispanic workers have
been implemented by the Occupational Safety and Health Administration (OSHA), the National
Institute of Occupational Safety and Health (NIOSH), state plans, and professional, trade, faith-
based and labor organizations in the past 10 years. These initiatives helped reduce Hispanic
workers’ work-related fatalities by approximately 200 in 2014, as compared to the fatalities
registered in 2006. The emphasis so far has been to distribute information in Spanish, provide more
worker training such as the OSHA 10 and 30 hours training, provide additional assistance to small
employers, and increase regulatory enforcement. Recently, the American Society of Safety
Engineers (ASSE) supported the translation of 52 toolbox talk topics developed by The Center for
Construction Research and Training (CPWR), in close cooperation with NIOSH. The toolbox talks
include case studies, discussion questions, and site-specific actions now available in Spanish.
Characteristics Sub characteristics Number of
Deaths
Percentage
2014 2013 2014 2013
Day of Week of
Incident
Monday 131 141 16 17
Tuesday 137 126 17 16
Wednesday 142 133 18 16
Thursday 127 149 16 18
Friday 134 124 17 15
Saturday 75 96 9 12
Sunday 58 42 7 5
Leading Location Industrial place and premise 236 242 30 30
Street and highway 235 213 30 26
Private residence 132 126 17 15
Public building 68 83 8 10
Farms 46 51 6 6
Employers’ parking lots 23 23 3 3
7. 7
Unfortunately, some employers fail to recognize and effectively develop their front-line crew
leaders/supervisors’ safety competency as a critical component in achieving better safety
performance among Hispanic workers. Leaders and supervisors with safety competency are critical
when no full-time safety professionals are available to continuously support workers in the field.
Supervisors have the greatest opportunity to implement actions that have a positive impact on safety
performance of Hispanic workers on a daily basis, improving the company’s bottom line results.
Companies that exhibit exceptional safety performance understand that safety is a function of
management and supervision. These companies develop and support their supervisors’ safety
competency. Safety Competent Supervisors are truly a Safety Force Multiplier.
The Board of Certified Safety Professionals (BCSP), with the participation of hundreds of
certified safety professionals, test assessors and certification experts, has defined the safety
competency criteria for supervisors. Again, this criteria is not for safety professionals or
practitioners, but for line-organization supervisors. The criteria is currently composed of 13 roles
or responsibilities, 73 areas of knowledge and 71 skills essential to support safe work practices and
conditions. Some of these areas of responsibilities, include:
• Risk assessment and pre-task hazard analysis
• New employee orientation
• Evaluation of work practices to minimize risk of work injuries and incidents
• Coaching and correcting
• Take appropriate action for unsafe acts and conditions
• Facilitate a proactive safety culture
• Develop and provide safety training
BCSP also established related education and experience requirements, as well as a process
to test, certify and maintain certification of supervisors’ safety competencies. BCSP is a not-for-
profit organization with over 45 years of experience setting and certifying safety technical
competency criteria for safety, health and environmental practitioners worldwide, enhancing
careers, advancing the profession and protecting society. The Safety Trained Supervisor (STS) -
geared toward manufacturing, transportation and general industry - and the Safety Trained
Supervisor Construction (STSC) are the certifications for supervisors administered by BCSP. By
the end of 2015, more than 8,700 managers and supervisors achieved the STS or STSC
certifications.
Many incidents happen because adequate supervisor safety competency is not available at
the right time and right place. These incidents can become catastrophic events when the safety
competency required to reduce or mitigate the impact is lacking. Hispanic workers will benefit
from having the support and guidance of supervisors or crew leaders with demonstrated
competencies in safety and health continuously available at the worksites.
Conclusion
The number of Hispanic workers’ occupational fatal injury cases preliminarily reported in the U.S.
by the Bureau of Labor Statistics was three percent lower in 2014, as compared to 2013. Despite
this small reduction in fatalities, the number of fatal injury cases in 2014 was at least five percent
higher than each year between 2009 and 2012. On the other hand, the U.S. Census Bureau projects
a significant growth of the Hispanic population. Work-related fatal injuries among Hispanic
8. 8
workers have the potential of becoming a bigger problem, with a large social and economic impact
to the U.S.
The periodic safety education of employers, supervisors and Hispanic workers will provide
a solid foundation to improve the safety performance of Hispanic workers in the U.S. In addition
to the prevention strategies in use, the incorporation of the Board of Certified Safety Professionals’
STS and STSC certifications can energize organizations’ line managers and supervisors, reducing
Hispanic workers’ occupational fatal injuries and acting as Safety Force Multipliers.
Bibliography
Bureau of Labor Statistics (BLS). 2015. “National Census of Fatal Occupational Injuries in 2015
(Revised Results).” (www.bls.gov/news.release/pdf/cfoi.pdf).
Bureau of Labor Statistics (BLS). 2015. “Fatal occupational injuries incurred by Hispanic or
Latino workers, 2009-2014.” (www.bls.gov/iif/oshwc/cfoi/hispanic.pdf).
Death of the Job, The Toll of Neglect, American Federation of Labor and Congress of Industrial
Organizations (AFL-CIO), 23rd Edition, 2014, Washington, DC.
NIOSH, ASSE [2015]. Overlapping vulnerabilities: the occupational safety and health of young
workers in small construction firms. By Flynn MA, Cunningham TR, Guerin RJ, Keller B,
Chapman LJ, Hudson D, Salgado C. Cincinnati, OH: U.S. Department of Health and Human
Services, Centers for Disease Control and Prevention, National Institute for Occupational
Safety and Health, DHHS (NIOSH) Publication No. 2015- 178.
The Center for Construction Research and Training (CPWR). Spanish Resources.
(www.cpwr.com).