SlideShare a Scribd company logo
1 of 12
Download to read offline
Balance sheet basics.doc page 1 of 12
Balance Sheet Basics
Balance Sheet is the snap shot of financial strength of any company at any point of time. It gives
the details of the assets and the liabilities of the company. Understanding balance sheet is very
important because it gives an idea of the financial strength of the company at any given point of
time. Following is the balance sheet of Global Telesystems for the year ending on 31st Mar'
2000:
As on 31-3-00
Assets
Gross Block 3978.55
Net Block 2790.57
Capital WIP 66.72
Investments 454.33
Inventory 610.81
Receivables 1546.81
Other Current Assets 3673.67
Balance Sheet Total 9142.92
Liabilities
Equity Share Capital 434.12
Reserves 5815.65
Total Debt 2096.69
Creditors and Acceptances 393.91
Other current liab/prov. 402.55
Balance Sheet Total 9142.92
Let us take a look at each of its components.
Assets
Gross block is the sum total of all assets of the company valued at their cost of acquisition. This
is inclusive of the depreciation that is to be charged on each asset. Net block is the gross block
less accumulated depreciation on assets. Net block is actually what the asset are worth to the
company.
Capital work in progress, sometimes at the end of the financial year, there is some construction
or installation going on in the company, which is not complete, such installation is recorded in
the books as capital work in progress because it is asset for the business.
Balance sheet basics.doc page 2 of 12
If the company has made some investments out of its free cash, it is recorded under the head
investments.
Inventory is the stock of goods that a company has at any point of time.
Receivables include the debtors of the company, i.e., it includes all those accounts which are to
give money back to the company. Other current assets include all the assets, which can be
converted into cash within a very short period of time like cash in bank etc.
Equity Share capital is the owner's equity. It is the most permanent source of finance for the
company. Reserves include the free reserves of the company which are built out of the genuine
profits of the company. Together they are known as net worth of the company.
Total debt includes the long term and the short debt of the company. Long term is for a longer
duration, usually for a period more than 3 years like debentures. Short term debt is for a lesser
duration, usually for less than a year like bank finance for working capital.
Creditors are those entities to which the company owes money.
Other liabilities and provisions include all the liabilities that do not fall under any of the above
heads and various provisions made.
Role of Balance Sheet in Investment Decision making
After analyzing the income statement, move on to the balance sheet and continue your analysis.
While the income statement recaps three months' worth of operations, the balance sheet is a
snapshot of what the company's finances look like only on the last day of the quarter. (It's much
like if you took every statement you received from every financial institution you have dealings
with — banks, brokerages, credit card issuers, mortgage banks, etc. — and listed the closing
balances of each account.)
When reviewing the balance sheet, keep an eye on inventories and accounts receivable. If
inventories are growing too quickly, perhaps some of it is outdated or obsolete. If the accounts
receivable are growing faster than sales, then it might indicate a problem, such as lax credit
policies or poor internal controls. Finally, take a look at the liability side of the balance sheet.
Look at both long-term and short-term debt. Have they increased? If so, why? How about
accounts payable?
After you've done the numerical analysis, read the comments made by management. They
should have addressed anything that looked unusual, such as a large increase in inventory.
Management will also usually make some statements about the future prospects of business.
These comments are only the opinion of management, so use them as such.
When all is said and done, you'll probably have some new thoughts and ideas on your
investments. By all means, write them down. Use your new benchmark as a basis for analyzing
your portfolio next time. Spending a few minutes like this each quarter reviewing your holdings
can help you stay on track with your investment goals.
===========================================================================
Balance sheet basics.doc page 3 of 12
Company Valuation
Whenever people talk about equity investments, one must have come across the word
"Valuation". In financial parlance, Valuation means how much a company is worth of. Talking
about equity investments, one should have an understanding of valuation.
Valuation means the intrinsic worth of the company. There are various methods through which
one can measure the intrinsic worth of a company. This section is aimed at providing a basic
understanding of these methods of valuation. They are mentioned below:
Net Asset Value (NAV)
NAV or Book value is one of the most commonly used methods of valuation. As the name
suggests, it is the net value of all the assets of the company. If you divide it by the number of
outstanding shares, you get the NAV per share.
One way to calculate NAV is to divide the net worth of the company by the total number of
oooutstanding shares. Say, a company’s share capital is Rs. 100 crores (10 crores shares of Rs.
10 each) and its reserves and surplus is another Rs. 100 crores. Net worth of the company would
be Rs. 200 crores (equity and reserves) and NAV would be Rs. 20 per share (Rs. 200 crores
divided by 10 crores outstanding shares).
NAV can also be calculated by adding all the assets and subtracting all the outside liabilities from
them. This will again boil down to net worth only. One can use any of the two methods to find
out NAV.
One can compare the NAV with the going market price while taking investment decisions.
Discounted Cash Flows Method (DCF)
DCF is the most widely used technique to value a company. It takes into consideration the cash
flows arising to the company and also the time value of money. That’s why, it is so popular.
What actually happens in this is, the cash flows are calculated for a particular period of time (the
time period is fixed taking into consideration various factors). These cash flows are discounted to
the present at the cost of capital of the company. These discounted cash flows are then divided
by the total number of outstanding shares to get the intrinsic worth per share.
===========================================================================
Value Analysis
What is Fundamental Analysis?
Fundamental analysis is the analysis, wherein the investment decisions are taken on the basis of
the financial strength of the company. There are two approaches to fundamental analysis, viz.,
Balance sheet basics.doc page 4 of 12
E-I-C analysis or the Top Down approach to Fundamental analysis and C-I-E analysis or the
Bottom up approach. In the following section, we explain both these approaches.
Economy-Industry-Company Analysis
In the Top down approach, first of all the overall Economy is analyzed to judge the general
direction, in which the economy is heading. The direction in which the economy is heading has a
bearing on the performance of various industries. Thats why Economy analysis is important. The
output of the Economy analysis is a list of industries, which should perform well, given the
general trend of the economy and also an idea, whether to invest or not in the given economic
conditions.
Measuring a Company's Financial Health
Gaining a true picture of a company's finances means not only scrutinizing the financial
statements but also analyzing relationships among various assets and liabilities, thus highlighting
trends in a company's performance and changes in its financial strength relative to its
competitors.
This section explains how to read a company's financial statements. Measures of value :
Book value is based on historical costs, not current values, but can provide an important
measure of the relative value of a company over time. Book value can be figured as assets
minus liabilities, or assets minus liabilities and intangible items such as goodwill; either way, the
figure that results is the company's net book value. This is contrasted with its market
capitalization, or total share price value, which is calculated by multiplying the outstanding
shares by their current market price.
You can also compare a company's market value to its book value on a per-share basis.
Divide book value by the number of shares outstanding to get book value per share and compare
the result to the current stock price to help determine if the company's stock is fairly valued.
Most stocks trade above book value because investors believe that the company will grow and
the value of its shares will, too. When book value per share is higher than the current share
price, a company's stock may be undervalued and a bargain to investors. In fact, the company
itself may be a bargain, and hence a takeover target.
Price/earnings ratio (P/E) is the more common yardstick of a company's value. It is the
current stock price divided by the earnings per share for the past year. For example, a stock
selling for $20 with earnings of $2 per share has a P/E of 10. While there's no set rule as to
what's a good P/E, a low P/E is generally considered good because it may mean that the stock
price has not risen to reflect its earning power. A high P/E, on the other hand, may reflect an
overpriced stock or decreasing earnings. As with all of these ratios, however, it's important to
compare a company's ratio to the ratios of other companies in the same industry.
A measure of solvency
Debt-to-equity ratio provides a measure of a company's debt level. It is calculated by dividing
total liabilities by shareholders' equity. A ratio of 1-to-2 or lower indicates that a company has
relatively little debt. Ratios vary, however, depending on a company's size and its industry, so
compare a company's financial ratios with those of its industry peers before drawing conclusions.
Balance sheet basics.doc page 5 of 12
Measures of liquidity
Current ratio. Current assets divided by current liabilities yields the current ratio, a measure of
a company's liquidity, or its ability to meet current debts. The higher the ratio, the greater the
liquidity. As a rule of thumb, a healthy company's current ratio is 2-to-1 or greater.
===========================================================================
Cracking Ratios
Ratio Analysis
Ratio Analysis is the most commonly used analysis to judge the financial strength of a company.
A lot of entities like research houses, investment bankers, financial institutions and investors
make use of this analysis to judge the financial strength of any company.
This analysis makes use of certain ratios to achieve the above-mentioned purpose. There are
certain benchmarks fixed for each ratio and the actual ones are compared with these
benchmarks to judge as to how sound the company is. The ratios are divided into various
categories, which are mentioned below:
Profitability ratios
Profitability ratios speak about the profitability of the company. The various profitability ratios
used in the analysis are, operating margin (operating profit divided by net sales), gross margin
(gross profit divided by net sales) net profit margin (net profit divided by net sales), return on
equity (net profit divided by net worth of the company) and return on investment (operating
profit divided by total assets). As obvious from the name, the higher these ratios the better for
the company.
Solvency ratios
These ratios are used to judge the long-term solvency of a firm. The most commonly used ratios
are – Debt Equity ratio (total debt divided by total equity), Long term debt to equity ratio (long
term debt divided by equity). While the accepted norm for debt equity ratio differs from industry
to industry, the usual accepted norm for D/E is 2:1. It should not be more than this. For certain
industries, a higher D/E is accepted, e.g., in banking industry, a debt equity ratio of 12:1 is
acceptable.
Liquidity ratios
These ratios are used to judge the short-term solvency of a firm. These ratios give an indication
as to how liquid a firm is. The most commonly used ratios are – Current ratio (all current assets
divided by current liabilities) and quick ratio (current assets except inventory divided by current
liabilities). The accepted norm for current ratio is 1.5:1. It should not be less than this.
Balance sheet basics.doc page 6 of 12
Turnover ratios
These ratios give an indication as to how efficiently a company is utilizing its assets. The most
commonly ratios are sales turnover ratio, inventory turnover ratio (average inventory divided by
net sales) and asset turnover ratio (net sales divided by total assets). The higher these ratios,
the better for the company.
Valuation Ratios
Valuation ratios give an indication as to whether the stock is underpriced or overpriced at any
point of time. The most commonly used ratios are Price to Earnings (P/E) ratio and price to book
value (PBV) ratio. But care has to be taken while interpreting these ratios. While P/E ratio of a
company should be compared with the industry P/E and the P/E of the competitors, it is the PBV
that can distort.
While a lower PBV usually means a lower valuation, there can be a case where a low PBV can be
because of a very huge capital base of the company. In such a case, the stock might be
overvalued but the PBV will indicate that the stock is undervalued. On the other extreme, a
higher PBV usually means overvalued stock but that can also be because the company has a
very small capital base. So care has to taken while interpreting these ratios.
Coverage ratios
These ratios give an indication about the repayment capabilities of a company. The most
commonly used coverage ratios are Interest coverage ratio (Interest outstanding divided by
earnings before interest and taxes) and debt service coverage ratio (earnings before interest and
taxes plus all non cash charges divided by interest outstanding plus the term loan repayment
installment). The acceptable norm for DSCR is 2:1.
===========================================================================
Profit Loss Fundas
Income statement is the snapshot of a company's operational performance for a particular period
of time. It takes the company's revenues and expenses and gives profits as output. Take a look
at the income statement of Global Telesystems:
As on 31-3-00
Net Sales 6065.51
Operating Income 6265.63
Operating Profit 2116.57
Operating PBDT 1700.44
Operating Profit before Tax(PBT) 928.63
Non-Operating Income 1562.62
Balance sheet basics.doc page 7 of 12
Extraordinary/Prior Period income -171.23
Tax 30.00
Profit after tax(PAT) 2290.02
Cash Profit 3061.82
Dividend-Equity 100.40
Let us take a look at the different components of a Income statement of Global Tele.
First item is Net sales. Net sales is simply the product of quantity sold by the company and the selling price
per unit. This figure is net of excise duty to be paid on the goods sold.
Next comes operating expenses. These are the expenses incurred in producing the goods like labor, fuel,
power etc. The difference between the net sales and the operating expenses is the operating profit, which is
a commonly used statistic to judge the operational performance of the company.
Next comes Operating profit before Tax, which is nothing but operating profit less interest and depreciation.
Non operating income is the income that is not earned in the normal course of business operations. For
example, interest earned on any investments made etc. Extra ordinary income is non recurring income that
is earned only once and there are not any chances of earning that income again like profit on sale of any
asset etc.
Cash profit is PAT plus any all non cash charges, i.e., charges that don't entail actual cash outflow but they
are only notional charges like depreciation, writing off preliminary expenses etc.
Role of Earnings in Investment decisions
Once you have got an understanding of Income statement, you are ready to be your own
analyst. Each quarter, companies release their earnings, and, for companies using the traditional
calendar-year approach, the quarter ended on New Year's Eve. Earnings season is a great time
to re-evaluate your current holdings to make sure the companies you own are living up to your
expectations. But before earnings are even announced, you might want to review why you made
the investment in the first place.
Whenever you buy a stock, write down in three or four sentences why you are doing so. State
your reasons as objectively as you can. You might want to list such items as revenue growth,
sustainability of earnings or growth over time, increased market share, increased gross margins,
price targets for the stock or any other reasons you have for making the investment. For
example, you might write, "I am buying XYZ Corp. because I think earnings will grow at a rate of
20% per year and that the price/earnings multiple will increase from its current level of 16 to
between 22 and 25."
By writing down your assumptions and your goals, you'll create a benchmark that can help you
see over time how the company is performing. If you've never done this in the past, you might
want to start now.
Now take a look at the earnings. The earnings per share (EPS) number is a good place to start.
The EPS is the total net profit of the company divided by the number of shares of stock
outstanding. But don't just look at the actual EPS and compare it to the expected EPS. Pull out
your calculator and crunch some numbers.
Balance sheet basics.doc page 8 of 12
First of all, has the number of shares outstanding changed significantly? Has the company
bought back a large chunk of its stock? If so, earnings may have improved on a per-share basis,
but may have stayed flat or even declined in real terms. Next, you should be on the lookout for
any one-time charges. You will want to remove the effect of the one-time charge, as it only
creates noise and makes year-over-year comparisons more difficult. Any one-time charge or gain
will be stated in per-share amounts as a footnote. Just subtract it from the EPS if it is a gain, or
add it back if it is a loss. Once you have the EPS number exclusive of one-time items, you can
compare it to the EPS from the same quarter last year to see how much growth has occurred.
Compare the growth figure of your company to others in the same industry.
Once you have gotten a good feel for the EPS, it's time to look at the actual numbers on the
income statement. Here are some questions to ponder while you have your calculator in hand.
What does the growth rate in sales look like? How was it last quarter? Are gross margin
percentages better or worse than they have been historically? Are expenses increasing faster
than sales?
Using your written benchmarks for the stock, create a couple of additional questions to help you
compare the company's results with your own stated assumptions.
===========================================================================
Cash Flow Curries
Think of cash as the lifeblood of every business. Without cash flow, no business can function and
without an accurate picture of cash flow, no investor can have a complete picture of a company.
A company's statement of cash flows reflects how readily the business can pay its bills, and it
provides important information about a company's sources and uses of cash. But measuring cash
flow solely from a balance sheet or an income statement is difficult and potentially misleading.
That's because not all revenue is received when a company earns it, and not all expenses are
paid when incurred. (For an explanation of financial statements, see "What's the Deal With
Financial Statements?" plus "Understanding the Income Statement" and "How to Read a Balance
Sheet," presented earlier in this series.)
The difference between an income statement and a statement of cash flows is roughly analogous
to the difference between a credit card statement and a checkbook ledger. A credit card
statement includes charges that haven't been paid off yet, while an updated checkbook ledger
indicates where cash has been spent and whether there's enough to pay off debts like a credit
card bill. Similarly, a company's expenses and revenues are recorded on an income statement,
regardless of whether cash has changed hands yet. A statement of cash flows, on the other
hand, traces where cash came from and where it was used.
The statement also separates cash generated by the normal operations of a company from that
gleaned through other investing and financing activities, as seen in the sample statement of cash
flows of the hypothetical XYZ Corp.
Balance sheet basics.doc page 9 of 12
Statement of cash flows for XYZ Corp. for the year ending
Dec. 31, 1999 (in millions)
From operations
Net income Rs.30
Plus depreciation 15
Plus decrease in receivables (less increase) (20)
Less increase in inventories (10)
Plus increase in accounts payable (less decrease) 0
Net increase (decrease) in cash from operations 15
From investing
Less purchase of equipment (150)
From financing
Bonds issued 100
Net increase (decrease) in cash (35)
Cash at beginning of year 127
Cash at end of year Rs. 92
Cash flow from operations:
Cash flow from operations starts with net income (from the income statement) and adjusts out
all of the non-cash items. Income and expenses on the income statement are recorded when a
company earns revenue or incurs expenses, not necessarily when cash is received or paid. To
figure out how much cash the company received or spent, net income is adjusted for any sales
or expenditures made on credit and not yet paid with cash.
Examples of these adjustments are shown above. XYZ had Rs.20 million in sales to customers
who had not paid the company as of the end of the year, so this increase in receivables is
subtracted. XYZ also reported Rs.15 million in depreciation expense (the portion of long-lasting
assets, such as buildings, that is written off each year); depreciation is not a cash item, so it is
added back. Finally, XYZ purchased Rs.10 million of additional inventory that was not sold as of
year end. Because the inventory was not sold, it is not considered an expense. But because cash
was used in the purchase, the Rs.10 million is subtracted from net income. Net cash received
from XYZ's operations, after the above adjustments, was Rs.15 million.
Cash flow from investing
Cash flow from investing includes cash received from or used for investing activities, such as
buying stocks in other companies or purchasing additional property or equipment. XYZ Corp. had
no cash receipts from investing in 1999 but spent Rs.150 million to purchase equipment.
Balance sheet basics.doc page 10 of 12
Cash flow from financing
Cash flow from financing activities includes cash received from borrowing money or issuing stock
and cash spent to repay loans. XYZ Corp. received Rs.100 million in cash from issuing bonds in
1999.
Sizing up operating performance
Of the three main sources of cash flow, analysts look to that from operations as the most
important measure of performance. If operations alone don't generate positive cash flow, that
may be cause for concern. In addition, a decrease in cash flow due to a sharp increase in
inventory or receivables can signal that a company is having trouble selling products or collecting
money from customers. However, analysts look at the relative amount of these changes if
accounts receivable have gone up by the same percentage as sales revenues, the increase may
not be unusual.
===========================================================================
Risk Reward Ragas
Whenever we talk about investments, there is always some risk associated with all of them. Risk
is the most dreaded word in all the financial markets across the globe. Any person, who is
operating in the financial markets, in whatever capacity, has to face risk. So the question in
most minds is, what exactly this RISK is? What does it mean?
In general terms, risk means any deviation from expectations. In Financial parlance, risk means
any deviation from the expected returns. More specifically, the probability that the returns from
any asset will differ from the expected yields is the risk inherent in that asset. We all face risk in
our lives in one way or the other. So lets have an understanding of the risk
Risk inherent in equity investments
Equity investment is the most risky investment in all the financial markets. So one needs to have
an understanding of risks associated with equity investments. Broadly, there are two types of
risks associated with equity investments, viz., systematic risk and unsystematic risk. Lets have
an understanding of these two types of risks.
Systematic risk: or the market risk, as it is called, this is the variation in the return on any scrip due to
market movements. For example, suppose the Government announces a corporate tax cut or rise across
the board, it is going to effect all the stocks in the market in the same way. This is the systematic risk of
scrip, which exists because of market movements.
There is nothing much one can do about systematic risk of a security because it arises due to
some extraneous variables. But there still exists some techniques, which help to hedge against
the systematic risk of a security.
Balance sheet basics.doc page 11 of 12
A good measure of an asset’s systematic risk is its Beta. Beta is calculated by regressing the
returns of a particular asset on market returns. It can be interpreted as, say the beta of a stock
is 1.25, then whenever the market moves by 1%, the stock will move by 1.25%.
Unsystematic risk: is the variation in the return of a scrip due to that scrip specific factors or
movements. For example, say the Government announces tax sops to companies in a particular
sector, it is going to effect the prices of the stocks of companies which are operating in that
sector and not all the stocks.
Measuring risk
We can measure risk in two ways – Ex post and Ex ante risk measurement. Ex post
measurement is done after the happening of an event and Ex ante measurement is done before
the happening of an event.
Ex post Risk
When risk is measured ex post, it is measured as Variance from the mean value. That is, it is the
statistical measure of Variance associated with the returns on a particular asset. For example, if
one wants to measure risk associated with a particular stock, he will take the returns generated
on the stock over a period of time and then he will find out the variance in the return of that
particular stock. That variance will be the risk of that stock.
Ex ante Risk
When it is measured ex ante, it is measured as the probability that the returns from an asset will
deviate from the mean or the expected returns. For this, if the variable has a normal
distribution, the Theory of Normal distribution can be easily applied to find out the probability of
this deviation. Otherwise subjective estimates of the probability have to be made.
For example, say the changes in a stock price have normal distribution. One can take the mean
return based on the past return of the stock. Then, using the Standard Normal probability
distribution, he can find out the probability of the return on that stock falling below that mean or
expected return.
If the stock price is not normally distributed, then he will have to make subjective estimates of
probabilities of getting a particular return. Using that, he can find out what is the expected
return on that stock. Then the risk on that stock is the statistical measure of variance in return
of that stock from the expected return.
Hedging risks associated with equity investments
Risk Hedging encapsulates all the activities required to ensure that the exposure, one is having,
on account of the risk, doesn’t transform into loss. That is, the exposure is only a notional loss,
which might transform into actual loss on happening of a particular event, but if necessary steps
are taken to control, manage and diversify away the risk, this exposure can be controlled. All the
activities undertaken to do so collectively comes under the purview of risk hedging.
In the following section, we present some of the commonly used techniques for managing risks:
Use of derivatives: Derivatives are most commonly used to hedge against the market risk. The use of the
type of derivative instrument depends upon the expectations. An example will make the point clear. Say,
Balance sheet basics.doc page 12 of 12
you have 100 Reliance shares, the market price of which is presently RS. 300. Now you expect that the
price of Reliance might go down in the future due to some reason. To hedge yourself against this risk, you
can buy a Put option on Reliance’s stock and lock in a price. If the price actually falls, you can sell those
shares at the price you contracted through Put option. If you expect prices to rise and you want to buy
shares in the future, you can buy a Call option on Reliance’s stock.
To learn more about derivative basics, click here (a link to our derivative channel).
As of now, the use of derivatives on individual securities is not allowed in India. Sometime back,
the use of any derivative instrument was not allowed in India. But now the SEBI has allowed the
use of Index Futures on BSE and NSE. Soon, these Futures instruments will start trading on
other exchanges also. And in due of course of time, the entire range of derivative instruments
will be allowed in India.
Making a portfolio: To guard yourself against market risk, you can also make a portfolio of stocks whose
returns are negatively correlated with each other. If you make a portfolio of two stocks whose correlation
co-efficient is –1 (minus 1), then your market risk is minimized.

More Related Content

What's hot

New microsoft office word document
New microsoft office word documentNew microsoft office word document
New microsoft office word documentBadam Venkatareddy
 
Chapter 9-ratio-analysis121
Chapter 9-ratio-analysis121Chapter 9-ratio-analysis121
Chapter 9-ratio-analysis121Anjaneyulu Bandi
 
Financial management
Financial managementFinancial management
Financial managementDharmik
 
Ratio analysis
Ratio analysisRatio analysis
Ratio analysismogambo
 
Ratio analysis mf h
Ratio analysis mf hRatio analysis mf h
Ratio analysis mf hmhoque71
 
Ratio Analysis By- Ravi Thakur From CMD
Ratio Analysis By- Ravi Thakur From CMD Ratio Analysis By- Ravi Thakur From CMD
Ratio Analysis By- Ravi Thakur From CMD Ravi Thakur
 
Analysis and interpretation of ratios
Analysis and interpretation of ratiosAnalysis and interpretation of ratios
Analysis and interpretation of ratiosBabasab Patil
 
Analysis of financial statements
Analysis of financial statementsAnalysis of financial statements
Analysis of financial statementsAfnan Amjad
 
Abdm4223 lecture week 9 290612
Abdm4223 lecture week 9 290612Abdm4223 lecture week 9 290612
Abdm4223 lecture week 9 290612Stephen Ong
 
Financial ratios for bilingual classes
Financial ratios for bilingual classesFinancial ratios for bilingual classes
Financial ratios for bilingual classesLuz Valera
 
Horizontal and Vertical Analysis | Accounting
Horizontal and Vertical Analysis | AccountingHorizontal and Vertical Analysis | Accounting
Horizontal and Vertical Analysis | AccountingTransweb Global Inc
 
Ratio analysis - Financial ratios for B Com students
Ratio analysis -  Financial ratios for B Com students Ratio analysis -  Financial ratios for B Com students
Ratio analysis - Financial ratios for B Com students Dr. Sanjay Sawant Dessai
 

What's hot (19)

Ratio analysis
Ratio analysisRatio analysis
Ratio analysis
 
New microsoft office word document
New microsoft office word documentNew microsoft office word document
New microsoft office word document
 
Ratio Analysis
Ratio AnalysisRatio Analysis
Ratio Analysis
 
Chapter 9-ratio-analysis121
Chapter 9-ratio-analysis121Chapter 9-ratio-analysis121
Chapter 9-ratio-analysis121
 
Accounting Ratios
Accounting RatiosAccounting Ratios
Accounting Ratios
 
Financial ratio analysis
Financial ratio analysisFinancial ratio analysis
Financial ratio analysis
 
Financial management
Financial managementFinancial management
Financial management
 
Ratio analysis
Ratio analysisRatio analysis
Ratio analysis
 
Ratio analysis
Ratio analysisRatio analysis
Ratio analysis
 
Ratio analysis mf h
Ratio analysis mf hRatio analysis mf h
Ratio analysis mf h
 
Ratio Analysis By- Ravi Thakur From CMD
Ratio Analysis By- Ravi Thakur From CMD Ratio Analysis By- Ravi Thakur From CMD
Ratio Analysis By- Ravi Thakur From CMD
 
Ratio analysis
Ratio analysisRatio analysis
Ratio analysis
 
Analysis and interpretation of ratios
Analysis and interpretation of ratiosAnalysis and interpretation of ratios
Analysis and interpretation of ratios
 
Analysis of financial statements
Analysis of financial statementsAnalysis of financial statements
Analysis of financial statements
 
Abdm4223 lecture week 9 290612
Abdm4223 lecture week 9 290612Abdm4223 lecture week 9 290612
Abdm4223 lecture week 9 290612
 
Financial ratios for bilingual classes
Financial ratios for bilingual classesFinancial ratios for bilingual classes
Financial ratios for bilingual classes
 
Ratio analysis....
Ratio analysis....Ratio analysis....
Ratio analysis....
 
Horizontal and Vertical Analysis | Accounting
Horizontal and Vertical Analysis | AccountingHorizontal and Vertical Analysis | Accounting
Horizontal and Vertical Analysis | Accounting
 
Ratio analysis - Financial ratios for B Com students
Ratio analysis -  Financial ratios for B Com students Ratio analysis -  Financial ratios for B Com students
Ratio analysis - Financial ratios for B Com students
 

Viewers also liked

Income Statement Reporting Challenges with BI Tools: Helping IT and Finance t...
Income Statement Reporting Challenges with BI Tools: Helping IT and Finance t...Income Statement Reporting Challenges with BI Tools: Helping IT and Finance t...
Income Statement Reporting Challenges with BI Tools: Helping IT and Finance t...Senturus
 
English 113 reference
English 113 reference English 113 reference
English 113 reference enroute2phd
 
Presenting Financial Statements
Presenting Financial StatementsPresenting Financial Statements
Presenting Financial Statementsmgonnerman
 
Financial statement analysis
Financial statement analysisFinancial statement analysis
Financial statement analysisAnuj Bhatia
 
Analytics Trends 2016: The next evolution
Analytics Trends 2016: The next evolutionAnalytics Trends 2016: The next evolution
Analytics Trends 2016: The next evolutionDeloitte United States
 
The State of Sales & Marketing at the 50 Fastest-Growing B2B Companies
The State of Sales & Marketing at the 50 Fastest-Growing B2B CompaniesThe State of Sales & Marketing at the 50 Fastest-Growing B2B Companies
The State of Sales & Marketing at the 50 Fastest-Growing B2B CompaniesMattermark
 

Viewers also liked (7)

Income Statement Reporting Challenges with BI Tools: Helping IT and Finance t...
Income Statement Reporting Challenges with BI Tools: Helping IT and Finance t...Income Statement Reporting Challenges with BI Tools: Helping IT and Finance t...
Income Statement Reporting Challenges with BI Tools: Helping IT and Finance t...
 
English 113 reference
English 113 reference English 113 reference
English 113 reference
 
The One Page Proposal
The One Page ProposalThe One Page Proposal
The One Page Proposal
 
Presenting Financial Statements
Presenting Financial StatementsPresenting Financial Statements
Presenting Financial Statements
 
Financial statement analysis
Financial statement analysisFinancial statement analysis
Financial statement analysis
 
Analytics Trends 2016: The next evolution
Analytics Trends 2016: The next evolutionAnalytics Trends 2016: The next evolution
Analytics Trends 2016: The next evolution
 
The State of Sales & Marketing at the 50 Fastest-Growing B2B Companies
The State of Sales & Marketing at the 50 Fastest-Growing B2B CompaniesThe State of Sales & Marketing at the 50 Fastest-Growing B2B Companies
The State of Sales & Marketing at the 50 Fastest-Growing B2B Companies
 

Similar to Balance sheet basics (2012)

Chapter 6_Interpretation of Financial Statement
Chapter 6_Interpretation of Financial StatementChapter 6_Interpretation of Financial Statement
Chapter 6_Interpretation of Financial StatementPresana1
 
Solvency And Asset Recommendations 2011
Solvency And Asset Recommendations 2011Solvency And Asset Recommendations 2011
Solvency And Asset Recommendations 2011mrittmayer
 
Financial Analysis Tips for Beginners
Financial Analysis Tips for BeginnersFinancial Analysis Tips for Beginners
Financial Analysis Tips for BeginnersIndustriusCFO
 
Financial ratios and their use in understanding Financial Statements
Financial ratios and their use in understanding Financial StatementsFinancial ratios and their use in understanding Financial Statements
Financial ratios and their use in understanding Financial StatementsPranav Dedhia
 
CASE 5Business Performance Evaluation Approaches for Thoughtf.docx
CASE 5Business Performance Evaluation Approaches for Thoughtf.docxCASE 5Business Performance Evaluation Approaches for Thoughtf.docx
CASE 5Business Performance Evaluation Approaches for Thoughtf.docxdewhirstichabod
 
CASE 5Business Performance Evaluation Approaches for Thoughtf.docx
CASE 5Business Performance Evaluation Approaches for Thoughtf.docxCASE 5Business Performance Evaluation Approaches for Thoughtf.docx
CASE 5Business Performance Evaluation Approaches for Thoughtf.docxannandleola
 
Moneycation march 2015 newsletter; volume #3, issue #7
Moneycation march 2015 newsletter; volume #3, issue #7Moneycation march 2015 newsletter; volume #3, issue #7
Moneycation march 2015 newsletter; volume #3, issue #7A.W. Berry
 
Steps to basic_company_financial_analysis
Steps to basic_company_financial_analysisSteps to basic_company_financial_analysis
Steps to basic_company_financial_analysisIbrahim Hussain
 
What's the Impact of Ratios in Financial Analysis?
What's the Impact of Ratios in Financial Analysis?What's the Impact of Ratios in Financial Analysis?
What's the Impact of Ratios in Financial Analysis?Flevy.com Best Practices
 
Financial statement analysis notes
Financial statement analysis notes Financial statement analysis notes
Financial statement analysis notes Vardha Mago
 
Module 2 - BackgroundPrinciples of AccountingConsider that acc.docx
Module 2 - BackgroundPrinciples of AccountingConsider that acc.docxModule 2 - BackgroundPrinciples of AccountingConsider that acc.docx
Module 2 - BackgroundPrinciples of AccountingConsider that acc.docxroushhsiu
 
FAQs on Financial Statement Analysis
FAQs on Financial Statement AnalysisFAQs on Financial Statement Analysis
FAQs on Financial Statement Analysistutor_panorama
 
Types and methods of financial analysis
Types and methods of financial analysisTypes and methods of financial analysis
Types and methods of financial analysissaur137
 
“A STUDY ON FINANCIAL ANALYSIS”
“A STUDY ON FINANCIAL ANALYSIS”“A STUDY ON FINANCIAL ANALYSIS”
“A STUDY ON FINANCIAL ANALYSIS”anirudhbatiya
 
Branches of Accounting What You Need to Know When Writing an Assignment.pdf
Branches of Accounting What You Need to Know When Writing an Assignment.pdfBranches of Accounting What You Need to Know When Writing an Assignment.pdf
Branches of Accounting What You Need to Know When Writing an Assignment.pdfMatt Brown
 
Ratios and Formulas in Customer Financial AnalysisFinancial stat.docx
Ratios and Formulas in Customer Financial AnalysisFinancial stat.docxRatios and Formulas in Customer Financial AnalysisFinancial stat.docx
Ratios and Formulas in Customer Financial AnalysisFinancial stat.docxcatheryncouper
 
Ratioanalysis
RatioanalysisRatioanalysis
RatioanalysisBIPLLAWB
 

Similar to Balance sheet basics (2012) (20)

Chapter 6_Interpretation of Financial Statement
Chapter 6_Interpretation of Financial StatementChapter 6_Interpretation of Financial Statement
Chapter 6_Interpretation of Financial Statement
 
Financial Analysis
Financial AnalysisFinancial Analysis
Financial Analysis
 
Solvency And Asset Recommendations 2011
Solvency And Asset Recommendations 2011Solvency And Asset Recommendations 2011
Solvency And Asset Recommendations 2011
 
Financial Analysis Tips for Beginners
Financial Analysis Tips for BeginnersFinancial Analysis Tips for Beginners
Financial Analysis Tips for Beginners
 
Financial ratios and their use in understanding Financial Statements
Financial ratios and their use in understanding Financial StatementsFinancial ratios and their use in understanding Financial Statements
Financial ratios and their use in understanding Financial Statements
 
CASE 5Business Performance Evaluation Approaches for Thoughtf.docx
CASE 5Business Performance Evaluation Approaches for Thoughtf.docxCASE 5Business Performance Evaluation Approaches for Thoughtf.docx
CASE 5Business Performance Evaluation Approaches for Thoughtf.docx
 
CASE 5Business Performance Evaluation Approaches for Thoughtf.docx
CASE 5Business Performance Evaluation Approaches for Thoughtf.docxCASE 5Business Performance Evaluation Approaches for Thoughtf.docx
CASE 5Business Performance Evaluation Approaches for Thoughtf.docx
 
Balance sheet
Balance sheetBalance sheet
Balance sheet
 
Moneycation march 2015 newsletter; volume #3, issue #7
Moneycation march 2015 newsletter; volume #3, issue #7Moneycation march 2015 newsletter; volume #3, issue #7
Moneycation march 2015 newsletter; volume #3, issue #7
 
Steps to basic_company_financial_analysis
Steps to basic_company_financial_analysisSteps to basic_company_financial_analysis
Steps to basic_company_financial_analysis
 
What's the Impact of Ratios in Financial Analysis?
What's the Impact of Ratios in Financial Analysis?What's the Impact of Ratios in Financial Analysis?
What's the Impact of Ratios in Financial Analysis?
 
Financial statement analysis notes
Financial statement analysis notes Financial statement analysis notes
Financial statement analysis notes
 
Module 2 - BackgroundPrinciples of AccountingConsider that acc.docx
Module 2 - BackgroundPrinciples of AccountingConsider that acc.docxModule 2 - BackgroundPrinciples of AccountingConsider that acc.docx
Module 2 - BackgroundPrinciples of AccountingConsider that acc.docx
 
FAQs on Financial Statement Analysis
FAQs on Financial Statement AnalysisFAQs on Financial Statement Analysis
FAQs on Financial Statement Analysis
 
Types and methods of financial analysis
Types and methods of financial analysisTypes and methods of financial analysis
Types and methods of financial analysis
 
“A STUDY ON FINANCIAL ANALYSIS”
“A STUDY ON FINANCIAL ANALYSIS”“A STUDY ON FINANCIAL ANALYSIS”
“A STUDY ON FINANCIAL ANALYSIS”
 
Branches of Accounting What You Need to Know When Writing an Assignment.pdf
Branches of Accounting What You Need to Know When Writing an Assignment.pdfBranches of Accounting What You Need to Know When Writing an Assignment.pdf
Branches of Accounting What You Need to Know When Writing an Assignment.pdf
 
Financial terms
Financial termsFinancial terms
Financial terms
 
Ratios and Formulas in Customer Financial AnalysisFinancial stat.docx
Ratios and Formulas in Customer Financial AnalysisFinancial stat.docxRatios and Formulas in Customer Financial AnalysisFinancial stat.docx
Ratios and Formulas in Customer Financial AnalysisFinancial stat.docx
 
Ratioanalysis
RatioanalysisRatioanalysis
Ratioanalysis
 

Recently uploaded

Indore Real Estate Market Trends Report.pdf
Indore Real Estate Market Trends Report.pdfIndore Real Estate Market Trends Report.pdf
Indore Real Estate Market Trends Report.pdfSaviRakhecha1
 
Top Rated Pune Call Girls Viman Nagar ⟟ 6297143586 ⟟ Call Me For Genuine Sex...
Top Rated  Pune Call Girls Viman Nagar ⟟ 6297143586 ⟟ Call Me For Genuine Sex...Top Rated  Pune Call Girls Viman Nagar ⟟ 6297143586 ⟟ Call Me For Genuine Sex...
Top Rated Pune Call Girls Viman Nagar ⟟ 6297143586 ⟟ Call Me For Genuine Sex...Call Girls in Nagpur High Profile
 
20240429 Calibre April 2024 Investor Presentation.pdf
20240429 Calibre April 2024 Investor Presentation.pdf20240429 Calibre April 2024 Investor Presentation.pdf
20240429 Calibre April 2024 Investor Presentation.pdfAdnet Communications
 
The Economic History of the U.S. Lecture 25.pdf
The Economic History of the U.S. Lecture 25.pdfThe Economic History of the U.S. Lecture 25.pdf
The Economic History of the U.S. Lecture 25.pdfGale Pooley
 
02_Fabio Colombo_Accenture_MeetupDora&Cybersecurity.pptx
02_Fabio Colombo_Accenture_MeetupDora&Cybersecurity.pptx02_Fabio Colombo_Accenture_MeetupDora&Cybersecurity.pptx
02_Fabio Colombo_Accenture_MeetupDora&Cybersecurity.pptxFinTech Belgium
 
Stock Market Brief Deck (Under Pressure).pdf
Stock Market Brief Deck (Under Pressure).pdfStock Market Brief Deck (Under Pressure).pdf
Stock Market Brief Deck (Under Pressure).pdfMichael Silva
 
Booking open Available Pune Call Girls Wadgaon Sheri 6297143586 Call Hot Ind...
Booking open Available Pune Call Girls Wadgaon Sheri  6297143586 Call Hot Ind...Booking open Available Pune Call Girls Wadgaon Sheri  6297143586 Call Hot Ind...
Booking open Available Pune Call Girls Wadgaon Sheri 6297143586 Call Hot Ind...Call Girls in Nagpur High Profile
 
Call Girls Service Nagpur Maya Call 7001035870 Meet With Nagpur Escorts
Call Girls Service Nagpur Maya Call 7001035870 Meet With Nagpur EscortsCall Girls Service Nagpur Maya Call 7001035870 Meet With Nagpur Escorts
Call Girls Service Nagpur Maya Call 7001035870 Meet With Nagpur Escortsranjana rawat
 
The Economic History of the U.S. Lecture 20.pdf
The Economic History of the U.S. Lecture 20.pdfThe Economic History of the U.S. Lecture 20.pdf
The Economic History of the U.S. Lecture 20.pdfGale Pooley
 
(DIYA) Bhumkar Chowk Call Girls Just Call 7001035870 [ Cash on Delivery ] Pun...
(DIYA) Bhumkar Chowk Call Girls Just Call 7001035870 [ Cash on Delivery ] Pun...(DIYA) Bhumkar Chowk Call Girls Just Call 7001035870 [ Cash on Delivery ] Pun...
(DIYA) Bhumkar Chowk Call Girls Just Call 7001035870 [ Cash on Delivery ] Pun...ranjana rawat
 
Independent Call Girl Number in Kurla Mumbai📲 Pooja Nehwal 9892124323 💞 Full ...
Independent Call Girl Number in Kurla Mumbai📲 Pooja Nehwal 9892124323 💞 Full ...Independent Call Girl Number in Kurla Mumbai📲 Pooja Nehwal 9892124323 💞 Full ...
Independent Call Girl Number in Kurla Mumbai📲 Pooja Nehwal 9892124323 💞 Full ...Pooja Nehwal
 
Basic concepts related to Financial modelling
Basic concepts related to Financial modellingBasic concepts related to Financial modelling
Basic concepts related to Financial modellingbaijup5
 
VVIP Pune Call Girls Katraj (7001035870) Pune Escorts Nearby with Complete Sa...
VVIP Pune Call Girls Katraj (7001035870) Pune Escorts Nearby with Complete Sa...VVIP Pune Call Girls Katraj (7001035870) Pune Escorts Nearby with Complete Sa...
VVIP Pune Call Girls Katraj (7001035870) Pune Escorts Nearby with Complete Sa...Call Girls in Nagpur High Profile
 
Call Girls Koregaon Park Call Me 7737669865 Budget Friendly No Advance Booking
Call Girls Koregaon Park Call Me 7737669865 Budget Friendly No Advance BookingCall Girls Koregaon Park Call Me 7737669865 Budget Friendly No Advance Booking
Call Girls Koregaon Park Call Me 7737669865 Budget Friendly No Advance Bookingroncy bisnoi
 
00_Main ppt_MeetupDORA&CyberSecurity.pptx
00_Main ppt_MeetupDORA&CyberSecurity.pptx00_Main ppt_MeetupDORA&CyberSecurity.pptx
00_Main ppt_MeetupDORA&CyberSecurity.pptxFinTech Belgium
 
Solution Manual for Financial Accounting, 11th Edition by Robert Libby, Patri...
Solution Manual for Financial Accounting, 11th Edition by Robert Libby, Patri...Solution Manual for Financial Accounting, 11th Edition by Robert Libby, Patri...
Solution Manual for Financial Accounting, 11th Edition by Robert Libby, Patri...ssifa0344
 
05_Annelore Lenoir_Docbyte_MeetupDora&Cybersecurity.pptx
05_Annelore Lenoir_Docbyte_MeetupDora&Cybersecurity.pptx05_Annelore Lenoir_Docbyte_MeetupDora&Cybersecurity.pptx
05_Annelore Lenoir_Docbyte_MeetupDora&Cybersecurity.pptxFinTech Belgium
 

Recently uploaded (20)

(INDIRA) Call Girl Mumbai Call Now 8250077686 Mumbai Escorts 24x7
(INDIRA) Call Girl Mumbai Call Now 8250077686 Mumbai Escorts 24x7(INDIRA) Call Girl Mumbai Call Now 8250077686 Mumbai Escorts 24x7
(INDIRA) Call Girl Mumbai Call Now 8250077686 Mumbai Escorts 24x7
 
Indore Real Estate Market Trends Report.pdf
Indore Real Estate Market Trends Report.pdfIndore Real Estate Market Trends Report.pdf
Indore Real Estate Market Trends Report.pdf
 
Top Rated Pune Call Girls Viman Nagar ⟟ 6297143586 ⟟ Call Me For Genuine Sex...
Top Rated  Pune Call Girls Viman Nagar ⟟ 6297143586 ⟟ Call Me For Genuine Sex...Top Rated  Pune Call Girls Viman Nagar ⟟ 6297143586 ⟟ Call Me For Genuine Sex...
Top Rated Pune Call Girls Viman Nagar ⟟ 6297143586 ⟟ Call Me For Genuine Sex...
 
20240429 Calibre April 2024 Investor Presentation.pdf
20240429 Calibre April 2024 Investor Presentation.pdf20240429 Calibre April 2024 Investor Presentation.pdf
20240429 Calibre April 2024 Investor Presentation.pdf
 
The Economic History of the U.S. Lecture 25.pdf
The Economic History of the U.S. Lecture 25.pdfThe Economic History of the U.S. Lecture 25.pdf
The Economic History of the U.S. Lecture 25.pdf
 
02_Fabio Colombo_Accenture_MeetupDora&Cybersecurity.pptx
02_Fabio Colombo_Accenture_MeetupDora&Cybersecurity.pptx02_Fabio Colombo_Accenture_MeetupDora&Cybersecurity.pptx
02_Fabio Colombo_Accenture_MeetupDora&Cybersecurity.pptx
 
Stock Market Brief Deck (Under Pressure).pdf
Stock Market Brief Deck (Under Pressure).pdfStock Market Brief Deck (Under Pressure).pdf
Stock Market Brief Deck (Under Pressure).pdf
 
Booking open Available Pune Call Girls Wadgaon Sheri 6297143586 Call Hot Ind...
Booking open Available Pune Call Girls Wadgaon Sheri  6297143586 Call Hot Ind...Booking open Available Pune Call Girls Wadgaon Sheri  6297143586 Call Hot Ind...
Booking open Available Pune Call Girls Wadgaon Sheri 6297143586 Call Hot Ind...
 
Call Girls Service Nagpur Maya Call 7001035870 Meet With Nagpur Escorts
Call Girls Service Nagpur Maya Call 7001035870 Meet With Nagpur EscortsCall Girls Service Nagpur Maya Call 7001035870 Meet With Nagpur Escorts
Call Girls Service Nagpur Maya Call 7001035870 Meet With Nagpur Escorts
 
The Economic History of the U.S. Lecture 20.pdf
The Economic History of the U.S. Lecture 20.pdfThe Economic History of the U.S. Lecture 20.pdf
The Economic History of the U.S. Lecture 20.pdf
 
(DIYA) Bhumkar Chowk Call Girls Just Call 7001035870 [ Cash on Delivery ] Pun...
(DIYA) Bhumkar Chowk Call Girls Just Call 7001035870 [ Cash on Delivery ] Pun...(DIYA) Bhumkar Chowk Call Girls Just Call 7001035870 [ Cash on Delivery ] Pun...
(DIYA) Bhumkar Chowk Call Girls Just Call 7001035870 [ Cash on Delivery ] Pun...
 
Independent Call Girl Number in Kurla Mumbai📲 Pooja Nehwal 9892124323 💞 Full ...
Independent Call Girl Number in Kurla Mumbai📲 Pooja Nehwal 9892124323 💞 Full ...Independent Call Girl Number in Kurla Mumbai📲 Pooja Nehwal 9892124323 💞 Full ...
Independent Call Girl Number in Kurla Mumbai📲 Pooja Nehwal 9892124323 💞 Full ...
 
Basic concepts related to Financial modelling
Basic concepts related to Financial modellingBasic concepts related to Financial modelling
Basic concepts related to Financial modelling
 
VVIP Pune Call Girls Katraj (7001035870) Pune Escorts Nearby with Complete Sa...
VVIP Pune Call Girls Katraj (7001035870) Pune Escorts Nearby with Complete Sa...VVIP Pune Call Girls Katraj (7001035870) Pune Escorts Nearby with Complete Sa...
VVIP Pune Call Girls Katraj (7001035870) Pune Escorts Nearby with Complete Sa...
 
Call Girls Koregaon Park Call Me 7737669865 Budget Friendly No Advance Booking
Call Girls Koregaon Park Call Me 7737669865 Budget Friendly No Advance BookingCall Girls Koregaon Park Call Me 7737669865 Budget Friendly No Advance Booking
Call Girls Koregaon Park Call Me 7737669865 Budget Friendly No Advance Booking
 
00_Main ppt_MeetupDORA&CyberSecurity.pptx
00_Main ppt_MeetupDORA&CyberSecurity.pptx00_Main ppt_MeetupDORA&CyberSecurity.pptx
00_Main ppt_MeetupDORA&CyberSecurity.pptx
 
Veritas Interim Report 1 January–31 March 2024
Veritas Interim Report 1 January–31 March 2024Veritas Interim Report 1 January–31 March 2024
Veritas Interim Report 1 January–31 March 2024
 
Solution Manual for Financial Accounting, 11th Edition by Robert Libby, Patri...
Solution Manual for Financial Accounting, 11th Edition by Robert Libby, Patri...Solution Manual for Financial Accounting, 11th Edition by Robert Libby, Patri...
Solution Manual for Financial Accounting, 11th Edition by Robert Libby, Patri...
 
05_Annelore Lenoir_Docbyte_MeetupDora&Cybersecurity.pptx
05_Annelore Lenoir_Docbyte_MeetupDora&Cybersecurity.pptx05_Annelore Lenoir_Docbyte_MeetupDora&Cybersecurity.pptx
05_Annelore Lenoir_Docbyte_MeetupDora&Cybersecurity.pptx
 
VIP Independent Call Girls in Andheri 🌹 9920725232 ( Call Me ) Mumbai Escorts...
VIP Independent Call Girls in Andheri 🌹 9920725232 ( Call Me ) Mumbai Escorts...VIP Independent Call Girls in Andheri 🌹 9920725232 ( Call Me ) Mumbai Escorts...
VIP Independent Call Girls in Andheri 🌹 9920725232 ( Call Me ) Mumbai Escorts...
 

Balance sheet basics (2012)

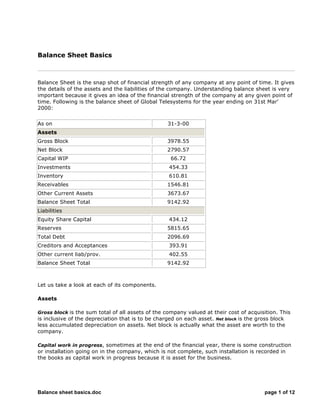
  • 1. Balance sheet basics.doc page 1 of 12 Balance Sheet Basics Balance Sheet is the snap shot of financial strength of any company at any point of time. It gives the details of the assets and the liabilities of the company. Understanding balance sheet is very important because it gives an idea of the financial strength of the company at any given point of time. Following is the balance sheet of Global Telesystems for the year ending on 31st Mar' 2000: As on 31-3-00 Assets Gross Block 3978.55 Net Block 2790.57 Capital WIP 66.72 Investments 454.33 Inventory 610.81 Receivables 1546.81 Other Current Assets 3673.67 Balance Sheet Total 9142.92 Liabilities Equity Share Capital 434.12 Reserves 5815.65 Total Debt 2096.69 Creditors and Acceptances 393.91 Other current liab/prov. 402.55 Balance Sheet Total 9142.92 Let us take a look at each of its components. Assets Gross block is the sum total of all assets of the company valued at their cost of acquisition. This is inclusive of the depreciation that is to be charged on each asset. Net block is the gross block less accumulated depreciation on assets. Net block is actually what the asset are worth to the company. Capital work in progress, sometimes at the end of the financial year, there is some construction or installation going on in the company, which is not complete, such installation is recorded in the books as capital work in progress because it is asset for the business.
  • 2. Balance sheet basics.doc page 2 of 12 If the company has made some investments out of its free cash, it is recorded under the head investments. Inventory is the stock of goods that a company has at any point of time. Receivables include the debtors of the company, i.e., it includes all those accounts which are to give money back to the company. Other current assets include all the assets, which can be converted into cash within a very short period of time like cash in bank etc. Equity Share capital is the owner's equity. It is the most permanent source of finance for the company. Reserves include the free reserves of the company which are built out of the genuine profits of the company. Together they are known as net worth of the company. Total debt includes the long term and the short debt of the company. Long term is for a longer duration, usually for a period more than 3 years like debentures. Short term debt is for a lesser duration, usually for less than a year like bank finance for working capital. Creditors are those entities to which the company owes money. Other liabilities and provisions include all the liabilities that do not fall under any of the above heads and various provisions made. Role of Balance Sheet in Investment Decision making After analyzing the income statement, move on to the balance sheet and continue your analysis. While the income statement recaps three months' worth of operations, the balance sheet is a snapshot of what the company's finances look like only on the last day of the quarter. (It's much like if you took every statement you received from every financial institution you have dealings with — banks, brokerages, credit card issuers, mortgage banks, etc. — and listed the closing balances of each account.) When reviewing the balance sheet, keep an eye on inventories and accounts receivable. If inventories are growing too quickly, perhaps some of it is outdated or obsolete. If the accounts receivable are growing faster than sales, then it might indicate a problem, such as lax credit policies or poor internal controls. Finally, take a look at the liability side of the balance sheet. Look at both long-term and short-term debt. Have they increased? If so, why? How about accounts payable? After you've done the numerical analysis, read the comments made by management. They should have addressed anything that looked unusual, such as a large increase in inventory. Management will also usually make some statements about the future prospects of business. These comments are only the opinion of management, so use them as such. When all is said and done, you'll probably have some new thoughts and ideas on your investments. By all means, write them down. Use your new benchmark as a basis for analyzing your portfolio next time. Spending a few minutes like this each quarter reviewing your holdings can help you stay on track with your investment goals. ===========================================================================
  • 3. Balance sheet basics.doc page 3 of 12 Company Valuation Whenever people talk about equity investments, one must have come across the word "Valuation". In financial parlance, Valuation means how much a company is worth of. Talking about equity investments, one should have an understanding of valuation. Valuation means the intrinsic worth of the company. There are various methods through which one can measure the intrinsic worth of a company. This section is aimed at providing a basic understanding of these methods of valuation. They are mentioned below: Net Asset Value (NAV) NAV or Book value is one of the most commonly used methods of valuation. As the name suggests, it is the net value of all the assets of the company. If you divide it by the number of outstanding shares, you get the NAV per share. One way to calculate NAV is to divide the net worth of the company by the total number of oooutstanding shares. Say, a company’s share capital is Rs. 100 crores (10 crores shares of Rs. 10 each) and its reserves and surplus is another Rs. 100 crores. Net worth of the company would be Rs. 200 crores (equity and reserves) and NAV would be Rs. 20 per share (Rs. 200 crores divided by 10 crores outstanding shares). NAV can also be calculated by adding all the assets and subtracting all the outside liabilities from them. This will again boil down to net worth only. One can use any of the two methods to find out NAV. One can compare the NAV with the going market price while taking investment decisions. Discounted Cash Flows Method (DCF) DCF is the most widely used technique to value a company. It takes into consideration the cash flows arising to the company and also the time value of money. That’s why, it is so popular. What actually happens in this is, the cash flows are calculated for a particular period of time (the time period is fixed taking into consideration various factors). These cash flows are discounted to the present at the cost of capital of the company. These discounted cash flows are then divided by the total number of outstanding shares to get the intrinsic worth per share. =========================================================================== Value Analysis What is Fundamental Analysis? Fundamental analysis is the analysis, wherein the investment decisions are taken on the basis of the financial strength of the company. There are two approaches to fundamental analysis, viz.,
  • 4. Balance sheet basics.doc page 4 of 12 E-I-C analysis or the Top Down approach to Fundamental analysis and C-I-E analysis or the Bottom up approach. In the following section, we explain both these approaches. Economy-Industry-Company Analysis In the Top down approach, first of all the overall Economy is analyzed to judge the general direction, in which the economy is heading. The direction in which the economy is heading has a bearing on the performance of various industries. Thats why Economy analysis is important. The output of the Economy analysis is a list of industries, which should perform well, given the general trend of the economy and also an idea, whether to invest or not in the given economic conditions. Measuring a Company's Financial Health Gaining a true picture of a company's finances means not only scrutinizing the financial statements but also analyzing relationships among various assets and liabilities, thus highlighting trends in a company's performance and changes in its financial strength relative to its competitors. This section explains how to read a company's financial statements. Measures of value : Book value is based on historical costs, not current values, but can provide an important measure of the relative value of a company over time. Book value can be figured as assets minus liabilities, or assets minus liabilities and intangible items such as goodwill; either way, the figure that results is the company's net book value. This is contrasted with its market capitalization, or total share price value, which is calculated by multiplying the outstanding shares by their current market price. You can also compare a company's market value to its book value on a per-share basis. Divide book value by the number of shares outstanding to get book value per share and compare the result to the current stock price to help determine if the company's stock is fairly valued. Most stocks trade above book value because investors believe that the company will grow and the value of its shares will, too. When book value per share is higher than the current share price, a company's stock may be undervalued and a bargain to investors. In fact, the company itself may be a bargain, and hence a takeover target. Price/earnings ratio (P/E) is the more common yardstick of a company's value. It is the current stock price divided by the earnings per share for the past year. For example, a stock selling for $20 with earnings of $2 per share has a P/E of 10. While there's no set rule as to what's a good P/E, a low P/E is generally considered good because it may mean that the stock price has not risen to reflect its earning power. A high P/E, on the other hand, may reflect an overpriced stock or decreasing earnings. As with all of these ratios, however, it's important to compare a company's ratio to the ratios of other companies in the same industry. A measure of solvency Debt-to-equity ratio provides a measure of a company's debt level. It is calculated by dividing total liabilities by shareholders' equity. A ratio of 1-to-2 or lower indicates that a company has relatively little debt. Ratios vary, however, depending on a company's size and its industry, so compare a company's financial ratios with those of its industry peers before drawing conclusions.
  • 5. Balance sheet basics.doc page 5 of 12 Measures of liquidity Current ratio. Current assets divided by current liabilities yields the current ratio, a measure of a company's liquidity, or its ability to meet current debts. The higher the ratio, the greater the liquidity. As a rule of thumb, a healthy company's current ratio is 2-to-1 or greater. =========================================================================== Cracking Ratios Ratio Analysis Ratio Analysis is the most commonly used analysis to judge the financial strength of a company. A lot of entities like research houses, investment bankers, financial institutions and investors make use of this analysis to judge the financial strength of any company. This analysis makes use of certain ratios to achieve the above-mentioned purpose. There are certain benchmarks fixed for each ratio and the actual ones are compared with these benchmarks to judge as to how sound the company is. The ratios are divided into various categories, which are mentioned below: Profitability ratios Profitability ratios speak about the profitability of the company. The various profitability ratios used in the analysis are, operating margin (operating profit divided by net sales), gross margin (gross profit divided by net sales) net profit margin (net profit divided by net sales), return on equity (net profit divided by net worth of the company) and return on investment (operating profit divided by total assets). As obvious from the name, the higher these ratios the better for the company. Solvency ratios These ratios are used to judge the long-term solvency of a firm. The most commonly used ratios are – Debt Equity ratio (total debt divided by total equity), Long term debt to equity ratio (long term debt divided by equity). While the accepted norm for debt equity ratio differs from industry to industry, the usual accepted norm for D/E is 2:1. It should not be more than this. For certain industries, a higher D/E is accepted, e.g., in banking industry, a debt equity ratio of 12:1 is acceptable. Liquidity ratios These ratios are used to judge the short-term solvency of a firm. These ratios give an indication as to how liquid a firm is. The most commonly used ratios are – Current ratio (all current assets divided by current liabilities) and quick ratio (current assets except inventory divided by current liabilities). The accepted norm for current ratio is 1.5:1. It should not be less than this.
  • 6. Balance sheet basics.doc page 6 of 12 Turnover ratios These ratios give an indication as to how efficiently a company is utilizing its assets. The most commonly ratios are sales turnover ratio, inventory turnover ratio (average inventory divided by net sales) and asset turnover ratio (net sales divided by total assets). The higher these ratios, the better for the company. Valuation Ratios Valuation ratios give an indication as to whether the stock is underpriced or overpriced at any point of time. The most commonly used ratios are Price to Earnings (P/E) ratio and price to book value (PBV) ratio. But care has to be taken while interpreting these ratios. While P/E ratio of a company should be compared with the industry P/E and the P/E of the competitors, it is the PBV that can distort. While a lower PBV usually means a lower valuation, there can be a case where a low PBV can be because of a very huge capital base of the company. In such a case, the stock might be overvalued but the PBV will indicate that the stock is undervalued. On the other extreme, a higher PBV usually means overvalued stock but that can also be because the company has a very small capital base. So care has to taken while interpreting these ratios. Coverage ratios These ratios give an indication about the repayment capabilities of a company. The most commonly used coverage ratios are Interest coverage ratio (Interest outstanding divided by earnings before interest and taxes) and debt service coverage ratio (earnings before interest and taxes plus all non cash charges divided by interest outstanding plus the term loan repayment installment). The acceptable norm for DSCR is 2:1. =========================================================================== Profit Loss Fundas Income statement is the snapshot of a company's operational performance for a particular period of time. It takes the company's revenues and expenses and gives profits as output. Take a look at the income statement of Global Telesystems: As on 31-3-00 Net Sales 6065.51 Operating Income 6265.63 Operating Profit 2116.57 Operating PBDT 1700.44 Operating Profit before Tax(PBT) 928.63 Non-Operating Income 1562.62
  • 7. Balance sheet basics.doc page 7 of 12 Extraordinary/Prior Period income -171.23 Tax 30.00 Profit after tax(PAT) 2290.02 Cash Profit 3061.82 Dividend-Equity 100.40 Let us take a look at the different components of a Income statement of Global Tele. First item is Net sales. Net sales is simply the product of quantity sold by the company and the selling price per unit. This figure is net of excise duty to be paid on the goods sold. Next comes operating expenses. These are the expenses incurred in producing the goods like labor, fuel, power etc. The difference between the net sales and the operating expenses is the operating profit, which is a commonly used statistic to judge the operational performance of the company. Next comes Operating profit before Tax, which is nothing but operating profit less interest and depreciation. Non operating income is the income that is not earned in the normal course of business operations. For example, interest earned on any investments made etc. Extra ordinary income is non recurring income that is earned only once and there are not any chances of earning that income again like profit on sale of any asset etc. Cash profit is PAT plus any all non cash charges, i.e., charges that don't entail actual cash outflow but they are only notional charges like depreciation, writing off preliminary expenses etc. Role of Earnings in Investment decisions Once you have got an understanding of Income statement, you are ready to be your own analyst. Each quarter, companies release their earnings, and, for companies using the traditional calendar-year approach, the quarter ended on New Year's Eve. Earnings season is a great time to re-evaluate your current holdings to make sure the companies you own are living up to your expectations. But before earnings are even announced, you might want to review why you made the investment in the first place. Whenever you buy a stock, write down in three or four sentences why you are doing so. State your reasons as objectively as you can. You might want to list such items as revenue growth, sustainability of earnings or growth over time, increased market share, increased gross margins, price targets for the stock or any other reasons you have for making the investment. For example, you might write, "I am buying XYZ Corp. because I think earnings will grow at a rate of 20% per year and that the price/earnings multiple will increase from its current level of 16 to between 22 and 25." By writing down your assumptions and your goals, you'll create a benchmark that can help you see over time how the company is performing. If you've never done this in the past, you might want to start now. Now take a look at the earnings. The earnings per share (EPS) number is a good place to start. The EPS is the total net profit of the company divided by the number of shares of stock outstanding. But don't just look at the actual EPS and compare it to the expected EPS. Pull out your calculator and crunch some numbers.
  • 8. Balance sheet basics.doc page 8 of 12 First of all, has the number of shares outstanding changed significantly? Has the company bought back a large chunk of its stock? If so, earnings may have improved on a per-share basis, but may have stayed flat or even declined in real terms. Next, you should be on the lookout for any one-time charges. You will want to remove the effect of the one-time charge, as it only creates noise and makes year-over-year comparisons more difficult. Any one-time charge or gain will be stated in per-share amounts as a footnote. Just subtract it from the EPS if it is a gain, or add it back if it is a loss. Once you have the EPS number exclusive of one-time items, you can compare it to the EPS from the same quarter last year to see how much growth has occurred. Compare the growth figure of your company to others in the same industry. Once you have gotten a good feel for the EPS, it's time to look at the actual numbers on the income statement. Here are some questions to ponder while you have your calculator in hand. What does the growth rate in sales look like? How was it last quarter? Are gross margin percentages better or worse than they have been historically? Are expenses increasing faster than sales? Using your written benchmarks for the stock, create a couple of additional questions to help you compare the company's results with your own stated assumptions. =========================================================================== Cash Flow Curries Think of cash as the lifeblood of every business. Without cash flow, no business can function and without an accurate picture of cash flow, no investor can have a complete picture of a company. A company's statement of cash flows reflects how readily the business can pay its bills, and it provides important information about a company's sources and uses of cash. But measuring cash flow solely from a balance sheet or an income statement is difficult and potentially misleading. That's because not all revenue is received when a company earns it, and not all expenses are paid when incurred. (For an explanation of financial statements, see "What's the Deal With Financial Statements?" plus "Understanding the Income Statement" and "How to Read a Balance Sheet," presented earlier in this series.) The difference between an income statement and a statement of cash flows is roughly analogous to the difference between a credit card statement and a checkbook ledger. A credit card statement includes charges that haven't been paid off yet, while an updated checkbook ledger indicates where cash has been spent and whether there's enough to pay off debts like a credit card bill. Similarly, a company's expenses and revenues are recorded on an income statement, regardless of whether cash has changed hands yet. A statement of cash flows, on the other hand, traces where cash came from and where it was used. The statement also separates cash generated by the normal operations of a company from that gleaned through other investing and financing activities, as seen in the sample statement of cash flows of the hypothetical XYZ Corp.
  • 9. Balance sheet basics.doc page 9 of 12 Statement of cash flows for XYZ Corp. for the year ending Dec. 31, 1999 (in millions) From operations Net income Rs.30 Plus depreciation 15 Plus decrease in receivables (less increase) (20) Less increase in inventories (10) Plus increase in accounts payable (less decrease) 0 Net increase (decrease) in cash from operations 15 From investing Less purchase of equipment (150) From financing Bonds issued 100 Net increase (decrease) in cash (35) Cash at beginning of year 127 Cash at end of year Rs. 92 Cash flow from operations: Cash flow from operations starts with net income (from the income statement) and adjusts out all of the non-cash items. Income and expenses on the income statement are recorded when a company earns revenue or incurs expenses, not necessarily when cash is received or paid. To figure out how much cash the company received or spent, net income is adjusted for any sales or expenditures made on credit and not yet paid with cash. Examples of these adjustments are shown above. XYZ had Rs.20 million in sales to customers who had not paid the company as of the end of the year, so this increase in receivables is subtracted. XYZ also reported Rs.15 million in depreciation expense (the portion of long-lasting assets, such as buildings, that is written off each year); depreciation is not a cash item, so it is added back. Finally, XYZ purchased Rs.10 million of additional inventory that was not sold as of year end. Because the inventory was not sold, it is not considered an expense. But because cash was used in the purchase, the Rs.10 million is subtracted from net income. Net cash received from XYZ's operations, after the above adjustments, was Rs.15 million. Cash flow from investing Cash flow from investing includes cash received from or used for investing activities, such as buying stocks in other companies or purchasing additional property or equipment. XYZ Corp. had no cash receipts from investing in 1999 but spent Rs.150 million to purchase equipment.
  • 10. Balance sheet basics.doc page 10 of 12 Cash flow from financing Cash flow from financing activities includes cash received from borrowing money or issuing stock and cash spent to repay loans. XYZ Corp. received Rs.100 million in cash from issuing bonds in 1999. Sizing up operating performance Of the three main sources of cash flow, analysts look to that from operations as the most important measure of performance. If operations alone don't generate positive cash flow, that may be cause for concern. In addition, a decrease in cash flow due to a sharp increase in inventory or receivables can signal that a company is having trouble selling products or collecting money from customers. However, analysts look at the relative amount of these changes if accounts receivable have gone up by the same percentage as sales revenues, the increase may not be unusual. =========================================================================== Risk Reward Ragas Whenever we talk about investments, there is always some risk associated with all of them. Risk is the most dreaded word in all the financial markets across the globe. Any person, who is operating in the financial markets, in whatever capacity, has to face risk. So the question in most minds is, what exactly this RISK is? What does it mean? In general terms, risk means any deviation from expectations. In Financial parlance, risk means any deviation from the expected returns. More specifically, the probability that the returns from any asset will differ from the expected yields is the risk inherent in that asset. We all face risk in our lives in one way or the other. So lets have an understanding of the risk Risk inherent in equity investments Equity investment is the most risky investment in all the financial markets. So one needs to have an understanding of risks associated with equity investments. Broadly, there are two types of risks associated with equity investments, viz., systematic risk and unsystematic risk. Lets have an understanding of these two types of risks. Systematic risk: or the market risk, as it is called, this is the variation in the return on any scrip due to market movements. For example, suppose the Government announces a corporate tax cut or rise across the board, it is going to effect all the stocks in the market in the same way. This is the systematic risk of scrip, which exists because of market movements. There is nothing much one can do about systematic risk of a security because it arises due to some extraneous variables. But there still exists some techniques, which help to hedge against the systematic risk of a security.
  • 11. Balance sheet basics.doc page 11 of 12 A good measure of an asset’s systematic risk is its Beta. Beta is calculated by regressing the returns of a particular asset on market returns. It can be interpreted as, say the beta of a stock is 1.25, then whenever the market moves by 1%, the stock will move by 1.25%. Unsystematic risk: is the variation in the return of a scrip due to that scrip specific factors or movements. For example, say the Government announces tax sops to companies in a particular sector, it is going to effect the prices of the stocks of companies which are operating in that sector and not all the stocks. Measuring risk We can measure risk in two ways – Ex post and Ex ante risk measurement. Ex post measurement is done after the happening of an event and Ex ante measurement is done before the happening of an event. Ex post Risk When risk is measured ex post, it is measured as Variance from the mean value. That is, it is the statistical measure of Variance associated with the returns on a particular asset. For example, if one wants to measure risk associated with a particular stock, he will take the returns generated on the stock over a period of time and then he will find out the variance in the return of that particular stock. That variance will be the risk of that stock. Ex ante Risk When it is measured ex ante, it is measured as the probability that the returns from an asset will deviate from the mean or the expected returns. For this, if the variable has a normal distribution, the Theory of Normal distribution can be easily applied to find out the probability of this deviation. Otherwise subjective estimates of the probability have to be made. For example, say the changes in a stock price have normal distribution. One can take the mean return based on the past return of the stock. Then, using the Standard Normal probability distribution, he can find out the probability of the return on that stock falling below that mean or expected return. If the stock price is not normally distributed, then he will have to make subjective estimates of probabilities of getting a particular return. Using that, he can find out what is the expected return on that stock. Then the risk on that stock is the statistical measure of variance in return of that stock from the expected return. Hedging risks associated with equity investments Risk Hedging encapsulates all the activities required to ensure that the exposure, one is having, on account of the risk, doesn’t transform into loss. That is, the exposure is only a notional loss, which might transform into actual loss on happening of a particular event, but if necessary steps are taken to control, manage and diversify away the risk, this exposure can be controlled. All the activities undertaken to do so collectively comes under the purview of risk hedging. In the following section, we present some of the commonly used techniques for managing risks: Use of derivatives: Derivatives are most commonly used to hedge against the market risk. The use of the type of derivative instrument depends upon the expectations. An example will make the point clear. Say,
  • 12. Balance sheet basics.doc page 12 of 12 you have 100 Reliance shares, the market price of which is presently RS. 300. Now you expect that the price of Reliance might go down in the future due to some reason. To hedge yourself against this risk, you can buy a Put option on Reliance’s stock and lock in a price. If the price actually falls, you can sell those shares at the price you contracted through Put option. If you expect prices to rise and you want to buy shares in the future, you can buy a Call option on Reliance’s stock. To learn more about derivative basics, click here (a link to our derivative channel). As of now, the use of derivatives on individual securities is not allowed in India. Sometime back, the use of any derivative instrument was not allowed in India. But now the SEBI has allowed the use of Index Futures on BSE and NSE. Soon, these Futures instruments will start trading on other exchanges also. And in due of course of time, the entire range of derivative instruments will be allowed in India. Making a portfolio: To guard yourself against market risk, you can also make a portfolio of stocks whose returns are negatively correlated with each other. If you make a portfolio of two stocks whose correlation co-efficient is –1 (minus 1), then your market risk is minimized.