Adverse effects of delayed antimicrobial treatment and surgical source contro...
nature14411
1. LETTER doi:10.1038/nature14411
Viraemia suppressed in HIV-1-infected humans
by broadly neutralizing antibody 3BNC117
Marina Caskey1
*, Florian Klein1
*, JulioC.C. Lorenzi1
, Michael S.Seaman2
, AnthonyP. West Jr3
, Noreen Buckley1
, GiselaKremer4,5
,
Lilian Nogueira1
, Malte Braunschweig1,6
, Johannes F. Scheid1
, Joshua A. Horwitz1
, Irina Shimeliovich1
, Sivan Ben-Avraham1
,
Maggi Witmer-Pack1
, Martin Platten4,7
, Clara Lehmann4,7
, Leah A. Burke1,8
, Thomas Hawthorne9
, Robert J. Gorelick10
,
Bruce D. Walker11
, Tibor Keler9
, Roy M. Gulick8
, Gerd Fa¨tkenheuer4,7
, Sarah J. Schlesinger1
& Michel C. Nussenzweig1,12
HIV-1 immunotherapy with a combination of first generation
monoclonal antibodies was largely ineffective in pre-clinical and
clinical settings and was therefore abandoned1–3
. However, recently
developed single-cell-based antibody cloning methods have uncov-
ered a new generation of far more potent broadly neutralizing
antibodies to HIV-1 (refs 4, 5). These antibodies can prevent infec-
tion and suppress viraemia in humanized mice and nonhuman
primates, but their potential for human HIV-1 immunotherapy
has not been evaluated6–10
. Here we report the results of a first-
in-man dose escalation phase 1 clinical trial of 3BNC117, a potent
human CD4 binding site antibody11
, in uninfected and HIV-1-
infected individuals. 3BNC117 infusion was well tolerated and
demonstrated favourable pharmacokinetics. A single 30 mg kg21
infusion of 3BNC117 reduced the viral load in HIV-1-infected
individuals by 0.8–2.5 log10 and viraemia remained significantly
reduced for 28 days. Emergence of resistant viral strains was vari-
able, with some individuals remaining sensitive to 3BNC117 for a
period of 28 days. We conclude that, as a single agent, 3BNC117 is
safe and effective in reducing HIV-1 viraemia, and that immu-
notherapy should be explored as a new modality for HIV-1 pre-
vention, therapy and cure.
A fraction of HIV-1-infected individuals develop potent neutral-
izing serologic activity against diverse viral isolates4,5
. Single-cell clon-
ing methods to isolate antibodies from these individuals12
revealed that
broad and potent neutralization can be achieved by antibodies target-
ing many sites on the viral envelope5,13,14
. Many of these antibodies can
prevent infection, and some can suppress active infection in huma-
nized mice (hu-mice) or macaques6–10
. Therefore, it is generally
accepted that a vaccine eliciting such antibodies is likely to be protect-
ive against HIV-1. However, potent anti-HIV-1 broadly neutralizing
antibodies (bNAbs) are highly somatically mutated and many carry
other uncommon features such as insertions, deletions, or long com-
plementary determining regions4,5,11,12,15
, which may account for the
difficulty in eliciting such antibodies by immunization. In view of the
efficacy of passive bNAb administration in hu-mice and maca-
ques6–9,16
, it has been suggested that bNAbs should be administered
passively, or by viral vectors for prevention and immunotherapy4,9,16
.
However, their safety and efficacy has not been tested in humans.
To determine whether the new generation of more potent bNAbs are
safe and active against HIV-1 in humans, we initiated an open label
phase 1 study (Fig. 1a) with 3BNC117, an anti-CD4 binding site anti-
body cloned from a viraemic controller11
. 3BNC117 neutralizes 195
out of 237 HIV-1 strains comprising 6 different clades with an average
half-maximal inhibitory concentration (IC50) of 0.08 mgml21
(Extended
Data Fig. 1)11
. 12 uninfected and 17 HIV-1-infected individuals (Table 1)
were administered a single intravenous dose of 1, 3, 10 or 30mgkg21
of
3BNC117 (Extended Data Table 1a). 3BNC117 serum concentrations,
plasma HIV-1 viral loads (VL), CD41
and CD81
T-cell counts, and
safety were monitored closely (Fig. 1a, Extended Data Figs 2, 3, and
Extended Data Tables 1b, 2). The two groups were comparable for
gender, race and age (Table 1).
3BNC117 was generally safe and well tolerated at all doses tested in
both uninfected and HIV-1-infected individuals. No grade 3, 4 or
serious adverse events and no treatment-related laboratory changes
were observed during 56 days of follow up (Extended Data Table 1b).
CD41
or CD81
T-cell counts did not change after 3BNC117 infusion
in the HIV-1-infected group, possibly because initial CD41
T-cell
counts were near normal in most participants (mean absolute CD41
T-cell count was 655 cells per ml, Extended Data Fig. 2).
Two different assays were used to measure 3BNC117 levels in
serum: TZM.bl neutralization assay to measure activity, and anti-idio-
type-specific ELISA to measure antibody protein levels (Fig. 1b,
Extended Data Fig. 3 and Extended Data Tables 4, 5). With few excep-
tions the two assays were generally in agreement in both groups
(Fig. 1b and Extended Data Fig. 3). However, elimination of
3BNC117 activity was more rapid in the HIV-1-infected group, result-
ing in an estimated average t1/2 of around 9 days as opposed to around
17 days in uninfected individuals (Fig. 1b and Extended Data
Tables 4, 5). We conclude that 3BNC117 has pharmacokinetic prop-
erties consistent with a typical human IgG1 in uninfected individuals
and a somewhat faster decay rate in HIV-1-viraemic individuals.
Similar antigen-dependent enhanced clearance has been reported with
anti-cancer antibodies17
. Although there may be other explanations, we
speculate that the increased rate of antibody elimination in the presence
of HIV-1 is due to accelerated clearance of antigen–antibody complexes.
Viral loads were measured by standard assays or by single-copy
assays. Baseline VLs in HIV-1-infected individuals not on anti-retro-
viral therapy (ART) varied from 640 to 53,470 copies ml21
(mean 9,420
copies ml21
). Two participants were on ART at the time of antibody
infusion but had detectable baseline VLs (30 and 100 copies ml21
).
(Table 1, Extended Data Table 2a).
Virologic responses correlated with antibody dose. Infected indivi-
duals receiving 1 or 3 mg kg21
3BNC117 doses showed only small and
transient changes in viraemia consisting of increases of up to threefold
1 day after infusion, followed by a short temporary decrease, and rapid
return to baseline (Fig. 2, Extended Data Fig. 4, and Extended Data
2 5 J U N E 2 0 1 5 | V O L 5 2 2 | N A T U R E | 4 8 7
*These authors contributed equally to this work.
1
Laboratory of Molecular Immunology, The Rockefeller University, New York, New York 10065, USA. 2
Center for Virology and Vaccine Research, Beth Israel Deaconess Medical Center, Harvard Medical
School, Boston, Massachusetts 02215, USA. 3
Division of Biology, California Institute of Technology, Pasadena, California 91125, USA. 4
First Department of Internal Medicine, University Hospital of Cologne,
D-50924 Cologne, Germany. 5
Clinical Trials Center Cologne, ZKS Ko¨ln, BMBF 01KN1106, University of Cologne, Cologne, Germany. 6
Albert Ludwigs University of Freiburg, 79085 Freiburg, Germany.
7
German Center for Infection Research (DZIF), partner site Bonn-Cologne, Cologne, Germany. 8
Division of Infectious Diseases, Weill Medical College of Cornell University, New York, New York 10065, USA.
9
Celldex Therapeutics, Inc., Hampton, New Jersey 08827, USA. 10
AIDS and Cancer Virus Program, Leidos Biomedical Research, Frederick, Frederick National Laboratory for Cancer Research, Frederick,
Maryland 21702,USA. 11
Ragon Instituteof MGH, MIT and Harvard, HowardHughes MedicalInstitute, Massachusetts GeneralHospital andHarvard MedicalSchool, Cambridge, Massachusetts 02139,USA.
12
Howard Hughes Medical Institute, The Rockefeller University, New York, New York 10065, USA.
G2015 Macmillan Publishers Limited. All rights reserved
2. Table 2a). The magnitude and kinetics of the initial increase in virae-
mia were consistent with those seen with viral entry inhibitors18
.
In contrast, 10 out of 11 individuals receiving 10 or 30 mg kg21
infu-
sions responded by dropping their VLs by up to 2.5 log10 (Fig. 2,
Extended Data Fig. 4 and Extended Data Table 2a). Two individuals
off ART received the 10 mg kg21
dose, of whom 1 responded with 1.36
log10 declineinviraemia and the other did not(Fig.2 and Extended Data
Table 2a). The individual that did not respond was infected with a virus
that was completely resistant to 3BNC117 (2C4; IC50 . 20 mg ml21
;
Fig. 3 and Extended Data Table 3). All 8 individuals that received the
30 mg kg21
dose of 3BNC117 showed highly significant and rapid
decreases in their viral loads that varied between 20.8 and 22.5 log10
(Figs 2 and 3 and Extended Data Table 2a, b). The magnitude of the
decline was related to the starting VL and the sensitivity of the subjects’
autologous virus to 3BNC117 (Figs 2 and 3, Extended Data Fig. 5). The
median time to reach the lowest level in viraemia was 7 days, and the
mean drop in VL was 1.48 log10 at lowest level. When compared to all
available pre-treatment measurements, the drop in viraemia was highly
significant from days 4 through 28 (Fig. 2 and Extended Data Table 2b).
Although the limited data set does not allow us to determine viral set
point, 4 of the 8 individuals receiving a single 30 mgkg21
infusion did
not entirely return to day 0 pre-infusion levels during the observation
period of 56 days (Figs 2 and 3, Extended Data Table 2a).
To further examine the virologic effects of 3BNC117 immunotherapy,
autologous viral isolates were obtained from cultured PBMCs before
(day 0, day 27) and after (day 28) antibody infusion. Paired samples
from 12 of the 17 HIV-1-infected individuals were tested for 3BNC117
sensitivity (Fig. 3 and Extended Data Table 3). Samples obtained from
individuals infused with 1mgkg21
showed 35- and 13.5-fold decreases in
3BNC117 sensitivity, indicating that the antibody exerts selective pressure
on HIV-1 even at the lowest dose (2A3, 2A4; Fig. 3). Similar changes in
sensitivity were seen for some (2B1, 2C5) individuals treated with 3 and
10mgkg21
, but others remained 3BNC117-sensitive throughout (2B3)
(Fig. 3, Extended Data Table 3). Similarly, at 30mgkg21
, only 2 out of 5
individuals tested showed greater than fivefold reduction in 3BNC117
sensitivity on day 28 (Extended Data Table 3). In contrast, 2C1, 2D1, 2D3
showed only 3.2-, 1.3- and 2.7-fold changes in sensitivity and these indi-
vidualsdidnotreboundtobaselineviraemialevelsatday28(Figs2and3).
We conclude that, in some individuals, HIV-1 develops high-level resist-
anceto3BNC117 by 28days after a single dose,whilein othersit doesnot.
To examine the molecular nature of the changes in HIV-1 in res-
ponse to 3BNC117, we cloned and sequenced HIV-1 envelopes from
paired plasma samples from 10 individuals before and 28days after
infusion. Evidence for antibody-induced selection was seen in some
but not allsamplesanalysed (Fig.4, Supplementary Fig.1). For example,
2C5, who received a 10mgkg21
infusion, selected for a G459D muta-
tion in 15 out of 23 env sequences, while the remainder showed a longer
V5 loop. The G459D mutation alters the CD4 binding site and can
result in resistance to 3BNC117 (ref. 9). Changes in the V5 loop can
alter sensitivity to anti-CD4 binding site antibodies by steric clashing
withtheheavyorlightchainsof3BNC117-typeantibodies. Similarly,10
or 30mgkg21
infusions selected single mutations at Q363H (2E1),
S461D (2E2), and S274Y (2E2) (Fig. 4, Supplementary Fig. 1). These
changes may alter sensitivity to 3BNC117 by interfering with binding5
.
Selection in these 3 individuals is also indicated by the emergence of a
distinct group of closely related sequences in phylogenetic trees (Fig. 4,
Supplementary Fig. 1). Consistent with the molecular analysis, and the
viral culture data (Fig. 3), pseudoviruses produced from serum of 2C5
from days 0 and 28 showed high level 3BNC117 resistance, whereas the
changes in pseudoviruses produced from 2C1, 2D1, 2E1 and 2E2 were
modest(Fig. 4 and Extended DataTable 3).Incontrast,autologous viral
isolates from individuals who did not become resistant, or had only
small changes in sensitivity, such as 2B3, showed little if any evidence of
selection. We conclude that a single infusion of 3BNC117 leads to
selection for high-level resistance in some but not all individuals.
Althoughimmunotherapywasinitiallyusedtotreatinfectiousdiseases,
the great majority of therapeutic monoclonal antibodies are currently
used to treat cancer and autoimmune diseases. This form of therapy
has been shown to be highly effective, well tolerated, and to function in
large part by engaging the host immune system through Fc receptors19
.
In contrast, a role for antibodies in controlling HIV-1 infection has
been difficult to establish. For example, the overall course of infection is
Table 1 | Study participants demographics
Uninfected (n 5 12) HIV-1-infected (n 5 17)
Gender (% male) 83% 76%
Mean age (range) 43 (22–58) 37 (20–54)
Race/ethnicity
White 42% 29%
Black or African American 50% 53%
Hispanic 8% 18%
ART status
On ART n (%) 2 2 (12%)
Off ART n (%) 2 15 (88%)
Mean absolute CD41
count
(cells ml21
; day 0)
2 655 (245–1,129)
Mean % CD41
count (day 0) 2 29% (20–42%)
Mean HIV-1 RNA level
(copies ml21
; day 0)*
2 9,420 (640–53,470)
* Mean HIV-1 RNA levels in HIV-1-infected participants off ART.
0PreScreen 1 2 4 7 14 21 28 42 56
3BNC117
infusion
Ab serum levels
HIV-1 RNA level
env sequencing
CD4+/CD8+ counts
a
b
0 14 28 42 56
1
10
100
1,000
3BNC117(μgml–1)
1 mg kg–1
0 14 28 42 56
1
10
100
1,000
Days after infusion
3BNC117(μgml–1)
10 mg kg–1
0 14 28 42 56
1
10
100
1,000 3 mg kg–1
0 14 28 42 56
1
10
100
1,000
Days after infusion
30 mg kg–1
Figure 1 | Pharmacokinetics of 3BNC117 in uninfected and HIV-1-infected
individuals. a, Diagrammatic representation of the study. Time of 3BNC117
infusion indicated by the red arrow, and sampling for 3BNC117 serum
levels, HIV-1 viral load, CD41
/CD81
T cell counts and env sequencing as
indicated below. b, Antibodydecay measured in TZM.bl assays (solid lines) and
ELISA (dotted lines). Mean values and s.e.m. for uninfected individuals (3 per
group) are shown in blue and for HIV-1-infected individuals (2–5 per group)
in red. Light grey indicates lower level of accuracy by the ELISA assay and
dark grey by the TZM.bl assay. Open circles indicate levels lower than the
accuracy threshold.
4 8 8 | N A T U R E | V O L 5 2 2 | 2 5 J U N E 2 0 1 5
G2015 Macmillan Publishers Limited. All rights reserved
RESEARCH LETTER
3. 0 14 28 42 56
–2
–1
0
1
2A1
0.90
0 14 28 42 56
–2
–1
0
1
2B1
0.78 >20
0 14 28 42 56
1
10
100
1,000
2E1
0.40
0 14 28 42 56
2A3
0.11 3.78
0 14 28 42 56
2C4
>20 >20
0 14 28 42 56
–2
–1
0
1
2E2
0.18 2.24
0 14 28 42 56
1
10
100
1,000
2A4
0.07 0.94
0 14 28 42 56
2B3
0.20 0.30
0 14 28 42 56
1
10
100
1,000
2C5
0.09 15.36
0 14 28 42 56
2E3
0.18 1.10
0 14 28 42 56
–2
–1
0
1
2C1
0.54 1.78
0 14 28 42 56
2D1
0.68 0.90
0 14 28 42 56
2D3
0.13 0.35
1 mg kg–1
Δlog10(copiesml–1)Δlog10(copiesml–1)Δlog10(copiesml–1)Δlog10(copiesml–1)
3BNC117(μgml–1)
3BNC117(μgml–1)3BNC117(μgml–1)3BNC117(μgml–1)
Days after infusion Days after infusion
0 14 28 42 56
2E4
0.24
0 14 28 42 56
1
10
100
1,000
2E5
0.30
0.01–0.1 μg ml–1
> 0.1–1.0 μg ml–1
> 1.0–10 μg ml–1
> 10 μg ml–1
Viral culture sensitivities
3 mg kg–1 10 mg kg–1
30 mg kg–1
Days after infusion Days after infusion
Figure 3 | 3BNC117 sensitivity, changes in
viraemia, and 3BNC117 levels. 3BNC117 dose is
indicated at the top of the graphs. The left y axis
shows log10 change in viraemia from day 0, and
right y axis shows antibody level measured by
ELISA. Blue line reflects change in VL and dotted
grey line antibody level. Numbers indicate IC50
values for 3BNC117 of autologous viral isolates
measured by TZM.bl assay, colour-coded as
indicated in the key. Dotted line indicates lower
level of accuracy.
0–7 7 14 21 28 42 56
101
102
103
104
105
106
101
102
103
104
105
106
101
102
103
104
105
106
101
102
103
104
105
106
weeks post infusion
HIVRNA(copiesml–1)
0–7 7 14 21 28 42 56
weeks post infusion
HIVRNA(copiesml–1)
0–7 7 14 21 28 42 56
weeks post infusion
HIVRNA(copiesml–1)
0 7 14 21 28 42 56
–2
–1
0
1
weeks post infusion
Δlog10(copiesml–1)Δlog10(copiesml–1)Δlog10(copiesml–1)Δlog10(copiesml–1)
0 7 14 21 28 42 56
–2
–1
0
1
weeks post infusion
0 7 14 21 28 42 56
–2
–1
0
1
weeks post infusion
0 7 14 21 28 42 56
–2
–1
0
1
Days after infusion
0–7 7 14 21 28 42 56
Days after infusion
HIVRNA(copiesml–1)
1mgkg–13mgkg–110mgkg–1
30mgkg–1
2A4
2A3
2A1
2B3
2B1
2C5
2C4
2D1
2C1
2D3
2E1
2E2
2E3
2E4
2E5
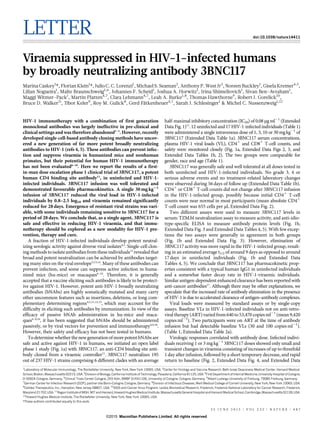
Figure 2 | HIV-1 viral load measurements.
3BNC117 dose indicated in red. Plots (left
column) show absolute VLs in HIV-1 RNA
copies ml21
(y axis) versus time in days after
infusion (x axis). Right column shows log10
changes in VL from day 0. Red line illustrates
the average (least-squares means, by mixed-
effect linear model). Individual subjects are
indicated on the right. Subjects 2E1 to 2E5
were pre-screened for 3BNC117 sensitivity.
At 30 mg kg21
dose level, the change in
viraemia was significant (P 5 0.004,
P , 0.001, P , 0.001, P , 0.001, P , 0.011 at
days 4, 7, 14, 21, and 28, respectively) when
compared to all available pretreatment values
(Extended Data Table 2b).
2 5 J U N E 2 0 1 5 | V O L 5 2 2 | N A T U R E | 4 8 9
G2015 Macmillan Publishers Limited. All rights reserved
LETTER RESEARCH
4. not thoughttobealteredin individuals thatdevelopbNAbs20
.Moreover,
first generation anti-HIV-1 bNAbs with limited breadth and activity
produced little if any measurable effects in hu-mice or viraemic indivi-
duals3,4,21
. However, antibodies can put strong selective pressure on the
virus in individuals that develop anti-HIV-1 antibody responses22–24
. In
addition, recent studies in hu-mice showed that, when administered as
monotherapy, new generation bNAbs can transiently reduce VLs, and
in combination they control viraemia for as long as concentrations
remain in the therapeutic range6,9
. In contrast, single antibodies led to
control of viraemia in SHIV-infected macaques for as long as antibody
levels remained therapeutic, and immune escape was rarely observed7,8
.
The surprising difference between hu-mice and macaques might be
attributed in part to an intact host immune system in the macaque,
including endogenous antibodies25
, or differences between SHIV and
HIV-1 infection. Our data establish that passive infusion of single
bNAbs can have profound effects on HIV-1 viraemia in humans.
Combinations of antiretroviral drugs are the standard of care for
HIV-1 infection because resistance develops to single agents26
.
Similarly, monotherapy with 3BNC117 alone is insufficient to control
infection, and we expect that antibody-drug or antibody-antibody com-
binations will be required for complete viraemic control. Although the
current generation of drugs is less expensive than antibodies, the latter
have very long half-lives and have the potential to kill infected cells and
to enhance host immunity byengaging Fc receptors19,27
. Moreover, anti-
HIV-1 antibodies can be made 100-fold more potent by molecular
engineering28
. Finally, the combination of antibodies with agents that
activate latent viruses can interfere with the HIV-1 reservoir in hu-
mice29
and may be critical to HIV-1 eradication strategies.
Given the difficulties in developing an HIV-1 vaccine and in erad-
icating established infection, passive transfer of monoclonal antibodies
is being considered for HIV-1 prevention, therapy, and cure. Our data
establish the principle that monoclonal antibodies can be both safe and
b
a
470460370360280270
2C5
470460370360280270
2E1
470460370360280270
2E22C1
470460370360280270
470460370360280270
2B3
470460370360280270
2E3
470460370360280270
2A1
470460370360280270
2A4
470460370360280270
2D1
470460370360280270
2A3
480
480
480480
480
480
480
2C1 2C5 2E12D1
0.16
0.01
0.21
0.26
0.23
0.04
6.74
11.54
7.51
8.76
3.50
0.02
0.02
0.02
0.47
0.52
0.50
0.17
0.17
0.13
0.07
0.12
0.10
0.59
0.50
0.04
2E2
0.06
0.02
0.02
0.01
0.02
0.02
0.58
Figure 4 | HIV-1 envelope sequence analysis after 3BNC117 infusion.
a, HIV-1 envelopes were cloned from plasma samples. Logogram showing env
gp120 regions (amino acid positions; 270–285, 360–371, and 455 to 471–485,
according to HXBc2 numbering) indicating sequence changes from day 0 (blue
bar) to day 28 (red bar). The frequency of each amino acid is indicated by its
height. Red residues represent mutations that were only found after treatment,
black residues represent amino acids that changed in frequency after treatment,
empty boxes represent gaps, and 1 symbols represent 3BNC117 contact sites
on gp120 (ref. 30). b, Phylogenetic trees show gp120 evolution from day 0 to 28
after treatment for 2C1, 2C5, 2D1, 2E1 and 2E2. Blue and red bars represent
sequences obtained on days 0 and 28, respectively (Supplementary Fig. 1).
Illustrated values represent the IC50 of 3BNC117 in mg ml21
against the cloned
HIV-1 pseudoviruses from the analysed sequences (Extended Data Table 3).
The geometric means of the pseudoviruses’ IC50 values on days 0 and 28,
respectively are for 2C1: 0.06 and 0.14 mg ml21
; 2C5: 0.02 and 7.09 mg ml21
;
2D1: 0.15 and 0.52mg ml21
; 2E1: 0.09 and 0.23 mg ml21
; 2E2: 0.01 and
0.03 mg ml21
.
4 9 0 | N A T U R E | V O L 5 2 2 | 2 5 J U N E 2 0 1 5
G2015 Macmillan Publishers Limited. All rights reserved
RESEARCH LETTER
5. effective against HIV-1 in humans. Antibody-mediated immunother-
apy differs from currently available drugs in that it has the potential to
affect the course of HIV-1 infection by engaging host immunity directly.
Online Content Methods, along with any additional Extended Data display items
andSource Data, are available in the onlineversion of the paper; references unique
to these sections appear only in the online paper.
Received 27 January; accepted 19 March 2015.
Published online 8 April 2015.
1. Mehandru, S. et al. Adjunctive passive immunotherapy in human
immunodeficiency virus type 1-infected individuals treated with antiviral therapy
during acute and early infection. J. Virol. 81, 11016–11031 (2007).
2. Trkola, A. et al. Delay of HIV-1 rebound after cessation of antiretroviral therapy
through passive transfer of human neutralizing antibodies. Nature Med. 11,
615–622 (2005).
3. Armbruster, C. et al. Passive immunization with the anti-HIV-1 human monoclonal
antibody (hMAb) 4E10 and the hMAb combination 4E10/2F5/2G12. J.
Antimicrob. Chemother. 54, 915–920 (2004).
4. Klein, F. et al. Antibodies in HIV-1 vaccine development and therapy. Science 341,
1199–1204 (2013).
5. West, A. P. Jr et al. Structural insights on the role of antibodies in HIV-1 vaccine and
therapy. Cell 156, 633–648 (2014).
6. Klein, F. et al. HIV therapy by a combination of broadly neutralizing antibodies in
humanized mice. Nature 492, 118–122 (2012).
7. Barouch, D. H. et al. Therapeutic efficacy of potent neutralizing HIV-1-specific
monoclonal antibodies in SHIV-infected rhesus monkeys. Nature 503, 224–228
(2013).
8. Shingai, M. et al. Antibody-mediated immunotherapy of macaques chronically
infected with SHIV suppresses viraemia. Nature 503, 277–280 (2013).
9. Horwitz, J. A. et al. HIV-1 suppression and durable control by combining single
broadly neutralizing antibodies and antiretroviral drugs in humanized mice. Proc.
Natl Acad. Sci. USA 110, 16538–16543 (2013).
10. Moldt, B. et al. Highly potent HIV-specific antibody neutralization in vitro translates
into effective protection against mucosal SHIV challenge in vivo. Proc. Natl Acad.
Sci. USA 109, 18921–18925 (2012).
11. Scheid, J. F. et al. Sequence and structural convergence of broad and potent HIV
antibodies that mimic CD4 binding. Science 333, 1633–1637 (2011).
12. Scheid, J. F. et al. Broad diversity of neutralizing antibodies isolated from memory
B cells in HIV-infected individuals. Nature 458, 636–640 (2009).
13. Scharf,L.et al. Antibody 8ANC195 revealsa siteofbroad vulnerabilityon the HIV-1
envelope spike. Cell Rep. 7, 785–795 (2014).
14. Falkowska, E. et al. Broadly neutralizing HIV antibodies define a glycan-dependent
epitope on the prefusion conformation of gp41 on cleaved envelope trimers.
Immunity 40, 657–668 (2014).
15. Klein, F. et al. Somatic mutations of the immunoglobulin framework are generally
required for broad and potent HIV-1 neutralization. Cell 153, 126–138 (2013).
16. Balazs, A. B. et al. Antibody-based protection against HIV infection by vectored
immunoprophylaxis. Nature 481, 81–84 (2012).
17. Glassman, P. M. & Balthasar, J. P. Mechanistic considerations for the use of
monoclonal antibodies for cancer therapy. Cancer Biol. Med. 11, 20–33 (2014).
18. Nettles, R. E. et al. Pharmacodynamics, safety, and pharmacokinetics of BMS-
663068, an oral HIV-1 attachment inhibitor in HIV-1-infected subjects. J. Infect.
Dis. 206, 1002–1011 (2012).
19. Nimmerjahn, F. & Ravetch, J. V. Antibody-mediated modulation of immune
responses. Immunol. Rev. 236, 265–275 (2010).
20. Euler, Z. et al. Cross-reactive neutralizing humoral immunity does not protect from
HIV type 1 disease progression. J. Infect. Dis. 201, 1045–1053 (2010).
21. Matsushita, S., Yoshimura, K., Ramirez, K. P., Pisupati, J. & Murakami, T. Passive
transfer of neutralizing mAb KD-247 reduces plasma viral load in patients
chronically infected with HIV-1. AIDS 29, 453–462 (2015).
22. Liao, H. X. et al. Co-evolution of a broadly neutralizing HIV-1 antibody and founder
virus. Nature 496, 469–476 (2013).
23. Wei, X. et al. Antibody neutralization and escape by HIV-1. Nature 422, 307–312
(2003).
24. Doria-Rose, N. A. et al. Developmental pathway for potent V1V2-directed HIV-
neutralizing antibodies. Nature 509, 55–62 (2014).
25. Klein, F. et al. Enhanced HIV-1 immunotherapy by commonly arising antibodies
that target virus escape variants. J. Exp. Med. 211, 2361–2372 (2014).
26. Deeks, S. G., Lewin, S. R. & Havlir, D. V. The end of AIDS: HIV infection as a chronic
disease. Lancet 382, 1525–1533 (2013).
27. Bournazos, S. et al. Broadly neutralizing anti-HIV-1 antibodies require Fc effector
functions for in vivo activity. Cell 158, 1243–1253 (2014).
28. Diskin, R. et al. Increasing the potency and breadth of an HIV antibody by using
structure-based rational design. Science 334, 1289–1293 (2011).
29. Halper-Stromberg, A. et al. Broadly neutralizing antibodies and viral inducers
decrease rebound from HIV-1 latent reservoirs in humanized mice. Cell 158,
989–999 (2014).
30. Zhou, T. et al. Multidonor analysis reveals structural elements, genetic
determinants, and maturation pathway for HIV-1 neutralization by VRC01-class
antibodies. Immunity 39, 245–258 (2013).
Supplementary Information is available in the online version of the paper.
Acknowledgements We thank all individuals who participated in this study. We
thank the Rockefeller University Hospital Clinical Research Support Office and
nursing staff, as well as T. Ku¨mmerle, C. Wyen, and L. Siegel for help with
recruitment; S. Kiss for ophthalmologic assessments; F. Maldarelli and J. Lifson for
single-copy analysis and B. Freemire for technical assistance; J. Pring, A. Almaktari,
C. Unsen, S. Hadrigan, E. Thomas, H. Gruell, D. Gillor, and U. Sandaradura de Silva for
sample processing and study coordination, and N. Rodziewicz for help with HIV-1
culturing. We thank A. Louie and C. Conrad for help with regulatory submissions;
L. Thomas for IND-enabling studies, L. Vitale for cell line and anti-idiotype antibody
development, B. Riordan, A. Rayo and J. Andreozzi for anti-idiotype ELISA method
development and sample analysis, R. Hammond for process development, and
S. DiSciullo for 3BNC117 manufacturing; J. Perry for performing neutralization
assays. We thank M. Suarez-Farinas for support with statistical analysis; P. Fast and
H. Park for clinical monitoring; and E. Gotschlich and B. Coller for input on study
design. J.C.C.L. is supported by an award from CNPq “Ciencia sem Fronteiras”Brazil
(248676/2013-0). This work was supported in part by the Bill and Melinda Gates
Foundation Collaboration for AIDS Vaccine Discovery (CAVD) Grants OPP1033115
(M.C.N.), OPP1092074 (M.C.N.), OPP1040753 (A.P.W.) and OPP1032144 (M.S.S.),
by grant #UL1 TR000043 from the National Center for Advancing Translational
Sciences (NCATS), by a grant from the Robertson Foundation to M.C.N., in part with
Federal funds from the NCI/NIH, under Contract No. HHSN261200800001E, and a
grant from the German Center for Infection Research (DZIF) to G.F. 3BNC117 was
generated from a subject in the International HIV Controller Study, supported by the
Mark and Lisa Schwartz Foundation and CAVD Grant 43307. M.C.N. and B.D.W. are
Howard Hughes Medical Institute Investigators. The authors declare no competing
financial interests.
Author Contributions M.C. and F.K. planned and implemented the study, analysed the
data, and wrote the manuscript; J.C.C.L. performed sequence analyses, and
contributed to writing the manuscript; M.S.S. performed TZM.bl neutralization assays;
A.P.W. assisted with sequence analyses; N.B., G.K., S.B.-A., M.W.-P., M.P., L.A.B.
implemented the study; L.N. and M.B. performed cloning and sequencing; I.S., C.L.
coordinated sample processing; T.H. performed ELISA assays; and R.J.G. performed
single copy assays. T.K. was responsible for 3BNC117 manufacture and provided
regulatory guidance; J.F.S., B.D.W., J.A.H. contributed to study design and helped with
the manuscript; R.M.G. contributed to study design; and G.F. and S.J.S. contributed to
study design and implementation. M.C.N. planned and implemented the study,
analysed the data and wrote the manuscript. All authors discussed the results and
commented on the manuscript.
Author Information Reprints and permissions information is available at
www.nature.com/reprints. The authors declare no competing financial interests.
Readers are welcome to comment on the online version of the paper.
Correspondence and requests for materials should be addressed to M.C.N.
(nussen@rockefeller.edu).
2 5 J U N E 2 0 1 5 | V O L 5 2 2 | N A T U R E | 4 9 1
G2015 Macmillan Publishers Limited. All rights reserved
LETTER RESEARCH
6. METHODS
Study design. An open-label, dose-escalation phase 1 study was conducted in unin-
fected(Group1) andHIV-1-infectedsubjects(Group2; http://www.clinicaltrials.gov;
NCT02018510). Study participants were enrolled sequentially according to eligibility
criteria. A standard “313” phase I trial design was used in the dose-escalation phase
of the study. 3BNC117 was administered as a single intravenous infusion at four dose
levels: 1mgkg21
(subjects 1A1, 1A2, 1A3, 2A1, 2A3, 2A4), 3mgkg21
(subjects 1B1,
1B2, 1B3, 2B1, 2B2, 2B3), 10mgkg21
(subjects 1C1, 1C3, 1C4, 2C2, 2C4, 2C5) or
30mgkg21
(subjects 1E2, 1E3, 1E5, 2D1, 2C1, 2D3, 2E1, 2E2, 2E3, 2E4, 2E5), at a rate
of 100 or 250mlh21
. All participants provided written informed consent before
participation in the study and the study was conducted in accordance with Good
Clinical Practice. The protocol was approved by the Federal Drug Administration in
theUSA,thePaulEhrlichInstituteinGermanyandtheInstitutionalReviewBoardsat
the Rockefeller University and the University of Cologne.
Study participants. All study participants were recruited at the Rockefeller
University Hospital, New York, USA and at the University Hospital Cologne,
Cologne, Germany. Eligible subjects were adults aged 18–65 years, HIV-1-infected
or uninfected, and without concomitant hepatitis B or C infections. HIV-1-infected
subjects enrolled in study groups 2A through 2E were ART-experienced or naive. In
groups 2A through 2D, subjects were either off standard ART for at least 8 weeks
before study participation and had plasma HIV-1 RNA levels between 2,000 and
100,000 copiesml21
, or they were on standard ART but had plasma HIV-1 RNA
levels .20 copies ml21
, measured on two separate occasions at least 1week apart.
Subjects recruited into group 2E were HIV-1-infected, off ART (2,000–100,000
copiesml21
), and differed from the other groups in that they were pre-screened
for sensitivity to 3BNC117 as described below. Subjects with CD41
T-cell counts
,300cellsml21
, clinically relevant deviations from normal physical findings, abnor-
mal electrocardiogram (ECG), and/or laboratory examinations were excluded.
Women of childbearing potential were required to have a negative result of a serum
pregnancy test on the day of 3BNC117 infusion. HIV-1-infected individuals, who
were not on standard ART at enrolment, were given the option to initiate ART
6weeks after 3BNC117 infusion.
Study procedures. The appropriate volume of 3BNC117 was calculated according
to study dose group, diluted in sterile normal saline to a total volume of 100 or
250ml, and administered intravenously over 60 min. Study participants received
3BNC117 on day 0 and remained under close monitoring in the inpatient unit of
the Rockefeller University Hospital for 24 h. Participants returned for frequent
follow up visits for safety assessments that included physical examination, mea-
surement of clinical laboratory parameters such as haematology, chemistries,
urinalysis, coagulation times, pregnancy tests (for women) as well as HIV-1 viral
loads and CD41
and CD81
T-cell counts (Fig. 1a). Adverse events were graded
according to the DAIDS AE Grading Table (HIV-1-infected groups) or the
Toxicity Grading Scale for Healthy Adult and Adolescent Volunteers Enrolled
in Preventive Vaccine Clinical Trials (uninfected groups). Blood samples (30 to
120ml) were collected before and at multiple times after 3BNC117 infusion.
Samples were processed within 4 h of collection, and serum and plasma samples
were stored at –80 uC. PBMCs were isolated by density gradient centrifugation.
The absolute number of peripheral blood mononuclear cells was determined by an
automated cell counter (Vi-Cell XR; Beckman Coulter), and cells were cryopre-
served in fetal bovine serum plus 10% DMSO.
Plasma HIV-1 RNA levels. Plasma was collected for measuring HIV-1 RNA
levels at screening (from day –49 to day 214), the day –7 pre infusion visit (from
day 242 to day 22), day 0 (before infusion), and on days 1, 4, 7, 14, 21, 28, 42 and
56. HIV-1 RNA levels were determined using the Roche COBAS AmpliPrep/
COBAS TaqMan HIV-1 Assay, Version 2.0, which detects 20 to 103 106
copies
ml21
, or by the ABBOTT RealTime Assay, which detects 40 to 103 106
copies
ml21
. In samples with HIV-1 RNA ,20 copiesml21
, viraemia was measured by a
quantitative real-time, reverse transcriptase (RT)-initiated PCR (RT–PCR) assay
that can quantify HIV-1 RNA down to 1 copy ml21
as previously described31
.
CD41
and CD81
T cells. CD41
and CD81
T-cell counts were determined at
screening, on day0 (before infusion), and day28 by a clinical flow cytometryassay,
performed at LabCorp or at the University Hospital Cologne. Leukocytes were
determined as CD451
cells. Percentage of cells positively stained for CD3, CD4,
CD8 as well as the CD4/CD8 ratio were analysed with the BD Multiset software
(BD Biosciences).
3BNC117 study drug. 3BNC117 is a recombinant, fully human IgG1k mAb
recognizing the CD4 binding site on the HIV-1 envelope11
. The antibody was
cloned from an HIV-1-infected viraemic controller in the International HIV
Controller Study11,32
, expressed in Chinese hamster ovary cells (clone 5D5-
5C10), and purified using standard methods. The 3BNC117 drug substance was
produced at Celldex Therapeutics Fall River (MA) GMP facility, and the drug
product was fill-finished at Gallus BioPharmaceuticals (NJ). The resulting purified
3BNC117 was supplied as a single use sterile 20 mg ml21
solution for intravenous
injection in 8.06 mM sodium phosphate, 1.47 mM potassium phosphate,
136.9 mM sodium chloride, 2.68 mM potassium chloride, and 0.01% polysorbate
80. 3BNC117 vials were shipped and stored at 4 uC.
Measurement of 3BNC117 serum levels. Serum levels of 3BNC117 were deter-
mined by using two separate methods (ELISA and TZM.bl). 3BNC117 serum
concentrations were measured by a validated sandwich ELISA. Plates (Sigma-
Aldrich PN: CLS3590 96-well, High Bind, polystyrene) were coatedwith 4 mg ml21
of an anti-idiotypic antibody specifically recognizing 3BNC117 (anti-ID 1F1
mAb), and incubated overnight at 2–8 uC. After washing, plates were blocked
for 1 h with 5% BSA. Serum samples, QCs and standards were added (1:50 min-
imum dilution in 5% BSA) and incubated for 1 h at room temperature. 3BNC117
was detected using an horseradish peroxidase (HRP)-conjugated mouse anti-
human IgG kappa-chain-specific antibody (Abcam PN: ab79115) and the HRP
substrate tetra-methylbenzidine. 3BNC117 concentrations were then interpolated
from a standard curve of 3BNC117 using a 4 parameter logistic curve-fitting
algorithm. The reference standard and positive controls were created from the
drug product lot of 3BNC117 used in the clinical study. The capture anti-idiotypic
antibody was produced by immunizing BALB/c mice with a Fab9 fragment of
3BNC117 and plasma was tested for the presence of neutralizing antibodies in an
ELISA. Briefly, the HIV-1 antigen (2CC core protein) was coated to a plate and
blocked. Plasma dilutions were pre-incubated with a sub-saturating concentration
of 3BNC117 then added to the plate. Binding to the antigen was detected with an
HRP-conjugated goat anti-mouse IgG-Fc specific antibody. Plasma was consid-
ered neutralizing if it was able to block the binding of 3BNC117 to the antigen
coated plate. Two mice were selected for fusion. Those hybridomas that showed
high specificity when comparing binding to 3BNC117 versus binding to the irrel-
evant human IgG1 antibody were selected to expand, screened in the neutraliza-
tion assay as described above, subcloned and purified for use in the anti-idiotype-
specific ELISA.
In addition, the concentration of active 3BNC117 was determined by TZM.bl
neutralization assay7,8
. Serum samples were heat-inactivated for 1 h at 56 uC and
measured for neutralizingactivityagainst an HIV-1strain that was highlysensitive
to 3BNC117 but resistant to any autologous HIV-1 neutralizing serum activity. In
all uninfected subjects serum samples were tested against Q769.d22 and ID50
values were derived by using a 5-parameter curve fitting, considering accurate
within the pre-established limits (threefold variation with a 20% error rate). The
serum concentration of active 3BNC117 was calculated by taking into account the
sera ID50 titres multipliedby the knownIC50 of3BNC117 forQ769.d22.In HIV-1-
infected subjects pre-infusion samples were first tested against a panel of
3BNC117-sensitive HIV-1 strains that included Q769.d22 (Clade A1, Tier 2),
YU2.DG (Clade B, Tier 2), Q259.d2.17 (Clade C, Tier 1B), Q842.d12 (Clade A1,
Tier 2), ZM135M.PL10a (Clade C, Tier 2), and TRO.11 (Clade B, Tier 2). A single
strain per subject was selected that showed no or only minimal background
activity and 3BNC117 serum levels were determined in the same way as described
for Q769.d22.
Pharmacokinetic analysis. Blood samples were collected immediately before, at
the end, 0.5, 3, 6, 9, 12 and 24 h after completion of the 3BNC117 infusion, and on
days 2,4,7,14,21,28,42and56.3BNC117 serum levelswere obtained from ELISA
(Celldex Therapeutics) and TZM.bl neutralization assay, and PK-parameters
were estimated by performing a non-compartmental analysis (NCA) using
WinNonlin 6.3.
Neutralization assay. Serum samples, viral supernatants, and control antibodies
were tested against HIV-1 envelope pseudoviruses as previously described33,34
.
Virus cultures. Autologous virus was retrieved from HIV-1 infected individuals
as previously described35
. Briefly, healthy donor peripheral blood mononuclear
cells (PBMCs) were obtained by leukapheresis from a single donor. Cells were
cultured at a concentration of 53 106
ml21
in Iscove’s modified Dulbecco’s med-
ium (IMDM; Gibco) supplemented with 10% fetal bovine serum (FBS; HyClone,
Thermo Scientific), 1% penicillin/streptomycin (Gibco), and 1 mg ml21
phytohae-
magglutinin (Life Technologies) at 37 uC and 5% CO2. After 2–3 days, 53 106
cells
were transferred into IMDM supplemented with 10% FBS, 1% penicillin/strep-
tomycin, 5 mg ml21
polybrene (Sigma), and 10 U ml21
of IL-2, and co-incubated
with 2–33 106
PBMCs from the study participants obtained before and 28 days or
later after 3BNC117 infusion (Extended Data Table 3). Media was replaced on a
weekly basis and culture supernatants quantified using the Alliance HIV-1 p24
Antigen ELISA kit (PerkinElmer) according to the manufacturer’s instructions.
Tissue culture infectious dose for50%ofcells(TCID50) valueswere determined for
all HIV-1 containing supernatants33,34
and then tested for sensitivity against
3BNC117 in a TZM.bl neutralization assay.Outgrowth of autologousvirus isolates
from subjects with low level viraemia was performed as previously described36
.
Briefly, 2–5 million CD41
T cells were cultured in the presence of 10 million
irradiated healthy donor PBMCs and 3 million healthy donor PHA stimulated
CD81
depleted lymphoblasts. Lymphoblasts were replenished weekly by adding 3
G2015 Macmillan Publishers Limited. All rights reserved
RESEARCH LETTER
7. million healthy donor PHA stimulated CD81
depleted lymphoblasts. Blood sam-
ples and leukopheresis were collected under separate IRB-approved protocols and
after study participants provided informed consent.
Sequence analysis. HIV-1 RNA was extracted from plasma samples using the
Qiagen MinElute Virus Spin kit (Qiagen) followed by first strand cDNA synthesis
using SuperScript III reverse transcriptase (Invitrogen Life Technologies) and the
antisense primer env3out 59-TTGCTACTTGTGATTGCTCCATGT-3937
or 59-
GGTGTGTAGTTCTGCCAATCAGGGAAGWAGCCTTGTG-396
. gp160 env
was amplified using envB5out 59-TAGAGCCCTGGAAGCATCCAGGAAG-39
and envB3out 59–TTGCTACTTGTGATTGCTCCATGT–39 in the first round
and second round nested primers envB5in 59-CACCTTAGGCATCTCCTATG-
GCAGGAAGAAG-39 and envB3in 59-GTCTCGAGATACTGCTCCCACCC-39.
First round PCR was performed using a High Fidelity Platinum Taq (Invitrogen)
at 94 uC, 2 min; (94uC, 15 s; 55 uC 30 s; 68 uC, 4 min)3 35; 68 uC, 15 min. Second
round PCR was performed with 2 ml of 1. PCR product as template and Phusion
Hot Start Polymerase at 98 uC, 30 s; (98uC, 8 s; 55 uC, 20 s; 72 uC, 1 min)3 35;
72 uC, 6 min. gp120 env was amplified using first round primers and conditions as
described, but second round was performed by using second round nested primers
59-TAGAAAGAGCAGAAGACAGTGGCAATGA-39 and 59-
TCATCAATGGTGGTGATGATGATGTTTTTCTCTCTGCACCACTCTTCT-
39. Second round PCR was performed with 1 ml of 1. PCR product as template and
High Fidelity Platinum Taq (Invitrogen) at cycling conditions, 94 uC, 2 min;
(94 uC, 15 s; 58 uC, 35 s; 68 uC, 2 min and 30 s)3 35; 68 uC, 10 min. Following
the second-round PCR amplification, 0.5 ml Taq polymerase was added to each
50 ml reaction and an additional 72 uC extension for 15 min was performed to add
39dA overhangs for cloning inserts into pCR4-TOPO. PCR amplicons were gel-
purified and ligated into pCR4-TOPO (Invitrogen) or pcDNA3.1 (Invitrogen),
followed by transfection into MAX Efficiency Stbl2 Competent Cells (Life
Technologies). Individual colonies were analysed for insert length by PCR, and
successfully cloned envelopes sequenced by a set of env specific primers. Sequence
alignments and mutation analysis of gp120 and gp160 was performed by using
Geneious Pro software, version 5.6.7 (Biomatters Ltd), and residues were num-
bered according to HXBc2. Phylogenetic trees were generated using the PhyML
tool at the Los Alamos HIV website38
, and sequence analysis was performed using
Antibody database by Anthony West39
. Logograms were generated using the
Weblogo 3.0 tool40
. Selected sequences were used to generate pseudoviruses and
tested for 3BNC117 sensitivity in a TZM.bl assay37
.
Statistical analyses. The sample size to detect .1 log10 decline in viraemia with
80% power at 5% of significance was determined to be 5 HIV-1-infected indivi-
duals, not on ART, infected with 3BNC117-sensitive viruses assuming that the
standard deviation would be similar to 3BNC117 effects in hu-mice9
. Adverse
events were summarized by the number of subjects who experienced the event,
by severity grade and by relationship to 3BNC117 according to the DAIDS AE
Grading Table (HIV-1-infected groups) or the Toxicity Grading Scale for Healthy
Adult and Adolescent Volunteers Enrolled in Preventive Vaccine Clinical Trials
(uninfected groups). PK-parameters were estimated by performing a non-com-
partmental analysis (NCA) using WinNonlin 6.3. CD41
and CD81
T-cell counts
before and after 3BNC117 were analysed by one-way ANOVA. To assess the
changes in HIV-1 viral loads, we used a mixed-effect linear model where dose
and time were fixed effects and random intercepts for each participant. These
models take full advantage of the repeated measure structure of the data while
estimating parameters for each dose simultaneously, hence improving the power
of small study groups. The final model was fitted assuming an AR(1) correlation
structure over time, which was the best in terms of AIC/BIC criteria. The signifi-
cance of the effect of 3BNC117 on viral load, defined as change between each time
point and day 0, was assessed using least-squares means within each dose group
(Extended Data Table 2b). Sensitivity analysis was also carried out with variations
of these models and the same conclusions were achieved. Pearson and nonpara-
metric Spearman coefficients were calculated to assess the correlation between
maximum drop in viraemia after 3BNC117 infusion and baseline HIV-1 viral load
or baseline sensitivity of autologous viruses to 3BNC117.
31. Somsouk, M. et al. The immunologic effects of mesalamine in treated HIV-infected
individuals with incomplete CD41 T cell recovery: a randomized crossover trial.
PLoS ONE 9, e116306 (2014).
32. Pereyra, F. et al. The major genetic determinants of HIV-1 control affect HLA class I
peptide presentation. Science 330, 1551–1557 (2010).
33. Montefiori, D. C. Evaluating neutralizing antibodies against HIV, SIV, and SHIV in
luciferase reporter gene assays. Curr. Protoc. Immunol. 12, Unit 12.11 (2005).
34. Li, M. et al. Human immunodeficiency virus type 1 env clones from acute and early
subtypeB infectionsforstandardizedassessmentsofvaccine-elicitedneutralizing
antibodies. J. Virol. 79, 10108–10125 (2005).
35. van ’t Wout, A. B., Schuitemaker, H. & Kootstra, N. A. Isolation and propagation of
HIV-1 on peripheral blood mononuclear cells. Nature Protocols 3, 363–370
(2008).
36. Laird, G. M. et al. Rapid quantification of the latent reservoir for HIV-1 using a viral
outgrowth assay. PLoS Pathog. 9, e1003398 (2013).
37. Salazar-Gonzalez, J. F. et al. Deciphering human immunodeficiency virus type 1
transmission and early envelope diversification by single-genome amplification
and sequencing. J. Virol. 82, 3952–3970 (2008).
38. Guindon, S. et al. New algorithms and methods to estimate maximum-likelihood
phylogenies: assessing the performance of PhyML 3.0. Syst. Biol. 59, 307–321
(2010).
39. West, A. P. Jr. Computational analysis of anti-HIV-1 antibody neutralization panel
datatoidentifypotential functionalepitope residues. Proc.NatlAcad.Sci. USA110,
10598–10603 (2013).
40. Crooks, G. E., Hon, G., Chandonia, J. M. & Brenner, S. E. WebLogo: a sequence logo
generator. Genome Res. 14, 1188–1190 (2004).
G2015 Macmillan Publishers Limited. All rights reserved
LETTER RESEARCH
8. 0.001 0.01 0.1 1 10 100
3BNC117 concentration (ug/ml)
10
20
30
40
50
60
70
80
90
100
%Coverage
Clade
number of
tested strains
Mean IC50*
Coverage (%)
(IC50 <10 g/ml)
A 57 0.04 86.0
AE 22 0.08 90.9
B 49 0.08 91.8
C 84 0.14 71.4
D 17 0.11 88.2
G 7 0.16 71.4
All clades 237** 0.08 82.3
Data retrieved from AntibodyDatabase (West et al., PNAS, 2013)
3BNC117
* Geometric Mean
* * Includes 1 strain, of which no clade was determined
a b
Extended Data Figure 1 | HIV-1 neutralizing activity of 3BNC117.
a, Summary of 3BNC117 neutralizing in vitro activity based on 237 HIV-1
isolates comprising 6 different clades. Data were retrieved from the
‘AntibodyDatabase’ by A.P.W. (ref. 39). b, Illustration of the fraction (that is, %
coverage; y axis) of HIV-1 isolates that are neutralized at a given IC50 (mg ml21
;
x axis) using the same data set.
G2015 Macmillan Publishers Limited. All rights reserved
RESEARCH LETTER
9. screen 0 28
0
500
1000
1500
Days after infusion
CD4+Tcells/l
screen 0 28
0
20
40
60
80
100
Days after infusion
%CD4+Tcells
screen 0 28
0
1000
2000
3000
Days after infusion
CD8+Tcells/l
screen 0 28
0
20
40
60
80
100
Days after infusion
%CD8+Tcells
n.s.a
b
n.s.
n.s. n.s.
Extended Data Figure 2 | CD41
and CD81
T-cell counts before and after
3BNC117 infusion. a, Absolute numbers (cells ml21
) of CD41
and CD81
T-cell counts of all enrolled HIV-1-infected participants at screen, on the day of
3BNC117 infusion (day 0), and at day 28 after infusion. b, Percentage of CD41
and CD81
T cells for the same subjects and time points. Mean and standard
deviation are indicated in red and black, respectively. No significant differences
between pre-infusion and post infusion levels were detected by using one-way
ANOVA.
G2015 Macmillan Publishers Limited. All rights reserved
LETTER RESEARCH
10. 0 14 28 42 56
1
10
100
1000
weeks post infusion
3BNC117(g/ml)
1B1 (3 mg/kg)
0 14 28 42 56
1
10
100
1000 1E5 (30 mg/kg)
Days after infusion
3BNC117(g/ml)
0 14 28 42 56
1
10
100
1000
weeks post infusion
3BNC117(g/ml)
1A2 (1 mg/kg)
0 14 28 42 56
1
10
100
1000
weeks post infusion
g/ml)
1B2 (3 mg/kg)
0 14 28 42 56
1
10
100
1000 1E4 (30 mg/kg)
Days after infusion
3BNC117(g/ml)
0 14 28 42 56
1
10
100
1000
weeks post infusion
3BNC117(g/ml)
1A3 (1 mg/kg)
0 14 28 42 56
1
10
100
1000 1B3 (3 mg/kg)
weeks post infusion
g/ml)
0 14 28 42 56
1
10
100
1000 1E2 (30 mg/kg)
Days after infusion
0 14 28 42 56
1
10
100
1000 1C1 (10 mg/kg)
weeks post infusion
0 14 28 42 56
1
10
100
1000 1C3 (10 mg/kg)
weeks post infusion
g/ml)
0 14 28 42 56
1
10
100
1000 1C4 (10 mg/kg)
weeks post infusion
g/ml)
0 14 28 42 56
1
10
100
1000
weeks post infusion
1A1 (1 mg/kg)
a
0 14 28 42 56
1
10
100
1000 2A1 (1mg/kg)
weeks post infusion
3BNC117(g/ml)
0 14 28 42 56
1
10
100
1000 2A3 (1mg/kg)
weeks post infusion
g/ml)
0 14 28 42 56
1
10
100
1000 2A4 (1mg/kg)
weeks post infusion
g/ml)
0 14 28 42 56
1
10
100
1000
weeks post infusion
3BNC117(g/ml)
2B1 (3 mg/kg)
0 14 28 42 56
1
10
100
1000 2B2 (3 mg/kg)
weeks post infusion
g/ml)
0 14 28 42 56
1
10
100
1000 2B3 (3 mg/kg)
weeks post infusion
g/ml)
0 14 28 42 56
1
10
100
1000 2C2 (10 mg/kg)
weeks post infusion
g/ml)
0 14 28 42 56
1
10
100
1000 2C4 (10 mg/kg)
weeks post infusion
g/ml)
0 14 28 42 56
1
10
100
1000 2C5 (10 mg/kg)
weeks post infusion
g/ml)
0 14 28 42 56
1
10
100
1000 2E1 (30 mg/kg)
Days after infusion
3BNC117(g/ml)
0 14 28 42 56
1
10
100
1000 2E2 (30 mg/kg)
Days after infusion
3BNC117(g/ml)
0 14 28 42 56
1
10
100
1000 2E3 (30 mg/kg)
Days after infusion
3BNC117(g/ml)
0 14 28 42 56
1
10
100
1000 2D1 (30 mg/kg)
weeks post infusion
3BNC117(g/ml)
0 14 28 42 56
1
10
100
1000 2C1 (30 mg/kg)
weeks post infusion
g/ml)
0 14 28 42 56
1
10
100
1000 2D3 (30 mg/kg)
weeks post infusion
g/ml)
HIV-1-uninfected b HIV-1-infected
3BNC117(g/ml)3BNC117(g/ml)3BNC117(g/ml)
3BNC117(g/ml)
Extended Data Figure 3 | 3BNC117 serum concentration and activity in
single subjects. a, b, Serum levels of 3BNC117 in all uninfected (a) and HIV-1-
infected (b) individuals that received 1, 3, 10, or 30 mg kg21
3BNC117 at day 0.
Antibody levels were measured by a sandwich ELISA using an anti-3BNC117
specific antibody (green) or by measuring the 3BNC117 serum activity in a
TZM.bl neutralization assay (blue).
G2015 Macmillan Publishers Limited. All rights reserved
RESEARCH LETTER
11. 0 14 28 42 56
-2
-1
0
1
1
10
100
1000
2C2
0.49 0.03
0 14 28 42 56
-2
-1
0
1
1
10
100
1000
2B2
>20
log10(copies/ml)log10(copies/ml)
3BNC117(g/ml)3BNC117(g/ml)
Days after infusion
0.01- 0.1 g/ml
> 0.1- 1.0 g/ml
> 1.0- 10 g/ml
> 10 g/ml
Viral culturesensitivities to 3BNC117 (IC50
)
-2
-1
0
1
Extended Data Figure 4 | 3BNC117 sensitivity and changes in viraemia in 2
ART-treated subjects. Both subjects were on ART when enrolled in the study
and received a single dose (2B2, 3 mg kg21
; 2C2, 10 mg kg21
) of 3BNC117 at
day 0. The left y axis shows log10 change in viraemia from baseline, and right y
axis shows antibody level measured in ELISA. Blue line reflects change in VL
and dotted grey line antibody level. Numbers indicate IC50 values for 3BNC117
of autologous viral isolates measured by TZM.bl assay, colour-coded as
indicated on the right.
G2015 Macmillan Publishers Limited. All rights reserved
LETTER RESEARCH
12. a Starting viremia versus maximum drop in viral load
102 103 104 105
-3
-2
-1
0
copies/ml
Maximumdropinviremia(log)
Drop in viremia versus 3BNC117 sensitivity
0.1 1 10 20
-3
-2
-1
0
3BNC117 Sensitiviy (IC50; g/ml)
Maximumdropinviremia(log)
b
Extended Data Figure 5 | Correlating viral decay with 3BNC117 sensitivity
and starting viral load. a, Maximum decline in viral load in ART-untreated
HIV-1-infected participants with baseline 3BNC117-sensitive viruses
(IC50 , 1 mg ml21
) versus pre-treatment (day 0) viral load (Pearson coefficient
r 5 0.72 P 5 0.03; Spearman coefficient rho5 0.78, P 5 0.02). b, Maximum
drop in viral load in HIV-1-infected and viremic individuals receiving a 10 or
30 mg kg21
dose of 3BNC117 (y axis) versus baseline autologous virus
sensitivity to 3BNC117 (x axis; Pearson coefficient r 5 0.69 P 5 0.03; Spearman
coefficient rho5 0.41, P 5 0.23).
G2015 Macmillan Publishers Limited. All rights reserved
RESEARCH LETTER
13. Extended Data Table 1 | Baseline characteristics of HIV-1-infected individuals and 3BNC117 safety data
a
Study ID 3BNC117 dose Age
Years
since HIV
Diagnosis
Current ART
regimen
Clade
HIV-RNA level
(copies/ml)
abs. CD4+
T cell
count (day 0;
cells/mm3
)
2A1 1 mg/kg 35 11 ART naïve B 3,210 674
2A3 1 mg/kg 39 14 Off ART B 43,650 520
2A4 1 mg/kg 42 8 ART naïve B 5,340 607
2B1 3 mg/kg 20 1 Off ART ND 4,090 264*
2B2 3 mg/kg 48 20 DRV/r/TDF/FTC** ND 100 706
2B3 3 mg/kg 20 1 ART naïve B 38,190 777
2C2 10 mg/kg 51 12 ATV/r/3TC/ZDV** ND 30 728
2C4 10 mg/kg 54 23 Off ART ND 820 805
2C5 10 mg/kg 50 4 ART naïve B 9,260 245*
2D1 30 mg/kg 33 3 ART naïve B 53,470 980
2C1 30 mg/kg 51 17 Off ART B 47,650 1129
2D3 30 mg/kg 33 0.5 ART naïve ND 640 618
2E1 30 mg/kg 21 2 ART naïve B 15,780 847
2E2 30 mg/kg 46 1.5 ART naïve B 6,990 513
2E3 30 mg/kg 23 1.5 ART naïve BF 22,030 590
2E4 30 mg/kg 38 1 ART naïve ND 32,220 603
2E5 30 mg/kg 30 1 ART naïve ND 3,610 532
b
Adverse Events
No.
AEs
% of
reported
AEs
No.
possibly
related
No.
Mild
No.
Moderate
No.
Severe
1
mg/kg
3
mg/kg
10
mg/kg
30
mg/kg
1
mg/kg
3
mg/kg
10
mg/kg
30
mg/kg
Rhinorrhea and/or cough 10 16.9 3 8 2 0 1 1 0 1 1 0 0 6
Malaise 7 11.9 5 5 2 0 1 1 2 0 1 2 0 0
Headache 6 10.2 3 5 1 0 0 0 0 1 1 0 1 3
Diarrhea 5 8.5 1 2 1 0 1 1 0 0 1 0 1 1
Myalgia/arthralgia (localized) 4 6.8 1 3 1 0 0 0 0 0 1 0 3 0
Sore throat 4 6.8 2 4 0 0 1 1 0 0 0 1 1 0
Tenderness 3 5.1 1 3 0 0 0 0 0 1 1 0 1 0
Increased Lacrimation 2 3.4 2 2 0 0 0 0 0 1 0 0 0 1
Myalgia 2 3.4 1 2 0 0 0 0 0 0 0 0 1 1
Chills 2 3.4 0 1 1 0 0 1 0 0 1 0 0 0
Conjunctival erythema 2 3.4 2 2 0 0 0 0 1 0 1 0 0 0
Fevershiness 2 3.4 0 1 1 0 0 0 0 0 1 1 0 0
Nausea 2 3.4 1 2 0 0 0 0 0 1 1 0 0 0
Pruritus 2 3.4 2 2 0 0 0 0 0 0 0 0 0 2
Blurry vision 1 1.7 1 1 0 0 0 0 0 0 0 0 1 0
Decreased appetite 1 1.7 0 1 0 0 0 0 0 0 1 0 0 0
Erythema 1 1.7 1 1 0 0 0 0 0 1 0 0 0 0
Paresthesia upper extremity 1 1.7 0 1 0 0 0 0 0 0 1 0 0 0
Shingles 1 1.7 0 0 1 0 0 0 0 0 0 0 0 1
Vomiting 1 1.7 1 1 0 0 0 0 0 0 1 0 0 0
Uninfected (No. of AEs) HIV-1-infected (No. of AEs)
a, Baseline characteristics of HIV-1-infected individuals. *Absolute CD4 T-cell count was 309 and 302 cells ml21
at screening. **DRV/r/TDF/FTC, darunavir, ritonavir tenofovir, emtricitabine; ATV/r/3TC/ZDV,
atazanavir, ritonavir, lamividune, zidovudine. ND, not determined. b, 3BNC117 safety data. AE, adverse events. Subject 2D3 developed herpes zoster involving a lumbar dermatome 35 days after infusion. The
event was graded as moderate and considered not related to 3BNC117.
G2015 Macmillan Publishers Limited. All rights reserved
LETTER RESEARCH
14. Extended Data Table 2 | HIV-1 RNA levels and viral decay mixed-effect linear model
a b
4A23A21A2 Contrast Dose Average SE p.value
Timepoint c/ml log10 log10 Timepoint c/ml log10 log10 Timepoint c/ml log10 log10 Screen - Day 0 1mg/kg -0.133 0.258 0.607
Screen 1,340 3.13 - Screen 41,670 4.62 - Screen 5,350 3.73 - Day -7 - Day 0 1mg/kg -0.112 0.200 0.573
Pre 1,100 3.04 - Pre 48,100 4.68 - Pre 6,490 3.81 - Day 1 - Day 0 1mg/kg 0.299 0.200 0.134
Day 0 3,210 3.51 0.00 Day 0 43,560 4.64 0.00 Day 0 5,340 3.73 0.00 Day 4 - Day 0 1mg/kg 0.043 0.258 0.866
Day 1 10,810 4.03 0.52 Day 1 50,180 4.70 0.06 Day 1 10,880 4.04 0.31 Day 7 - Day 0 1mg/kg -0.047 0.290 0.873
Day 4 4,970 3.70 0.19 Day 4 24,050 4.38 -0.26 Day 4 8,430 3.93 0.20 Day 14 - Day 0 1mg/kg 0.028 0.310 0.927
Day 7 3,190 3.50 -0.01 Day 7 34,850 4.54 -0.10 Day 7 4,870 3.69 -0.04 Day 21 - Day 0 1mg/kg 0.046 0.323 0.888
Day 14 2,600 3.41 -0.10 Day 14 31,770 4.50 -0.14 Day 14 11,000 4.04 0.31 Day 28 - Day 0 1mg/kg 0.105 0.331 0.752
Day 21 3,820 3.58 0.07 Day 21 35,840 4.55 -0.09 Day 21 7,470 3.87 0.14 Day 42 - Day 0 1mg/kg 0.180 0.337 0.592
Day 28 5,070 3.71 0.20 Day 28 38,500 4.59 -0.05 Day 28 7,880 3.90 0.17 Day 56 - Day 0 1mg/kg 0.294 0.340 0.388
Day 42 3,570 3.55 0.04 Day 42 59,780 4.78 0.14 Day 42 12,150 4.08 0.35
Day 56 6,370 3.80 0.29 Day 56 63,600 4.80 0.16 Day 56 14,020 4.15 0.42
3B22B21B2 Contrast Dose Average SE p.value
Timepoint c/ml log10 log10 Timepoint c/ml log10 log10 Timepoint c/ml log10 log10 Screen - Day 0 3mg/kg 0.172 0.316 0.587
Screen 6,420 3.81 - Screen 80* 1.90 - Screen 53,660 4.73 - Day -7 - Day 0 3mg/kg -0.020 0.244 0.936
Pre 4,950 3.69 - Pre 30 1.48 - Pre 28,810 4.46 - Day 1 - Day 0 3mg/kg 0.061 0.244 0.803
Day 0 4,090 3.61 0.00 Day 0 100 2.00 0.00 Day 0 38,190 4.58 0.00 Day 4 - Day 0 3mg/kg -0.351 0.316 0.267
Day 1 6,470 3.81 0.20 Day 1 140 2.15 0.15 Day 1 31,950 4.50 -0.08 Day 7 - Day 0 3mg/kg -0.338 0.356 0.343
Day 4 2,690 3.43 -0.18 Day 4 190 2.28 0.28 Day 4 11,540 4.06 -0.52 Day 14 - Day 0 3mg/kg 0.024 0.380 0.949
Day 7 1,610 3.21 -0.40 Day 7 20 1.30 -0.70 Day 7 20,500 4.31 -0.27 Day 21 - Day 0 3mg/kg 0.022 0.396 0.955
Day 14 4,880 3.69 0.08 Day 14 130 2.11 0.11 Day 14 35,830 4.55 -0.03 Day 28 - Day 0 3mg/kg -0.063 0.406 0.877
Day 21 4,160 3.62 0.01 Day 21 90 1.95 -0.05 Day 21 41,570 4.62 0.04 Day 42 - Day 0 3mg/kg -0.017 0.412 0.966
Day 28 3,800 3.58 -0.03 Day 28 70 1.85 -0.15 Day 28 30,810 4.49 -0.09 Day 56 - Day 0 3mg/kg -0.100 0.416 0.809
Day 42 4,970 3.70 0.09 Day 42 90 1.95 -0.05 Day 42 29,020 4.46 -0.12
Day 56 3,550 3.55 -0.06 Day 56 30 1.48 -0.52 Day 56 27,700 4.44 -0.14
5C24C22C2 Contrast Dose Average SE p.value
Timepoint c/ml log10 log10 Timepoint c/ml log10 log10 Timepoint c/ml log10 log10 Screen - Day 0 10mg/kg 0.415 0.316 0.189
Screen 20 1.30 - Screen 2,510 3.41 - Screen 19,970 4.30 - Day -7 - Day 0 10mg/kg 0.098 0.244 0.687
Pre 30 1.48 - Pre 1,100 3.04 - Pre 10,860 4.04 - Day 1 - Day 0 10mg/kg -0.159 0.244 0.516
Day 0 30 1.48 0.00 Day 0 820 2.91 0.00 Day 0 9,260 3.97 0.00 Day 4 - Day 0 10mg/kg -0.260 0.316 0.410
Day 1 60 1.78 0.30 Day 1 690 2.84 -0.07 Day 1 5,300 3.72 -0.25 Day 7 - Day 0 10mg/kg -0.636 0.356 0.074
Day 4 50 1.70 0.22 Day 4 980 2.99 0.08 Day 4 2,340 3.37 -0.60 Day 14 - Day 0 10mg/kg -0.503 0.380 0.186
Day 7 9 0.96 -0.52 Day 7 990 3.00 0.09 Day 7 410 2.61 -1.36 Day 21 - Day 0 10mg/kg 0.111 0.396 0.780
Day 14 6 0.79 -0.69 Day 14 700 2.85 -0.06 Day 14 1,070 3.03 -0.94 Day 28 - Day 0 10mg/kg -0.075 0.406 0.854
Day 21 20 1.30 -0.18 Day 21 1,420 3.15 0.24 Day 21 8,900 3.95 -0.02 Day 42 - Day 0 10mg/kg 0.102 0.412 0.804
Day 28 2 0.23 -1.25 Day 28 630 2.80 -0.11 Day 28 8,550 3.93 -0.04 Day 56 - Day 0 10mg/kg 0.101 0.416 0.809
Day 42 3 0.45 -1.03 Day 42 980 2.99 0.08 Day 42 12,410 4.09 0.12
Day 56 21 1.32 -0.16 Day 56 940 2.97 0.06 Day 56 12,840 4.11 0.14
3D21C21D2 Contrast Dose Average SE p.value
Timepoint c/ml log10 log10 Timepoint c/ml log10 log10 Timepoint c/ml log10 log10 Screen - Day 0 30mg/kg -0.084 0.158 0.593
Screen 5,730 3.76 - Screen 31,870 4.50 - Screen 3,620 3.56 - Day -7 - Day 0 30mg/kg 0.022 0.122 0.860
Pre 34,840 4.54 - Pre 31,870 4.50 - Pre 3,280 3.52 - Day 1 - Day 0 30mg/kg 0.065 0.122 0.593
Day 0 53,470 4.73 0.00 Day 0 47,650 4.68 0.00 Day 0 640 2.81 0.00 Day 4 - Day 0 30mg/kg -0.458 0.158 0.004
Day 1 84,450 4.93 0.20 Day 1 46,040 4.66 -0.02 Day 1 450 2.65 -0.16 Day 7 - Day 0 30mg/kg -1.043 0.178 < 0.001
Day 4 36,140 4.56 -0.17 Day 4 7,790 3.89 -0.79 Day 4 210 2.32 -0.49 Day 14 - Day 0 30mg/kg -1.181 0.190 < 0.001
Day 7 5,980 3.78 -0.95 Day 7 7,470 3.87 -0.81 Day 7 80 1.90 -0.91 Day 21 - Day 0 30mg/kg -0.866 0.198 < 0.001
Day 14 4,830 3.68 -1.05 Day 14 19,360 4.29 -0.39 Day 14 50 1.70 -1.11 Day 28 - Day 0 30mg/kg -0.515 0.203 0.011
Day 21 15,180 4.18 -0.55 Day 21 30,380 4.48 -0.20 Day 21 3 0.52 -1.77 Day 42 - Day 0 30mg/kg -0.339 0.206 0.099
Day 28 10,960 4.04 -0.69 Day 28 25,610 4.41 -0.27 Day 28 40 1.60 -1.21 Day 56 - Day 0 30mg/kg -0.371 0.213 0.081
Day 42 7,650 3.88 -0.85 Day 42 22,830 4.36 -0.32 Day 42 50 1.70 -1.11
Day 56 9,820 3.99 -0.74 Day 56 32,310 4.51 -0.17 Day 56 11 1.04 -1.77
3E22E21E2
Timepoint c/ml log10 log10 Timepoint c/ml log10 log10 Timepoint c/ml log10 log10
Screen 8,742 3.94 - Screen 3,394 3.53 - Screen 23,168 4.36 -
Pre 12,031 4.08 - Pre 1,802 3.26 - Pre 30,570 4.49 -
Day 0 15,780 4.20 0.00 Day 0 6,990 3.84 0.00 Day 0 22,030 4.34 0.00
Day 1 14,790 4.17 -0.03 Day 1 6,450 3.81 -0.03 Day 1 38,620 4.59 0.25
Day 4 3,560 3.55 -0.65 Day 4 2,340 3.37 -0.47 Day 4 10,540 4.02 -0.32
Day 7 404 2.61 -1.59 Day 7 1,663 3.22 -0.62 Day 7 1,308 3.12 -1.22
Day 14 468 2.67 -1.53 Day 14 253 2.40 -1.44 Day 14 3,901 3.59 -0.75
Day 21 8,557 3.93 -0.27 Day 21 917 2.96 -0.88 Day 21 23,717 4.38 0.04
Day 28 8,159 3.91 -0.29 Day 28 4,273 3.63 -0.21 Day 28 33,370 4.52 0.18
Day 42 6,671 3.82 -0.38 Day 42 15,721 4.20 0.36 Day 42 22,699 4.36 0.01
Day 56 13,486 4.13 -0.07 Day 56 3,465 3.54 -0.30 Day 56 27,998 4.45 0.10
5E24E2
Timepoint c/ml log10 log10 Timepoint c/ml log10 log10
Screen 45,311 4.66 - Screen 4,720 3.67 -
Pre 66,889 4.83 - Pre 4,244 3.63 -
Day 0 32220 4.51 0.00 Day 0 3610 3.56 0.00
Day 1 44980 4.65 0.14 Day 1 5300 3.72 0.16
Day 4 19,290 4.29 -0.22 Day 4 1,000 3.00 -0.56
Day 7 3,642 3.56 -0.95 Day 7 181 2.26 -1.30
Day 14 983 2.99 -1.52 Day 14 77 1.89 -1.67
Day 21 5,726 3.76 -0.75 Day 21 11 1.04 -2.52
Day 28 18,005 4.26 -0.25 Day 28 148 2.17 -1.39
Day 42 40,079 4.60 0.09 Day 42 1,064 3.03 -0.53
Day 56 22,100 4.34 -0.16 Day 56 589 2.77 -0.79
leveLANR1-VIHleveLANR1-VIHleveLANR1-VIH
30mg/kg30mg/kg
leveLANR1-VIHleveLANR1-VIHleveLANR1-VIH
30mg/kg
leveLANR1-VIHleveLANR1-VIH
1mg/kg3mg/kg
leveLANR1-VIHleveLANR1-VIHleveLANR1-VIH
leveLANR1-VIHleveLANR1-VIHleveLANR1-VIH
10mg/kg
leveLANR1-VIHleveLANR1-VIHleveLANR1-VIH
30mg/kg10mg/kg3mg/kg1mg/kg
a, HIV-1 RNA levels. Subjects 2B2 and 2C2 were on ART. Subject 2D3 started ART after day 42. Screen was performed between day 249 and day 214. Viraemia measurements at “Pre” were performed between
day 242 and day 22. b, Viral decay mixed-effect linear model.
G2015 Macmillan Publishers Limited. All rights reserved
RESEARCH LETTER
15. Extended Data Table 3 | Sensitivity of autologous virus isolates and cloned HIV-1 envelopes to 3BNC117
Dose ID
Day post
infusion
3BNC117
IC50 ( g/ml) 3BNC117 IC50
Clone
Cloning
procedure
Vector
backbone
3BNC117
(IC50; g/ml)
Average
(geo. mean)
Day 0 ND
Day 28 0.90
Day 0 0.11
Day 28 3.78
Day 0 0.07
Day 28 0.94
Day 0 0.77
Day 28 >20
Day 0 >20
Day 28 ND
Day 0 0.20
Day 28 0.30
Day 0 0.49
Day 56 0.03
Day 0 >20
Day 28 >20
2C5_D0_12 gp120 pSVIII 0.015
2C5_D0_21 gp120 pSVIII 0.017
2C5_D0_27 gp120 pSVIII 0.017
2C5_W4_59 gp120 pSVIII 11.543
2C5_W4_22 gp120 pSVIII 6.737
2C5_W4_27 gp120 pSVIII 7.514
2C5_W4_28 gp120 pSVIII 3.495
2C5_W4_34 gp120 pSVIII 8.758
2C1_D0_12 gp120 pSVIII 0.209
2C1_D0_22 gp120 pSVIII 0.158
2C1_D0_32 gp120 pSVIII 0.006
2C1_W4_12 gp120 pSVIII 0.043
2C1_W4_18 gp120 pSVIII 0.225
2C1_W4_31 gp120 pSVIII 0.262
2D1_D0_D5 gp160 pcDNA3.1 0.165
2D1_D0_B3.1 gp160 pcDNA3.1 0.128
2D1_D0_B10 gp160 pcDNA3.1 0.172
2D1_W4_37 gp120 pSVIII 0.578
2D1_W4_40 gp120 pSVIII 0.501
2D1_W4_69 gp120 pSVIII 0.465
2D1_W4_71 gp120 pSVIII 0.523
Day 0 0.13
Day 28 0.35
2E1_D0_12 gp160 pcDNA3.1 0.103
2E1_D0_20 gp160 pcDNA3.1 0.115
2E1_D0_34 gp160 pcDNA3.1 0.068
2E1_W4_23 gp160 pcDNA3.1 0.041
2E1_W4_E1 gp160 pcDNA3.1 0.590
2E1_W4_F6 gp160 pcDNA3.1 0.496
2E2_D0_A10 gp160 pcDNA3.1 0.017
2E2_D0_C3 gp160 pcDNA3.1 0.010
2E2_D0_E9 gp160 pcDNA3.1 0.018
2E2_W4_B9 gp160 pcDNA3.1 0.017
2E2_W4_C11 gp160 pcDNA3.1 0.020
2E2_W4_D5 gp160 pcDNA3.1 0.057
Screen 0.18
Day 28 1.10
Screen 0.24
Day 28 ND
Screen 0.30
Day 28 ND
Autologous virus isolates
ND
ND
15.36
167.0
7.09
0.54
1.78
0.18
2.23
0.06
0.02
1.8
0.14
0.09
0.90
Day 0
Day 28
Day 0
2D1
Day 28
Day -7
2C5
2C1
ND
Day 28
2E1
0.68
Day 28
ND
1.5
0.1
No change
ND
ND
ND
ND
ND
0.15
12.3
0.01
0.03
ND
0.09
0.23
1mg/kg3mg/kg
2B1
2B2
2B3
2A1
10mg/kg
2E4 ND
2E5 ND
30mg/kg
2E3
2.7
6.1
ND
0.40Screen
Day 28
Screen
2E2
HIV-1 envelopes cloned from plasma
2C2
2C4
2D3
2A3
2A4
ND
35.3
13.5
25.9
ND
ND
ND
ND
1.3
0.52
ND, not determined.
G2015 Macmillan Publishers Limited. All rights reserved
LETTER RESEARCH