Reflection Essay Introduction. 002 Reflection Essay Example Best Ideas Of Int...
masters thesis
1. WHEN THE MAJORITY BECOMES THE MINORITY:
CHANGING DEMOGRAPHICS AS SOCIAL IDENTITY THREAT FOR WHITES AND
IMPLICATIONS FOR PREJUDICE AND DISCRIMINATION
By
Rachel C. O’Connor
A THESIS
Submitted to
Michigan State University
in partial fulfillment of the requirements
for the degree of
Psychology – Master of Arts
2013
3. ABSTRACT
WHEN THE MAJORITY BECOMES THE MINORITY:
CHANGING DEMOGRAPHICS AS SOCIAL IDENTITY THREAT FOR WHITES AND
IMPLICATIONS FOR PREJUDICE AND DISCRIMINATION
By
Rachel C. O’Connor
U.S. Census Bureau projections indicate that by the year 2024 the number of people who identify
as non-White (including Black, Hispanic, Asian, Native American, and mixed race individuals)
is expected to reach 54%. That is, groups that are currently considered racial minorities will
make up the numerical majority of the population. The numerical size of a group is related to its
perceived power and social status. Thus, the projected demographic changes may signal to
Whites that their power and social status are in jeopardy. The current research uses Social
Identity Theory and Intergroup Threat Theory to explain why Whites may react negatively to the
impending demographic changes and extend research on attitudinal reactions by investigating
potential negative intergroup behavior responses. Results indicated that reading about
demographic changes did not significantly increase Whites’ feelings of threat, and that self-
esteem did not mediate relationships between threat condition, experienced threat, and
discriminatory backlash behaviors. Implications of these findings are discussed. However, to the
extent that Whites did feel threatened they engaged in more discriminatory backlash, and specific
appraisals of the type of threat that the changes represented were associated with discrete
emotional experiences. Results are discussed with respect to proposed functions of intergroup
emotion.
4. iii
ACKNOWLEDGEMENTS
I owe great gratitude to the many people who have helped me, academically and
otherwise, to reach this important academic milestone. First, I would like to thank my committee
chair and academic advisor, Isis Settles, for all the guidance, knowledge, and support she has
provided me over the course of this project and my graduate career thus far. I would also like to
thank the other members of my committee, Joseph Cesario and Zaje Harrell, for their insightful
comments and suggestions throughout the development of this thesis. Next, I owe everything I
have accomplished in my life thus far, including this thesis, to my wonderful and always loving
and supportive parents, Matthew and Teresa O’Connor, who have always encouraged and
enabled me to achieve whatever goals I have set for myself. I would also like to thank the many
friends and family who have cheered me through the ups and commiserated with me through the
downs of the thesis processWhen . I would also like to thank my research assistants for their help
with data collection on this project: Shelby Levine, Rebecca Sternberg, and Diana Emerson.
5. iv
TABLE OF CONTENTS
LIST OF TABLES.................................................................................................................vii
LIST OF FIGURES ...............................................................................................................ix
Introduction............................................................................................................................1
Group Size vs. Power.......................................................................................................2
Prejudice ..........................................................................................................................3
Social Identity Theory......................................................................................................4
Social Identity Theory and Prejudice...............................................................................6
Intergroup Threat .............................................................................................................8
Reactions to Intergroup Threat ........................................................................................10
Emotional reactions to intergroup threat........................................................10
Self-Esteem responses to intergroup threat....................................................10
Outgroup attitudes in response to intergroup threat.......................................11
Behavioral responses to intergroup threat......................................................12
Moderators of Reactions to Intergroup Threat.................................................................14
Identification..................................................................................................14
Status..............................................................................................................14
Legitimacy .....................................................................................................15
Whites’ Reactions to Changing Demographics ...............................................................16
Whites’ Intergroup Threat................................................................................................21
Implicit Identity Threat....................................................................................................22
The Current Study............................................................................................................24
Hypotheses.............................................................................................................................32
Primary.............................................................................................................................32
Secondary.........................................................................................................................36
Method...................................................................................................................................37
Participants.......................................................................................................................37
Procedure .........................................................................................................................37
Measures ..........................................................................................................................41
Individual difference measures in pre-survey............................................................41
Egalitarian ideals............................................................................................41
Status-legitimizing beliefs .............................................................................42
Racial centrality .............................................................................................44
Motivation to respond without prejudice.......................................................44
Manipulation check and cover story filler questions .................................................44
Dependent measures ..................................................................................................45
Implicit threat.................................................................................................45
Intergroup affect.............................................................................................46
Evaluation of changes....................................................................................47
7. vi
Appendix E ................................................................................................................139
Appendix F.................................................................................................................140
Appendix G................................................................................................................142
Appendix H................................................................................................................143
Appendix I .................................................................................................................144
Appendix J .................................................................................................................145
Appendix K................................................................................................................146
Appendix L ................................................................................................................148
Appendix M ...............................................................................................................151
Appendix N................................................................................................................152
Appendix O................................................................................................................154
Appendix P.................................................................................................................156
Appendix Q................................................................................................................159
Appendix R................................................................................................................160
Appendix S.................................................................................................................161
Appendix T ................................................................................................................165
Appendix U................................................................................................................170
REFERENCES ......................................................................................................................171
8. vii
LIST OF TABLES
Table 1. Means, Standard Deviations, and Sample Differences for Demographic Variables
........................................................................................................................................... 55
Table 2. Means, Standard Deviations, Alphas, and Sample Differences for all Main Study
Variables .................................................................................................................56
Table 3. Correlations between Main Study Variables and Demographic Variables ............58
Table 4. Means and Standard Deviations for Threat Variables as a Function of Threat
Condition.......................................................................................................................... 60
Table 5. Means and Standard Deviations for Threat Variables as a Function of U.S. Condition
.................................................................................................................................63
Table 6. Regression Results Predicting Threat with Threat Condition, Racial Centrality, and the
Interaction ...............................................................................................................66
Table 7. Regression Results Predicting Threat with Threat Condition, Status-Legitimization, and
the Interaction .........................................................................................................72
Table 8. Regression Results Predicting Threat with Threat Condition, MRWP, and the
Interaction ...............................................................................................................78
Table 9. Means and Standard Deviations for Applicant Rating Differentials as a Function of
Threat Condition.....................................................................................................83
Table 10.Regression Results Predicting Self-Esteem at Time 2 with Overall Job Differential
Ratings ....................................................................................................................85
Table 11. Regression Results Predicting Applicant Rating Differential with Overall Explicit
Threat and Total Implicit Threat.............................................................................86
Table 12. Means and Standard Deviations for Job Applicant Rating Differentials by Group
.................................................................................................................................92
Table 13. Regression Results Predicting Intergroup Threat with Intergroup Affect.............97
Table 14. Regression Results Predicting Applicant Rating Differentials with Realistic Threat,
Symbolic Threat, and Intergroup Anxiety ..............................................................99
Table 15. Regression Results Predicting Applicant Rating Differentials with Intergroup Affect
.................................................................................................................................101
9. viii
Table 16. Implicit Threat Words............................................................................................151
10. ix
LIST OF FIGURES
Figure 1. Model of Hypothesis 2 ....................................................................................26
Figure 2. Model of Hypothesis 1 ....................................................................................27
Figure 3. Model of Hypotheses 3 and 4..........................................................................28
Figure 4. Model of Hypotheses 5 and 6..........................................................................29
Figure 5. Model of Hypothesis 7 ....................................................................................30
Figure 6. Model of Hypotheses 8 and 9..........................................................................31
Figure 7. Mediating Role of Self-Esteem at Time 1 in the Relation between Threat Condition
and Job Applicant Rating Differential.............................................................84
Figure 8. Mediating Role of Self-Esteem at Time 1 in the Relation between Overall Explicit
Threat and Job Applicant Rating Differential Moderated by Egalitarian Beliefs
.........................................................................................................................89
Figure 9. Simple Slopes for Overall Explicit Threat Predicting Overall Job Applicant Rating
Differential at High and Low Egalitarian Beliefs in the HPR Sample............90
Figure 10. Simple Slopes for Self-Esteem at Time 1 Predicting Overall Job Applicant Rating
Differential at High and Low Egalitarian Beliefs in the Mturk Sample .........91
Figure 11. Mediating Role of Self-Esteem at Time 1 in the Relation between Implicit Threat
and Job Applicant Rating Differential Moderated by Egalitarian Beliefs ......92
Figure 12. Mediating Role of Self-Esteem at Time 1 in the Relation between Overall Explicit
threat and Job Applicant Rating Differentials for Each of the Three Racism Groups
.........................................................................................................................94
Figure 13. Mediating Role of Self-Esteem at Time 1 in the Relation between Total Implicit
threat and Job Applicant Rating Differentials for Each of the Three Racism Groups
.........................................................................................................................95
Figure 14. U.S. Control Condition Manipulation ............................................................127
Figure 15. U.S. Threat Condition Manipulation..............................................................128
Figure 16. Eritrea Control Condition Manipulation ........................................................129
11. x
Figure 17. Eritrea Threat Condition Manipulation ..........................................................130
Figure 18. White Applicant..............................................................................................133
Figure 19. Black Applicant..............................................................................................136
12. 1
Introduction
U.S. Census Bureau projections indicate that by the year 2042, the majority will become
the minority (U.S. Census Bureau, 2008). That is, the proportion of the population that identifies
as an ethnic minority is steadily increasing and will soon be greater than the number of people
who currently identify as White. The number of people who identify as non-White (including
Black, Hispanic, Asian, Native American, and mixed race individuals) is expected to reach 54%
by the middle of the 21
st
century. The number of minority children has already reached 44% of
the total population of American children. These demographic changes present a unique
opportunity to examine the dynamics of race, power, and privilege. How will White Americans
respond to the change in their numerical majority? Does a loss of numerical dominance trigger
perceptions of loss of power and privilege? If so, what impact do those perceptions have on
intergroup relations? Will White people attempt to reassert their social status through intergroup
hostility? In the current study, I explore how White people react to the projected increase in the
proportion of non-White Americans. Using a Social Identity Theory framework (Tajfel & Tuner,
1986), I examine how White American’s feelings of identity threat in response to the
demographic changes may manifest in prejudice toward racial minority group members.
First, I discuss research on the relationship between numerical group size and perceptions
of power. Next, I introduce Social Identity Theory to explain how membership in important
groups can impact a person’s self-concept. I also introduce Intergroup Threat Theory to describe
how people perceive and react to threats to important groups, the impact group threats have on
intergroup relations, and how certain reactions can help maintain a positive self-concept. Finally,
I directly relate the above research to the projected demographic changes and explain how Social
13. 2
Identity Theory and Intergroup Threat Theory can be used to predict Whites’ reactions to the
changes.
Group Size vs. Power
Majority status, including the privileges and power that go with it, requires more than
sheer numbers. Vescio, Gervais, Heiphetz, and Bloodhart (2009) define power as “the ability to
influence other people in psychologically meaningful ways through the giving or withholding of
rewards and punishments” (p. 248). This definition of power allows broad interpretations of what
constitutes reward and punishment, as well as forms of influence. Specifically, Vescio et al.
define four forms of power: legitimate power, which comes from holding a position of authority;
reward power, which comes from control over the distribution and withholding of rewards;
punishment (or coercive) power, which comes from control over the withholding or
administering of punishments; and information power, which comes from possession of
necessary or desired information. Examination of these four types of power illustrate that,
although they may tend to be held by groups who have a numerical majority, none of them
necessarily require a numerical majority. There are many cases throughout history, such as
apartheid in South Africa, wherein a powerful numerical minority group has maintained a
position of status and privilege over a numerically larger group.
Despite these counterexamples, research has shown that numerical size and perceptions
of power and status are often psychologically linked (Blalock, 1967; Bobo, 1983; Kamans,
Otten, & Gordijn, 2011). Larger groups are perceived to have more economic, social, and
political power (Blumer, 1999; Frankenberg, 2001). For Whites living in the United States, their
higher social status and numerical majority until recently have been aligned. Changes in this
racial balance may lead to new sources of intergroup conflict. Previous research suggests that
14. 3
when people perceive that their group’s proportion of the population is decreasing (Gallagher,
2003; Nadeau, Niemi, & Levine, 1993) or that an ethnic outgroup population is increasing
(Oliver & Wong, 2003; Quillan, 1995; Schuleuter & Scheepers, 2010; Taylor, 1998) they report
feeling threatened and that their economic, political, and cultural status is vulnerable. Although
research has shown that proportional racial group changes inspire feelings of threat, perceptions
that minority group’s power is increasing, and negative emotional reactions in Whites (Outten,
Schmitt, Miller, & Garcia, 2012), this research has neglected the impact that these feelings of
threat and negative reactions have on intergroup relations. My research seeks to examine the
effect that White individuals’ awareness of the demographic changes has on their expressions of
prejudice and discrimination toward racial minorities.
Prejudice
When people feel threatened by an outgroup, they often respond with prejudice and
discrimination toward that outgroup. Allport (1954) defined prejudice as “antipathy based upon a
faulty and inflexible generalization. It may be felt or expressed. It may be directed toward a
group as a whole, or toward an individual because he is a member of that group” (pg. 9). Thus,
prejudice is any attitude, belief, or emotion toward others that is formed without previous
knowledge or individualizing information and is based solely on an individual’s membership in a
social group. Although Allport acknowledged that prejudice can as reasonably encompass
positive perceptions about a group as negative perceptions, he argued that most prejudice of
interest to psychologists involves negative attitudes and beliefs about a particular social group.
Prejudice is usually distinguished from discrimination in that discrimination is the behavioral
manifestation of prejudice and involves treating members of different social groups differently,
and often unequally, based on their membership in a social group. Stereotypes, another related
15. 4
concept, are defined as “a set of beliefs about the personal attributes of a social group” (Ashmore
& Del Boca, 1981, p. 21). Stereotypes describe attributes or characteristics that people are
assumed to have because of their membership in a particular social group. Although the accuracy
and rationality of stereotypes has been debated (see Jussim, Cain, Crawford, Harber, & Cohen,
2009), they are often implicated alongside prejudice as culprits for intergroup conflict,
discrimination, and negative treatment of minority group members. Social identity processes
have been employed to understand prejudice, discrimination, and stereotypes.
Social Identity Theory
Social Identity Theory has arguably been one of the most influential and generative
theories of intergroup attitudes, beliefs, and behavior (Tajfel & Tuner, 1986). Tajfel defined a
social identity as “the individual’s knowledge that he belongs to certain social groups together
with some emotion and value significance to him of this group membership” (Tajfel, 1972, p.
292). In other words, social identities are aspects of the self-concept that are derived from one’s
membership in important social groups. This is in contrast to, for example, self-concept
components that are based on an individual’s unique idiosyncratic attributes (i.e., personal
identity) or that derive from important dyadic relationships with significant others (i.e., relational
identity; Brewer & Gardner, 1996).
Categorization processes are integral in social identification. Perceptions of the social
groups that a person belongs to affect both the individual’s self-concept and how other’s view
that person (Turner, 1999). People frequently and effortlessly categorize themselves and others
into social groups and, at any given time, an individual can be categorized into a multitude of
groups and hold a multitude of identities (Turner, Oakes, Haslam, & McGarty, 1994). Which
identities are more important or salient at any moment depend on features of the immediate
16. 5
social context. Oakes (1987) argued that identities become more or less psychologically salient
depending on both their accessibility and fit with the situation. Accessiblity describes how easily
a particular identity comes to mind. Identitites can be accessible because they are more
chronically acessible in memory (e.g., because one often thinks of themsevles in terms of their
race it easily comes to mind when they describe who they are) or because there are strong
situational demands that make the identity particularly salient and relevant (e.g., because one is
the only Black person in a room full of White people). However, even if an identity is accessible,
its influence on a person’s attitudes and behavior further depends on the fit of the identity with
the particular situation. An identity has structural fit when it adequately explains similarities and
differences between people (e.g., race). That is, it reliably distinguishes between different types
of people. An identity has normative fit when its associated characteristics allow prediction and
explanation of a person’s behavior and attitudes. That is, knowing a person’s identity tells you
something more about the person (e.g., knowing that someone is Black means that you also
know they are more likely to have experienced racial discrimination). Although people belong to
many types of social groups, for many people race is a chronically salient category and
particularly important social identity (Frable, Blackstone, & Scherbaum, 1990).
The processes theorized to occur when one categorizes an individual as a member of a
social group can explain the role of stereotypes in person percpetion. First, categorization
involves comparisons to a prototype, or roughly-defined set of attributes (i.e., stereotypes) that
describe members of a particular group (Turner et al., 1994). This comparison causes a
depersonalization proccess wherein an individual is no longer perceived by their individual
attributes, but instead through comparison of the individual to the group prototype which is
comprised of stereotypes (Hogg, 2006). Thus, categorization leads one to see others in ways that
17. 6
are consistent with stereotypes of their social group. Second, it can also lead to self-stereotyping,
wherin the person views themselves in comparison to the group prototype. Finally, according to
the metacontrast principle, category-based person perception leads people to simultaneously
accentuate similarities of individuals within their ingroup and differences between their ingroup
and the outgroup (Hogg). Together, the social comparison processes involved in categorization
lead to perceiving others and oneself in stereotypical ways. Again, because race is a particularly
salient and important social identity, following the principles of Social Identity Theory, people
are often viewed in accordance with racial stereotypes and members of the same race are
perceived as more similar to each other and different from people of other races.
Social Identity Theory and Prejudice
One of Social Identity Theory’s central tenents is that phenomena that explicitly involve
the interplay of different social groups, such as discrimination and prejudice, must be understood
within a group framework. That is, it is not enough to study individual differences in levels of
prejudice or focus on individual-level explanations for intergroup conflict. Instead, these
phenomena must be examined by considering their role within the social context. Thus, Social
Identity Theory proposes that social identities are important because they satisfy certain needs
for the individual and that prejudice and discrimination occur because they help identities to
meet these needs.
There are three main functions of identification with social groups. First, identifying with
a group can serve a self-enchancement motive. Tajfel and Tuner (1986) argued that an
individual’s self-esteem and positive self-perceptions are, in part, derived from their social
identity. An individual can take on positive attributes of the group as part of their own-self
concept, thereby bolstering their postive self-image. Therefore, people strive to maintin positive
18. 7
social identities that will increase their personal self-esteem (Turner, 1982). For example, the
self-esteem hypothesis argues that people engage in outgroup derogation (i.e., evaluating the
outgroup negatively or expressing negative attitudes about the outgroup) because it can help to
reaffirm a positive self-image and restore collective self-esteem (Abrams & Hogg, 1988).
Second, social identities can help to reduce uncertainty about social interactions and the status of
the self within society. Social groups have particular group norms and expectations for group
members’ personal behavior and social interactions with others. When one identifies with a
social group, uncertainty is reduced because the group provides one with behavioral guidelines;
knowledge of the norms for outgroup members also allows one to predict outgroup members’
behavior (Hogg, 2000). Third, the principle of optimal distinctiveness argues that people seek
membership in groups that not only satisfy a need to belong, but also help to define the self and
distinguish the self from others (Brewer, 1991). Therefore, people seek to identify with social
groups that provide a balance between inclusion and uniqueness.
Prejudice and discrimination can help to satisfy each of these functions. Essentially,
people seek membership in groups that allow them to fufill each of these social identity motives
and engage in behaviors and hold attitudes that, although they may be prejudicial or
discriminatory, help to bolster the positive distinctiveness of their ingroup. Viewing others in
terms of narrowly-defined group stereotypes aids in uncertainty reduction by differentiating
ingroup and outgroup norms (Hogg, 2006). Furthermore, because the metacontrast principle
means that people overemphaize differences between ingroup and outgroup members,
stereotyping helps to satisfy optimal distinctiveness motives by exaggerating the perceived
uniqueness of a social identity (Brewer, 1991). By engaging in ingroup favoritism and holding
positive biases toward the ingroup, and also derogating members of the outgroup through
19. 8
expressions of prejudice and discrimination, achieving optimal distinctiveness also helps to fufill
self-enhancement motives (Brewer, 2003). Because these biases help to increase the perceived
positivity of an important social group, they also help to increase the part of an individual’s
personal self-esteem that is derived from their membership in that group (Brewer & Campbell,
1976; Tajfel & Turner, 1986). Due to these powerful personal benefits of social identities, people
often develop feelings of belongingness to important social groups and report greater
attachement to groups that fulfill self-enhancement, uncertainty reduction, and optimal
distintiveness motives (Sedikides & Strube, 1997). They are also vigilant for potential threats to
the postititivity, distinctiveness, or values of the group, as such threats decrease the positive
functions served by social identities.
Intergroup Threat
Social Identity Theory has spawned theories of intergroup conflict that focus on how and
what group members perceive as threats to the well-being of their group. It uniquely enables an
understanding of intergroup conflict that accounts for threats to not only the physical well-being
of a group’s members, but also to the positive distinctiveness of the group. Social Identity
Theory argues that outgroups can threaten the attitudes, beliefs, and identity of a group.
Specifically, because identified group members derive personal self-definition and self-esteem
from the group, actions that compromise defining aspects of the group, especially those that
threaten their positivity, are perceived as threats. Importantly, threats need not necessarily
directly impact the individual’s self-interest; threats to the group as a whole are viewed as
personally threatening (Bobo, 1983). A number of different types of identity and group related
threats have been proposed and are described below.
20. 9
One of the first theories of intergroup group threat, Realistic Group Conflict Theory
(Sherif & Sherif, 1969), focused on intergroup conflict that results from realistic threat, or
competition over scarce resources. Specifically, it proposed that negative intergroup relationships
will develop when two or more groups have competing goals. However, much intergroup
conflict does not involve resource competition. Symbolic racism (Kinder & Sears, 1981;
McConahay, 1982) was proposed to explain intergroup conflict that results from situations in
which the values or beliefs of two groups are perceived to be in direct contradiction. Under
symbolic identity threat, rather than perceiving the outgroup to be in direct competition with the
ingroup for resources or as a material threat to their physical safety, the individual believes that
the values of the outgroup are incompatible with the values of the ingroup and pose a threat to
the existing social fabric. Some evidence suggests that symbolic threat may be a better predictor
of discrimination than realistic group threat (Kinder & Sears) and can increase intergroup bias
(Biernat, Vescio, & Theno, 1996; Dunbar, Saiz, Stela, & Saez, 2000).
In their Intergroup Threat Theory, Stephan and Stephan (1996, 2000) proposed that there
are four major types of intergroup threat: realistic threat, symbolic threat, intergroup anxiety, and
negative stereotypes. All four types of threat are thought to contribute to negative outgroup
attitudes and may be elicited by the same outgroup. Realistic and symbolic threats are analogous
to the two previous conceptualizations of threat by the same names; however, intergroup anxiety
and negative stereotypes are novel additions proposed by Intergroup Threat Theory.
Intergroup anxiety involves discomfort in interracial interactions caused by the
uncertainty of how to behave toward a member of the outgroup (Stephan & Stephan, 1985). It is
considered a form of intergroup threat because it makes interactions with outgroup members
seem intimidating and leads to people avoiding intergroup contact. Furthermore, intergroup
21. 10
anxiety has been associated with increased feelings of hostility (Brown, Maras, Masser, Vivian,
& Hewstone, 2001; Plant & Devine, 2003). Lastly, negative stereotypes are considered a type of
threat because they lead to negative expectations of outgroup members. However, the association
between negative stereotypes and negative outgroup attitudes is less clear than for the other three
types of threat. Some have suggested that negative stereotypes may serve as a precursor to the
other four types of threat; that is, if a person holds negative stereotypes about an outgroup, they
are more likely to see members of that outgroup as sources of realistic, symbolic, or anxiety
threat (Stephan et al., 2002). Because of these problems associated with negative stereotypes, it
will not be considered further as a form of intergroup threat.
Reactions to Intergroup Threat
Emotional reactions to intergroup threat. Several researchers have theorized that
social identity threats are related to a variety of negative intergroup emotions. For example,
Intergroup Emotions Theory theorizes that anger and fear are common reactions when a group
feels that their power or social status is threatened (Mackie & Smith, 2002; Smith, 1993).
Neuberg and Cottrell’s (2002) biocultural model of threat differentiates specific emotional
reactions based on the specific type of threat that is perceived. Threats to the group’s resources,
such as in realistic group threat, primarily lead to anger and fear, whereas threats to the group’s
integrity, such as in symbolic threat, also lead to anger, but may also evoke pity, envy, and
disgust. Additionally, intergroup anxiety is thought to elicit worry-related emotions (Stephan and
Renfro, 2002).
Self-esteem responses to intergroup threat. All three types of threat (realistic,
symbolic, intergroup anxiety) have been found to have a negative relationship with self-esteem.
As stated earlier, Social Identity Theory posits that individuals derive positive feelings about
22. 11
themselves through their membership in important and socially-valued groups (Tajfel & Turner,
1979). Thus, threats that pertain to the perceived value, prestige, or status of a group also
threaten the self-image of individuals who identify with that group (Branscombe, Spears,
Ellemers, & Dooje, 1999). Social identity threats affect the potential for group members to
derive a positive self-image simply through association with a socially positively valued group.
That is, when the positive social perception of a group is threatened, the self-esteem that an
individual associates with that group is also threatened (Turner, 1982). For example, Frable,
Wortman, and Joseph (1997) found that gay men who perceived a lot of stigmatization based on
their social identity reported lower personal self-esteem. Similarly, Branscombe, Schmitt, and
Harvey (1999) found that African-Americans who attributed negative treatment to prejudice had
lower personal self-esteem. Other studies have demonstrated similar negative relationships
between threats to the positivity of one’s ingroup and collective self-esteem (Branscome, Spears,
Ellemers, & Doosje, 2002; Branscombe & Wann, 1994). McCoy and Major (2003) demonstrated
that attributions to prejudice were especially detrimental to personal self-esteem when a person
was highly identified with the relevant social group. When a person’s collective self-esteem is
lowered through identity threats, people may respond with outgroup derogation and
discrimination, particularly when disassociation with the ingroup is not possible (Branscombe &
Wan, 1994; Branscombe et al., 2002; Leach, Spears, Branscombe, & Doosje, 2003; Tajfel &
Turner, 1979).
Outgroup attitudes in response to intergroup threat. A common reaction to identity
threat is increased negative outgroup attitudes (Riek, Mania, & Gaertner, 2006; Stephan &
Stephan, 2000). These negative outgroup attitudes are directly related to the negative impact that
identity threats have on the positive distinctiveness of a group membership. As stated earlier, the
23. 12
self-esteem hypothesis argues that outgroup derogation is directly related to detriments in self-
esteem that result from threats to one’s social identity (Abrams & Hogg, 1988). Specifically, the
self-esteem hypothesis has two corollaries: 1) engaging in outgroup derogation can bolster
personal self-esteem, and 2) the negative impact that identity threats have on self-esteem
motivates increased intergroup bias in an effort to reaffirm a positive self-image (Abrams &
Hogg). So, when a person’s self-image is threatened through threats to a positive social identity,
the person may increase negative outgroup attitudes in an effort to reaffirm the self-esteem that
they derive through identification with that social group (Crocker, Thompson, McGraw, &
Ingerman, 1987; Maass, Cadinu, Guarnieri, & Grasselli, 2003). However, most research suggests
mixed results for the self-esteem hypothesis, with more support for corollary 2 than corollary 1
emerging (see Hogg & Sunderland, 1991; Rubin & Hewstone, 1998), suggesting that although
people may engage in outgroup derogation in hopes of reaffirming their self-esteem, these efforts
are not always successful. Bettencort, Charlton, Dorr, and Hume (2001) argue that compared to
low status group members, high status group members faced with identity threat may be even
more likely to show even greater ingroup favoritism in order to reaffirm their social status.
Behavioral responses to intergroup threat. When confronted with identity threats, high
status groups may engage in behaviors that not only reaffirm the positivity of their social group,
but may also be attempts to actually re-establish their social dominance. Rudman and Fairchild
(2004) developed a model of backlash wherein people who violate cultural stereotypes
experience negative social and economic sanctions from perceivers for violating normative
expectancies. Much of the early work on backlash centered around gender deviant behavior and
showed that, for example, when female job applicants display agentic traits or behaviors
(stereotypical and prescribed traits for men), or male job applicants display communal traits or
24. 13
behaviors (stereotypical and prescribed traits for women), they are less likely to be hired and
promoted and are penalized in evaluations (Eagly & Karau, 2002; Rudman & Phelan, 2008).
Phelan and Rudman (2010) demonstrated that backlash also occurs in response to racial
stereotypic inconsistent behavior. Furthermore, their results demonstrated the role of backlash in
maintaining the status quo. In their study, racial minorities received backlash for any stereotype
violations; however, White people received backlash only when the stereotype violation was not
status enhancing (i.e., they violated a positive stereotype about White people). The authors argue
that both types of racial backlash serve to enforce cultural stereotypes that help maintain status
hierarchies. In the study, backlash was used to punish both minority and majority group members
who dared to break prescriptive stereotypes, particularly when the stereotype violation threatened
Whites’ higher position in the racial hierarchy. Additionally, the threat of backlash restricted
people’s behavior out of fear of negative treatment and prevented actions that could potentially
threaten the racial hierarchy. Consistent with the self-enhancement motivations of Social Identity
Theory, backlash behaviors allow group members to maintain their self-esteem (Branscombe &
Wann, 1994; Spencer, Fein, Wolfe, Fong, & Duinn, 1998). Other researchers have argued that
self-esteem maintenance may be an especially important motivator for backlash behavior when
an outgroup’s behavior serves as a threat to the ingroup’s self-worth (Parks-Stamm, Heilman, &
Hearns, 2008; Tesser, 1988, 2000).
The specific behavioral reaction to an identity threat is dependent in part on perceptions
of the threat and, in turn, the experienced emotion. Neuberg and Cottrell (2002) argued that
realistic threats are more likely to initiate aggressive behaviors toward the outgroup, whereas
symbolic threats are more likely to initiate withdrawal or avoidance of the outgroup.
Additionally, Mackie, Devos, and Smith (2000) found that intergroup anger was associated with
25. 14
an inclination to aggress against the outgroup, whereas intergroup fear was associated with an
inclination to flee from the outgroup. Stephan and Stephan (2000) also argued that intergroup
anxiety and associated worry-related emotions led to behavioral tendencies to exclude members
of the outgroup or avoid interaction with outgroup members.
Moderators of Reactions to Intergroup Threat
Identification. There are several additional factors that may influence when social
identity threats will be felt more or less strongly. Identity threats may be more consequential
when the threatened identity is particularly important to the individual. Although categorization
may be sufficient for understanding how people view others, self-perception requires more than
simple categorization processes (Hogg, 2006). For a group membership to affect a person’s self-
concept, a person must identify with the group. When a person feels strongly attached to a group,
experiences belonging from their membership in that group, and incorporates aspects of the
group into their self-concept, the person is said to be highly identified with the group and the
group is important to the person (Sellers, Rowley, Chavous, Shelton, & Smith, 1997). The more
that a person identifies with a group, the more they are likely to perceive identity threats to that
group (Riek et al., 2006).
Status. The relative status of the groups in question is an important factor in determining
how much different types of identity threat will affect attitudes toward the outgroup and whether
it will lead to discriminatory behavior. Much of the research indicates that intergroup threat more
strongly predicts negative attitudes toward low status, rather than high status, outgroup members
(Riek et al., 2006). When a group is of higher relative status, they have more to lose. Humans are
loss averse, such that they are more sensitive to signals of losing something they already have
than to opportunities to gain something new (Kahneman & Tversky, 2000). Thus, lower status
26. 15
groups pose more of a threat to the status, resources, or value dominance that a high status group
may already have, such that perceived threat by lower status groups is more egregious than threat
from higher status groups.
Legitimacy. Perceptions of intergroup threat may also be moderated by perceived
legitimacy, or how much individuals view the status of their group as fair. Jetten, Schmitt,
Branscombe, Garza, and Mewse (2011) argue that when discrimination is perceived as
legitimate, individuals are more accepting of discrimination toward their ingroup, and endorse
status-legitimizing ideologies (i.e., believe that the current social system is good, fair, legitimate,
and desirable). That is, if a group believes that lesser treatment is justified, they are less likely to
fight against it and less likely to show the typical reactions to intergroup threat, such as increased
commitment to the group and increased collective action (Kay, Jost, Mandisodza, Sherman,
Petrocelli, & Johnson, 2007). A group may believe that their treatment is justified if they believe
that social hierarchies are based on real differences in the social value, abilities, and
contributions of different groups. Both implicit and explicit outgroup favoritism among low
status group members has been repeatedly demonstrated (see Jost, Banaji, & Nosek, 2004; Jost,
Pellham, & Carvallo, 2002). Additionally, low status group members often report lower
personal and collective self-esteem than high status group members (Jost & Thompson, 2000;
O’Brien & Major, 2005), indicating that low status group members sometimes believe that they
are less desirable or deserving than high status group members. There are strong motivations for
justifying the status quo even when it does not benefit the ingroup, including cognitive-
motivational needs that can be satisfied by system-justification (Allport, 1966; Crandall &
Beasley, 2001; Festinger, 1957; Hafer & Begue, 2005; Kruglanski, 2004; Langer, 1975; Lerner,
1980; Plaks, Grant & Dweck, 2005) and social pressure to maintain social stability (Kaiser,
27. 16
Dyrenforth, & Hagiwara, 2006). However, much of the work on legitimacy appraisals has
focused on when lower status groups accept their lower societal position. Little research has
looked at what happens when higher status groups believe that threats to their position of power
or privilege are threatened. It is possible that members of higher status groups may perceive their
higher status to be unfair or undeserved. If this is the case, they may be more accepting of
societal changes that would undermine that higher status and be less affected by threats to that
privileged social identity.
There are several cases in which higher status group members may perceive their higher
status to be illegitimate. Social Dominance Orientation (SDO) is one type of status-legitimizing
ideology; it reflects an individual difference in personal preference for social hierarchies and
group-based discrimination (Sidanius & Pratto, 2001). People who denounce social hierarchies
in general, may view a reduction in a high status group’s dominance more positively. For
example, people who are lower in social dominance orientation have more positive attitudes
toward programs and policies that reduce status disparities (Pratto, Sidanius, Stallworth, &
Malle, 1994).
Guilt is the emotional reaction people have when they believe their higher social status to
be illegitimate (Swim & Miller, 1999). When people are highly cognizant of historical and
institutional discriminatory practices of their high status group toward lower status groups, they
may feel guilt about their higher social position. People who feel guilt may be more accepting of
actions or policies that would lessen the status differential between groups (Swim & Miller).
Whites’ Reactions to Changing Demographics
It is possible that the projected demographic changes represent a threat to Whites’ racial
social identity and signify a potential loss in their higher social status. The previous research on
28. 17
Social Identity Theory and Intergroup Threat Theory and their relationship to prejudice can be
applied to understanding Whites’ potential reactions to the changing demographics. Previous
research shows that Whites have negative reactions to similar situations that also signify
potential threats to their social group and higher social status. For example, the demographic
changes mean that U.S. society is becoming more diverse and multicultural. Despite evidence
that Whites are becoming more tolerant and racist attitudes are declining (Schuman et al., 1997),
research suggests that calls for diversity and multiculturalism are not always perceived positively
by majority group members. Using an implicit association test (IAT), Plaut, Garnett, Buffardi,
and Sanchez-Burks (2011) found that Whites had stronger associations between multiculturalism
and exclusion and weaker associations between multiculturalism and the self. Furthermore, these
associations predicted their support for diversity efforts in the workplace. These results indicate
that White people may not perceive themselves as included in efforts to increase
multiculturalism and diversity and may also explain, in part, why White people often express
lower support for efforts to increase diversity.
Whereas Plaut et al. (2011) investigated Whites reactions to efforts at increasing
appreciation of and support of diversity, Outten et al. (2012) investigated Whites’ reactions to
actual increases in numerical diversity. They reported that presenting White participants with the
possibility of a future White minority (vs. future White majority) produced strong emotional
reactions, including anger toward and fear of ethnic minorities and sympathy for Whites. The
White participants also expressed stronger ethnic identification with their White ingroup and less
liking of the minority outgroup when White participants were told their group would be a
minority in the future (vs. White majority in the future).
29. 18
These feelings of exclusion from multiculturalism and diversity may partially stem from
an invisibility of whiteness. Historically, as the dominant group in U.S. society, White people
have not been conceptualized as racialized beings (Grover, 1997). Lipsitz (1998) described
whiteness as “the unmarked category which…never has to speak its name, never has to
acknowledge its role as an organizing principle in social and cultural relations” (p. 1). Often
White culture is conceptualized as synonymous with American culture (Jackson, 1999;
McKinney, 2008). In scholarly research, often Whiteness is taken for granted and treated as the
racial standard to which minority racial groups are compared (Gould, 1996; Guthrie, 2004). Due
to this invisibility and normalization of whiteness, White people are often unable to sufficiently
demonstrate an awareness or understanding of their own whiteness (Knowles & Marshburn,
2010), or describe White people as lacking a race or culture (Case, 2012; McKinney, 2008).
Although racial minority group members often have no choice but to confront how their race
impacts their life, White people are not forced to examine their own racial identities (Giroux,
1997). Thus, both sociohistorical and academic constructions of Whiteness may lead Whites to
feel excluded from growing racial diversity, because they feel that they do not have a race or
culture.
There is also evidence to suggest that White’s opposition to increased diversity stems
from an underlying feeling of threat. White people may perceive increasing diversity as a threat
to their racial power and privilege. For example, in the previously discussed Outten et al. (2012)
study, the relationships between reading about a future White minority and emotion, ethnic
identification, and outgroup liking were mediated by appraisal of intergroup threat. That is,
compared to participants who did not perceive intergroup threat, participants who perceived the
demographic changes as threatening to their White racial group experienced more intense
30. 19
emotional reactions, greater ethnic identification, and less outgroup liking. This indicates that
many participants interpreted their decreasing numerical advantage as indicating a potential
decrease in their relative group status as well.
This sentiment is also reflected in studies that examine White’s support for affirmative
action policies. Often, even while acknowledging past discrimination and expressing support for
equality, members of the dominant or advantaged group often oppose policies that aim to
provide reparation (Crosby, Iyer, Clayton, & Downing, 2003). Part of this apparent conflict in
ideals may be explained by how White people perceive affirmative action policies will affect the
interests of their ingroup. Protecting against the loss of advantages or privilege for their ingroup
may be valued more than providing reparation for past wrongs to the outgroup. For example,
Lowery, Unzueta, Knowles, and Goff (2006) found that support for affirmative action policies
was mediated by how Whites expected the policies to affect their White ingroup. Furthermore,
Whites’ support for affirmative action policies was related to their level of identification with
their White racial group only when policies were framed in terms of the potential losses for the
White ingroup; however, level of White racial identification was unrelated to affirmative action
support when the policy was framed in terms of the potential gains for the Black outgroup. Other
research suggests that the majority group often uses loss-framing when thinking about minority
progress, such that White people see minority gains as necessarily implying losses for their own
group (Eibach & Keegan, 2006). Furthermore, loss-aversion biases, wherein people give greater
psychological weight to things they have lost than things they have gained (Kahneman &
Tversky, 2000; Prislin, Limbert, & Bauer, 2000), can lead White people to overweigh privileges
they may have conceded and hence, perceive greater progress toward racial equality than that
pereceived by minority group members (Eibach & Keegan). Similarly, Norton and Sommers
31. 20
(2011) found that Whites perceive that there is now more anti-White bias than anti-Black bias.
They also observed a negative correlation between Whites’ perceptions of the prevalence of anti-
White bias and anti-Black bias over time, suggesting that Whites may perceive racism as a zero-
sum game.
Negative reactions to demographic changes may be amplified by an ignorance of the
privilege associated with a White identity. Many White people are often unaware of the social,
economic, and political advantages they are afforded through their racial membership (Crosby,
1997; Eibach & Keegan, 2006; McIntosh, 1988; Ostrander, 1984; Roediger, 1991). Other Whites
believe that their higher social status is natural or deserved through principles of meritocracy
(Hurtado & Stewart, 1997). Still others employ notions of egalistarianism and colorblind
ideology to argue that race is not an important factor in determining an individual’s success and
interpersonal treatment (Anics & Szymanski, 2001; Thompson & Neville, 1999).
When White people are confronted with their racial privilege they often have negative
reactions. For example, Branscombe, Schmitt, and Schiffhauer (2007) found increased racist
attiutdes in response to thinking about White privilege, particularly among those who had high
White racial identification. Further, framing racial inequaity as White privilege, as opposed to
anti-Black discrimination, leads to more feelings of guilt (Iyer, Leach, & Crosby, 2003; Swim &
Miller, 1999). Whites may prefer to frame racial inequality as anti-Black discrimination because
acknowledging White racial privilege undermines positive self-esteem derived from the belief
that they have earned their success and status (Lowery, Knowles, & Unzueta, 2007).
Furthermore, when opportunities are made more equal, thus reducing Whites’ racial privilege,
Whites often perceive that they are now being discriminated against (Johnson, 1980; Matheson,
Warren, Foster, & Painter, 2000; Flores & Rodriguez, 2006).
32. 21
Whites’ Intergroup Threat
For White people, the impending demographic changes may be perceived as a threat to
the positive distinctiveness of their White racial group. The demographic changes may signal any
one of the three main types of threat (realistic, symbolic, intergroup anxiety) proposed by
Stephan and Stephan (1996). As racial minorities become more numerically dominant, White
people may fear realistic threat -- that racial minorities will take more of the resources, such as
jobs and political power, which have previously been reserved for White people. Furthermore, as
racial minority groups becomes more numerous, White people may fear symbolic threat -- that
the values and beliefs that they associate with their racial ingroup will become marginalized in
favor of the values and beliefs held by racial minority group members. Finally, a growing
number of racial minorities increases the probability of interracial interactions. Thus, White
people may feel threatened by the increasing potential of intergroup anxiety. These feelings of
threat are likely to generate negative intergroup emotions toward racial minority group members
and decrease White individuals’ sense of personal and collective self-esteem.
If White people perceive the demographic changes as indicating threats to the positive
distinctiveness of their group and have negative emotional and self-esteem reactions, they may
be motivated to engage in prejudicial attitudes and behaviors toward racial outgroups. As
discussed, one way to restore personal and collective self-esteem lost due to identity threat is to
engage in backlash toward the relevant outgroup (Rudman & Fairchild, 2004). Thus, if White
people feel that the demographic changes represent a threat to the positivity of their social
identity and their status in the social hierarchy, they may be motivated to enhance their collective
self-esteem and reinforce the status quo by penalizing racial minority group members when
given the opportunity.
33. 22
However, perceptions of identity threat may be moderated by the perceived legitimacy of
the demographic changes by White people and the degree to which they identify with being
white. In particular, the degree to which White people feel that their White identity is an
important part of their self-concept should moderate the relationship between the demographic
changes and feelings of threat. Additionally, when White people feel that their racial privilege
and higher social status is undeserved or illegitimate, they may be less likely to feel threatened
by the impending changes, and thus, respond less negatively. As Swim and Miller (1999)
demonstrated, many White people harbor feelings of guilt about past injustices toward Blacks
and other racial minorities by members of their race that may lessen how upset they are by
minority advances in society.
Implicit Identity Threat
Thus, the negative reactions that White people have to shifting demographics are likely
because they feel their identity is threatened. Since, they cannot leave their White social group,
they may express even greater negative attitudes toward racial minorities (Bettencourt et al.
(2001). However, in modern society, there are strong cultural taboos against racism and race-
based hierarchy. Blatant prejudice and discrimination are actively discouraged. Not only is it
taboo, but discrimination on the basis of race is against the law in many contexts. However,
many people still harbor negative sentiments about racial minorities. Gaertner and Dovidio
(1986) developed the concept of aversive racism to describe the ambivalence of people who
purport to endorse egalitarian ideals, but still harbor unacknowledged or hidden negative feelings
and beliefs about racial minorities.
This ambivalence manifests in discrepancy between implicit and explicit measures of
prejudice; often individuals show positivity or neutrality to racial minority groups on explicit
34. 23
measures, but show negative associations with racial minorities on implicit measures (Fazio &
Olson, 2003; Jost et al., 2002; Nosek, Banaji, & Greenwald, 2002; Rudman, Feinberg, &
Fairchild, 2002). Additionally, taboos against negative intergroup attitudes may obscure the
degree to which people are explicitly willing to admit that they feel threatened by an outgroup or
feel negative emotions toward an outgroup (Gonsalkorale, Carlisle, & von Hippel, 2007;
Rudman & Goodwin, 2004; Rudman, Ashmore, & Gary, 2001; Phelps et al., 2000). Dunton and
Fazio (1997) demonstrated individual differences in motivation to respond without prejudice, or
the degree to which individuals feel it is important to appear non-prejudice when responding on
scales about their racial attitudes. People who are prejudiced but who are also motivated to
respond without prejudice would not be expected to score highly on measures of explicit threat,
which is an easily controllable behavior, but would still express threat on implicit measures that
are less easily manipulated. Thus, it is important to measure White’s reactions to changing
demographics both explicitly and implicitly. If White people are reluctant to admit feeling
threatened by growing diversity, their negative attitudes may still emerge if threat is measured
implicitly.
Furthermore, implicit measures of prejudice are strong predictors of actual behavior,
sometimes even exceeding the predictive validity of explicit measures (Fazio & Olson, 2003).
Although aversive racists may publically sympathize with victims of racial injustice and express
support for policies that promote racial inequality and fight racism, their negative attitudes
toward racial minorities may emerge in situations where social norms for behavior are weak or
ambiguous or when there are nonracial factors to which discrimination can be attributed
(Gaertner & Dovidio, 1986). Therefore, implicit measures of threat may better predict when
identity threat is most likely to lead to negative intergroup behavior. White people who score
35. 24
highly on measures of implicit threat in reaction to changing demographics, regardless of their
level of explicit threat, may be more likely to engage in discriminatory behaviors.
Devine (1989) argued that differences in implicit and explicit expressions of prejudice
reflect automatic versus controlled prejudice processes. According to this model, people who
hold strong egalitarian beliefs and strive to be non-prejudiced engage in controlled processes to
inhibit the influence of automatically activated stereotypes and prejudices on outwardly
expressed attitudes and behavior. Thus, people who endorse egalitarian ideals may strive to
control initial prejudicial reactions to avoid engaging in discriminatory behavior. Two types of
egalitarian beliefs that may affect the degree to which initial levels of threat affect discriminatory
behavior include color-blind racial ideology which argues that race should not be a determinant
in how people are treated (Neville, Lilly, Duran, Lee, & Browne, 2000); and, blatant positive
attitudes toward minorities (Brigham, 1993).
The Current Study
In the current study, I sought to replicate and extend research by Outten et al. (2012) that
examines Whites reactions to impending demographic changes that will make Whites a
numerical minority. Outten et al. reported that after reading about demographic changes, White
people reported more negative intergroup emotions and that the relationship between reading
about the changes and negative affect was mediated by appraisals that the White ingroup was
threatened. However, in several pilot studies, I was unable to replicate these results. Specifically,
in my studies, White participants reported positive evaluations of and positive emotional
reactions to both a projected decrease in Whites’ numerical majority and a projected increase in
racial minorities’ numerical majority. I found the same results across a variety of contexts,
including corporate and college settings. Because of the previously discussed norms of
36. 25
egalitarianism and anti-racist taboos that pervade American society, I had reason to believe that
students may be reluctant to openly report their displeasure with the projected demographic
changes for fear of appearing racist (Gaertner & Dovidio, 1986). In the current study, I explored
the possibility that feelings of threat in response to the demographic changes will emerge when
threat is measured implicitly rather than explicitly. Thus, in the present study, after reading about
the impending demographic changes, participants completed both implicit and explicit measures
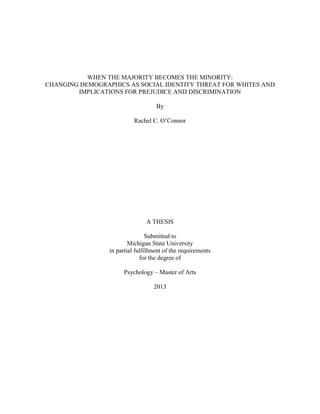
of intergroup threat and scores on each will be examined (see Figure 1).
Additionally, I sought to examine several important potential moderators of the
relationship between demographic changes and feelings of intergroup threat (see Figure 1).
Namely, I sought to examine the role of racial identification, status-legitimizing ideology, and
motivation to respond without prejudice on an individual’s feelings of threat. Several measures
of status-legitimizing ideologies were measured to examine the degree to which believing that
one’s racial privilege is illegitimate lessened the perceived threat of the demographic changes.
Participants’ motivation to respond without prejudice was also examined to determine the degree
to which participants were actively trying to control prejudiced reactions to the demographic
changes. Additionally, I measured the centrality (i.e., importance) of White people’s racial
identity to explore whether the impact of demographic changes was greater for those that report
their White identity to be a more core component of their self-concept.
37. 26
Figure 1. Model of hypothesis 2. Path labels represent the corresponding hypothesis and
predicted direction of the relationship.
To further clarify whether reactions to demographic changes in the United States reflect
threats to social identities or negative reactions to change in general, another set of conditions
was included. Specifically, some participants read about demographic changes (or lack of
changes) in Eritrea, a small African country (see Figure 2). Pilot studies indicated that this was a
country about which undergraduate students had little knowledge or familiarity. Inclusion of this
Control
Condition
Threat
Condition
Explicit
Threat
Implicit
Threat
Status-
Legitimizing
Ideology
Racial
Identification
+H1d
+ H1c
+ H1b
+ H1a
Motivation to
Respond w/o
Prejudice
-H1e
38. 27
condition allowed me to examine whether negative reactions to demographic changes were
specific to changes within a group of which the participants were a member (U.S.) or whether
they reflected general negativity toward changes in the status quo. The former explanation lends
greater support to Social Identity Theory explanations of intergroup threat.
Figure 2. Model of hypothesis 1. Path labels represent the corresponding hypothesis and
predicted direction of the relationship.
Additionally, I extended previous research on White’s reactions to demographic changes
by examining behavioral reactions to the demographic changes (see Figure 3). After reading
about the demographic changes, Whites were asked to evaluate job applications of equally
qualified White and Black candidates. Thus, Whites had the opportunity to engage in backlash
behavior by giving more negative evaluations to Black applicants than White applicants. I also
U.S.
Threat
Condition
Explicit
Threat
Implicit
Threat
+ H2b
+ H2a
Eritrea
Threat
Condition
39. 28
gave pre and posttest measures of self-esteem to examine whether self-esteem mediates the
relationship between threat and backlash behaviors. I also examined the ability of both implicit
and explicit identity threat to predict these backlash behaviors (see Figure 4). Additionally, as
Devine (1989) describes, people who endorse equality and pro-minority attitudes may control
initial negative intergroup attitudes to refrain from engaging in discriminatory behavior. To
investigate this possibility, measures of egalitarian beliefs were included to examine their
moderating role on discriminatory backlash behaviors.
Figure 3. Model of hypotheses 3 and 4. Path labels represent the corresponding hypothesis and
predicted direction of the relationship.
Threat
Condition
Backlash
Self-Esteem
Self-Esteem
Control
Condition
+ H3
- H4a
+ H4c
- H4b
40. 29
Figure 4. Model of hypotheses 5 and 6. Path labels represent the corresponding hypothesis and
predicted direction of the relationship.
Furthermore, I examined discrepancies between implicit and explicit measures of threat
by examining processes separately for people with different threat profiles (see Figure 5).
Participants were divided into three groups based on their scores on the implicit and explicit
measures of prejudice. Explicit racists were those who scored high on both types of measures
and true egalitarians were those who scored low on both types of measures. Aversive racists
scored highly on implicit measures of threat, but lowly on explicit measures. Specifically, I
sought to examine whether people who scored high on implicit measures of threat would be
more likely to engage in backlash than those who scored low, regardless of their level of explicit
threat. That is, I examined whether both explicit and aversive racists would be more likely to
engage in backlash than true egalitarians.
41. 30
Figure 5. Model of hypothesis 7. Path labels represent the corresponding hypothesis and
predicted direction of the relationship.
Finally, a secondary aim of the study was to more thoroughly explore the exact nature of
the intergroup threat felt by Whites (see Figure 6). Using Stephan and Stephan’s Intergroup
Threat framework (1996), I studied whether the demographic changes represented symbolic
threat, realistic threat, or intergroup anxiety for Whites. This distinction is important because
different types of threat are associated with different intergroup emotions and predict different
intergroup behaviors in response. Thus, I also measured several intergroup affect variables,
including anger, fear, worry, pity, envy, and disgust, and examined their relationship to the
specific type of threat perceived.
Backlash
Self-Esteem
Explicit
Racists
Aversive
Racists
True
Egalitarians
+ H7a
+ H7a
+ H7b
+ H7b
+ H7b
42. 31
Figure 6. Model of hypotheses 8 and 9. Path labels represent the corresponding hypothesis and
predicted direction of the relationship.
Threat
Condition
Realistic
Threat
Symbolic
Threat
Intergroup
Anxiety
Fear
Anger
Pity
Envy
Disgust
Worry
Backlash
+ H8a
+ H8b
+ H8c
+ H9a
+ H9a
+ H9a
+ H9b
+ H9b
+ H9b
43. 32
Hypotheses
Primary
1) Reading about demographic changes in the U.S., compared to demographic changes in
Eritrea, will result in more explicit and implicit threats to the social identity (see Figure
2).
a. On a word completion task used to assess implicit threat, participants who read
that Whites are projected to be the minority in the future in the United States
(U.S. threat condition) will show more implicit threat (i.e., provide a greater
percentage of social threat-related word-endings) than participants who read that
the Tigrinya ethnic group are projected to be the minority in the future in Eritrea
(Eritrea threat condition).
b. Participants who read about a future White minority in the U.S. (U.S. threat
condition) will show more explicit threat as measured by greater negative affect
and more negative explicit evaluations of the demographic projections than
participants who read about a future Tigrinya minority in Eritrea (Eritrea threat
condition).
2) The remaining hypotheses compare only the U.S. Conditions (U.S. threat and U.S.
Control). Reading about demographic changes (as opposed to no changes) will result in
explicit and implicit threats to the social identity (see Figure 1).
a. On a word completion task used to assess implicit threat, participants who read
that Whites are projected to be the minority in the future in the U.S. (U.S. threat
condition) will show more implicit threat (i.e., provide a greater percentage of
social threat-related word-endings) than participants who read that demographics
are expected to remain stable in the U.S. (U.S. control condition).
44. 33
b. Participants who read about a future White minority in the U.S. (U.S. threat
condition) will show more explicit threat as measured by greater negative affect
and more negative explicit evaluations of the demographic projections than
participants who read about no changes in ethnic diversity in the U.S. (U.S.
control condition).
c. The relationship between threat condition and both implicit and explicit threat
will be moderated by racial identification (i.e., the degree to which participants
consider race to be an important aspect of their identity), such that the relationship
between the threat condition and the experience of both implicit and explicit
threat will be stronger for those whose White racial identity is a more central
aspect of their identity.
d. The relationship between threat condition and both explicit and implicit threat
will be moderated by status-legitimizing ideologies (i.e., the degree to which
participants believe that their loss of power and privilege are legitimate), such that
the relationship between the threat condition and the experience of both implicit
and explicit threat will be stronger for those who have greater status-legitimacy
(as indicated by low white guilt, high diffuse system justification, and high social
dominance orientation).
e. The relationship between threat condition and explicit threat, but not implicit
threat, will be moderated by participant’s motivation to respond without
prejudice, such that participants who express a greater desire to express
egalitarian racial identities will report less explicit threat than those who report a
45. 34
lower motivation to respond without prejudice. However, motivation to respond
without prejudice will not affect participant’s implicit experience of threat.
3) Reading about demographic changes (as opposed to no changes) will lead to more
discriminatory backlash behaviors (i.e., rating of job applicants; see Figure 3). Those
participants who read about a future White minority (threat condition) will rate racial
minority candidates less positively than White candidates. Those participants who read
about no demographic changes (control condition) will rate racial minority candidates
and White candidates similarly.
4) The relationship between threat condition and job applicant ratings will be mediated by
collective and personal self-esteem (see Figure 3).
a. Participants in the threat condition will report less collective and personal self-
esteem than participants in the control condition.
b. Those with decreased collective and personal self-esteem will be more likely to
rate the minority job applicants lower than White job applicants.
c. Participants who do engage in backlash when given the chance to discriminate
(through ratings of the job applicants) will show greater collective and personal
self-esteem afterward.
5) Both implicit and explicit measures of identity threat will predict discriminatory backlash
behaviors (i.e., rating of job applicants; see Figure 4). Those who show more threat will
rate racial minority candidates more poorly than White candidates.
6) The relationship between implicit and explicit threat and job applicant ratings will be
mediated by collective and personal self-esteem (see Figure 4).
46. 35
a. Increased implicit and explicit threat will lead to decreased collective and
personal self-esteem.
b. Those with decreased collective and personal self-esteem will be more likely to
rate the minority job applicants lower than White job applicants.
c. Participant’s endorsement of egalitarian beliefs will moderate the relationship
between explicit threat and backlash behaviors and the relationship between self-
esteem and backlash behaviors. Participants who endorse egalitarian beliefs (as
indicated by high colorblind racial attitudes and positive attitudes toward
minorities) will show less discrepancy between ratings of Black and White job
applicants when they score higher on explicit measures of threat (intergroup affect
and evaluations of demographic changes) and decreased personal and collective
self-esteem than participants who do not endorse egalitarian beliefs.
7) The relationship between threat and discriminatory backlash behaviors will differ
depending on the congruency between participants’ implicit and explicit threat ratings
(see Figure 5).
a. Both explicit racists (i.e., those who score high on both measures of implicit and
explicit threat) and aversive racists (i.e., those who score high on measures of
implicit threat, but low on measures of explicit threat), will show more backlash
behavior than true egalitarians (i.e., those who score low on both measures of
implicit and explicit threat).
b. Personal and collective self-esteem will mediate the relationship between threat
and backlash behaviors (as outlined previously), for explicit racists and aversive
racists, but not true egalitarians.
47. 36
Secondary
8) The type of intergroup threat perceived will correspond to the type of intergroup affect
expressed (see Figure 6).
a. Perceptions of realistic threat will correspond to anger and fear.
b. Perceptions of symbolic threat will also correspond to anger, but additionally will
correspond to envy, pity, and disgust.
c. Intergroup anxiety will correspond to worry.
9) The type of intergroup threat perceived and type of intergroup affect expressed will
correspond to the likelihood of discriminatory backlash behaviors (see Figure 6).
a. Perceptions of realistic threat will be the strongest predictor (compared to
symbolic threat and intergroup anxiety) of job applicant ratings, such that
participants who perceive more realistic threat will show a greater difference
between minority and white job applicant ratings.
b. The emotional experience of anger will be the strongest predictor (compared to
other types of intergroup emotions) of job applicant ratings, such that participants
who experience more anger will show a greater difference between minority and
white job applicant ratings.
48. 37
Method
Participants
In total, 442 participants were included in the final analyses. Two-hundred and forty-one
of those participants were a community sample collected through Amazon’s Mechanical Turk
(Mturk) service. The other 201 participants were a student sample collected through the Human
Research Pool (HPR) at Michigan State University. Because I was interested in reactions to
threats to privilege, only White participants from the United States were recruited. Each
participant was randomly assigned to one of four demographic change conditions (U.S. control, n
= 94; U.S. threat, n = 99; Eritrea control, n = 81; Eritrea threat, n = 85).
Procedure
In the first part of the study, participants took an online pre-suvey using Qualtrics
software that contained several individual difference measures, including measures of egalitarian
ideals (attitudes toward minorities, color-blind racial ideology), motivation to respond without
prejudice, system justification beliefs (white guilt, diffuse system justification, and social
dominance orientation), and racial centrality. These measures were included to allow exploration
of potential moderating variables. Several additional measures of individual differences that were
not included in the main hypotheses were also included in the pre-survey, including measures of
the Big Five personality traits, self-regulatory style, locus of control, need for closure, and
optimism. Although the main focus of the study was to look at perceptions of threats to
privileged identities, these measures served as distracters for the race-related measures.
Participants completed the pre-survey separated in time and space from the main experiment to
hopefully prevent the experimental manipulation from biasing responses on these measures and
alleviate potential participant suspicion about the true purpose of the study. Mturk participants
49. 38
signed-up to complete the pre-survey for $2 compensation and were told they may be contacted
to participate in another study in the near future. HPR participants were prompted through the
university’s survey system to complete the pre-survey in order to be eligible to sign-up for the
second part of the study.
The second part of the study contained the experimental manipulation and the main
dependent variables. Mturk participants were first contacted two to seven days after they
completed the pre-survey to complete the second part of the study in order to receive an
additional $3 in compensation. Approximately 79.8% of the Mturk participants who completed
the first part of the study also completed the second part of the study. Mturk participants
completed the entire second part of the study online. After completing the pre-survey, HPR
participants scheduled an hour-long in-lab session one day to a week later to complete the second
part of the study and received 3 HPR credits for their participation in both parts of the study.
Approximately 78.5% of the HPR participants who completed the first part of the study also
completed the second part of the study.
At the beginning of the in-lab part of the study, HPR participants were greeted by a
White experimenter and seated at a computer. The experimenter then gave the participants a
brief overview of the study’s purpose and format, and then directed them to follow the
instructions on the computer (see Appendix A). From that point, both Mturk and HPR
participants saw the same instructions and completed the same experiment online using Qualtrics
software (see Appendix A). They were told that the study was concerned with how information
is presented, how the presentation affects readers’ comprehension of the information, and how
the presentation of the information makes them feel. The online instructions explained that the
study consisted of two parts. In each part, the participant was presented with different kinds of
50. 39
information and then asked to give their personal opinion of the way the information was
presented and how easy it was to learn and understand.
During the first part of the study, participants were shown an electronic copy of a mock
informational insert from a textbook (see Appendix B). The insert described changing
demographics among populations. The insert varied by condition in whether it described a
decrease in the proportion of White people in the U.S. population (U.S. threat condition), no
change in ethnic diversity in the U.S. (U.S. control condition), a decrease in the majority ethnic
population in Eritrea (Eritrea threat condition), and no change in diversity in Eritrea (Eritrea
control condition). Immediately following the presentation of the information, participants
completed a word-completion task intended to measure implicit threat associations. In keeping
with the information presentation cover story, participants were told that they were doing the
word-completion task because I was interested in the impact of the way the information was
presented on verbal ability. Participants were then asked to give their personal ratings of how the
information was presented. They were told that their ratings would be compared to those of other
participants who saw the same insert and others who saw the same information presented in
different formats and styles. The ratings that were collected (in order of presentation) include:
intergroup affect (anger, fear, worry, pity, envy, disgust), questions about the style of the insert
(to reinforce the cover story), evaluations of the changes (positive, negative, threat concerns),
questions relating to comprehension of the information (to serve as a manipulation check), and
perceptions of intergroup threat (realistic, symbolic, intergroup anxiety). At that time,
participants also completed half of the private collective self-esteem and personal self-esteem
measures.
51. 40
When they were finished with that part of the study, participants were told that they were
moving on to the second part of the study. They were told that in the second part they would also
be judging another way that information is presented, but that the information presented in the
second part was not related to the information presented in the first part of the study. Participants
were shown an electronic copy of a brief description of a job opening (see Appendix C). They
were then shown electronic copies of applications of people who have applied for that job (see
Appendix D). The applications consisted of people who differ by race (1 White, 1 Black).
Applications were pretested to ensure that each applicant was perceived as equally strong, t(146)
= -.29, p = .78, qualified, t(146) = .97, p = .33, competent, t(146) = .25, p = .80, and likely to be
hired, t(146) = .43 , p = .67, for the job so that race was the only factor that varied between the
applicants. Participants were told that they should judge each application to determine whether
the style of the application was useful for deciding who to hire. They were told that these
judgments would be compared with those of other participants who saw the same applications as
well as participants who saw the information presented in different formats. Participants were
again asked stylistic and comprehension questions. They were also asked to evaluate the job
applicants based on the information that was presented, including ratings of competency,
sociability, and likelihood of being hired.
Next, participants were asked to give some basic demographic information and complete
a measure of socially desirable responding. Participants were also asked to complete the second
half of the private and collective self-esteem measures, having been told that it was supposed to
be completed earlier but was accidentally skipped. Finally, participants were thoroughly
debriefed. HPR participants were given a hardcopy of a debriefing form, while Mturk
52. 41
participants were shown an electronic version. Both were given contact information if they had
any additional questions.
Measures
Individual difference measures in pre-survey.
Egalitarian ideals. Attitudes toward racial issues in general and awareness of white
privilege were measured using an Attitudes toward Minorities Scale (Brigham, 1993) and the
Color-Blind Racial Attitude Scale (COBRAS; Neville et al., 2000), described below.
The Attitudes toward Minorities scale consisted of ten items drawn from Brigham’s
(1993) original 20 item Attitudes toward Blacks Scale used to assess modern attitudes toward
racial minorities (see Appendix E). The measure was designed to capture modern aspects of
racism, including negative affective reactions (e.g., “I enjoy a funny racial joke, even if some
people might find it offensive.”), opposition toward governmental policies designed to address
race issues (e.g., “I favor open housing laws that allow more racial integration of
neighborhoods.”), discomfort interacting with racial minority group members (e.g., “I would not
mind at all if a Black family with about the same income and education as me moved in next
door.”), and personal worry about being denied an opportunity due to preferential treatment for
racial minorities (e.g., “I worry that in the next few years I may be denied my application for a
job or a promotion because of preferential treatment given to minority group members.”). Higher
scores on the measure indicated more negative attitudes toward racial minorities. Participants
were asked to rate how much they agreed or disagreed with each statement on a scale from 1
(strongly disagree) to 5 (strongly agree). Items were presented in random order.
The COBRAS consisted of 14 items that measured attitudes toward racial issues in the
United States on three subscales: racial privilege, institutional discrimination, and blatant racial
53. 42
issues (see Appendix F). The racial privilege subscale measured the degree to which participants
were aware of the existence of white privilege and special advantages afforded to majority group
members. It consisted of five items, such as “Race is very important in determining who is
successful and who is not.” The institutional discrimination subscale measured the degree to
which participants were aware of institutional forms of discrimination. It consisted of five items,
such as “Due to racial discrimination, programs such as affirmative action are necessary to help
create equality.” The blatant racial issues subscale measured the degree to which participants
were aware of racism and racial inequality in general. It consisted of four items, such as “Racism
is a major problem in the U.S.” Higher scores on each subscale indicated less awareness and
more color-blind attitudes. Participants were asked to rate how much they agreed or disagreed
with each statement on a scale from 1 (strongly disagree) to 5 (strongly agree). Items were
presented in random order.
An overall egalitarian beliefs variable was created by averaging participants’ scores on all
of the items in the Attitudes toward Minorities scale and Color-Blind Racial Attitude Scale. This
variable consisted of 34 items total. Higher scores on the egalitarian beliefs variable indicated
more positive attitudes toward racial minorities and more awareness of white privilege.
Status-legitimizing beliefs. Participants’ status-legitimizing beliefs were measured using
the White Guilt Scale (Swim & Miller, 1999) and the Diffuse System Justification Scale (Kay &
Jost, 2003). Participants overall attitudes toward social hierarchies were measured using the
Social Dominance Orientation Scale (Pratto et al., 1994)
Participants’ feelings of white guilt were measured using the White Guilt Scale (see
Appendix H; Swim & Miller, 1999). The scale was designed to measure participants’ feelings of
guilt for collective wrong to minorities. Participants indicated the degree to which they agreed
54. 43
with five statements on a scale from 1 (strongly disagree) to 5 (strongly agree). Items were
presented in random order and higher scores indicated more feelings of guilt. Sample items
include “I feel guilty about the past and present social inequality of racial minorities (i.e.,
slavery, poverty)” and “I feel guilty about the benefits and privileges that I receive as a White
American.”
Participants’ system-justifying beliefs were measured using the Diffuse System
Justification Scale (see Appendix I; Kay & Jost, 2003). The scale was designed to measure
participants’ beliefs that, in general, social and economic systems are fair and legitimate, and
their desire to maintain the status-quo. Participants indicated the degree to which they agreed or
disagreed with eight statements on a scale from 1 (strongly agree) to 5 (strongly disagree).
Sample items include “In general, I find society to fair,” and “Most policies serve the greater
good.” Items were presented in random order and higher scores indicated stronger system-
justification beliefs.
Participants’ individual differences in support of social hierarchies were measured using
the Social Dominance Orientation Scale (see Appendix G; Pratto et al., 1994). Participants
indicated the degree to which they agree or disagree with 16 statements on a scale from 1
(strongly disagree) to 5 (strongly agree). Sample items include “All groups should be given an
equal chance in life,” and “Some groups of people are just more worthy than others.” Items were
presented in random order and higher scores indicated greater support of social hierarchies.
An overall status-legitimization variable was created by averaging participants’ scores on
all of the items in the White Guilt Scale, Diffuse System Justification Scale, and Social
Dominance Orientation Scale. This variable consisted of 29 items total. Higher scores on the