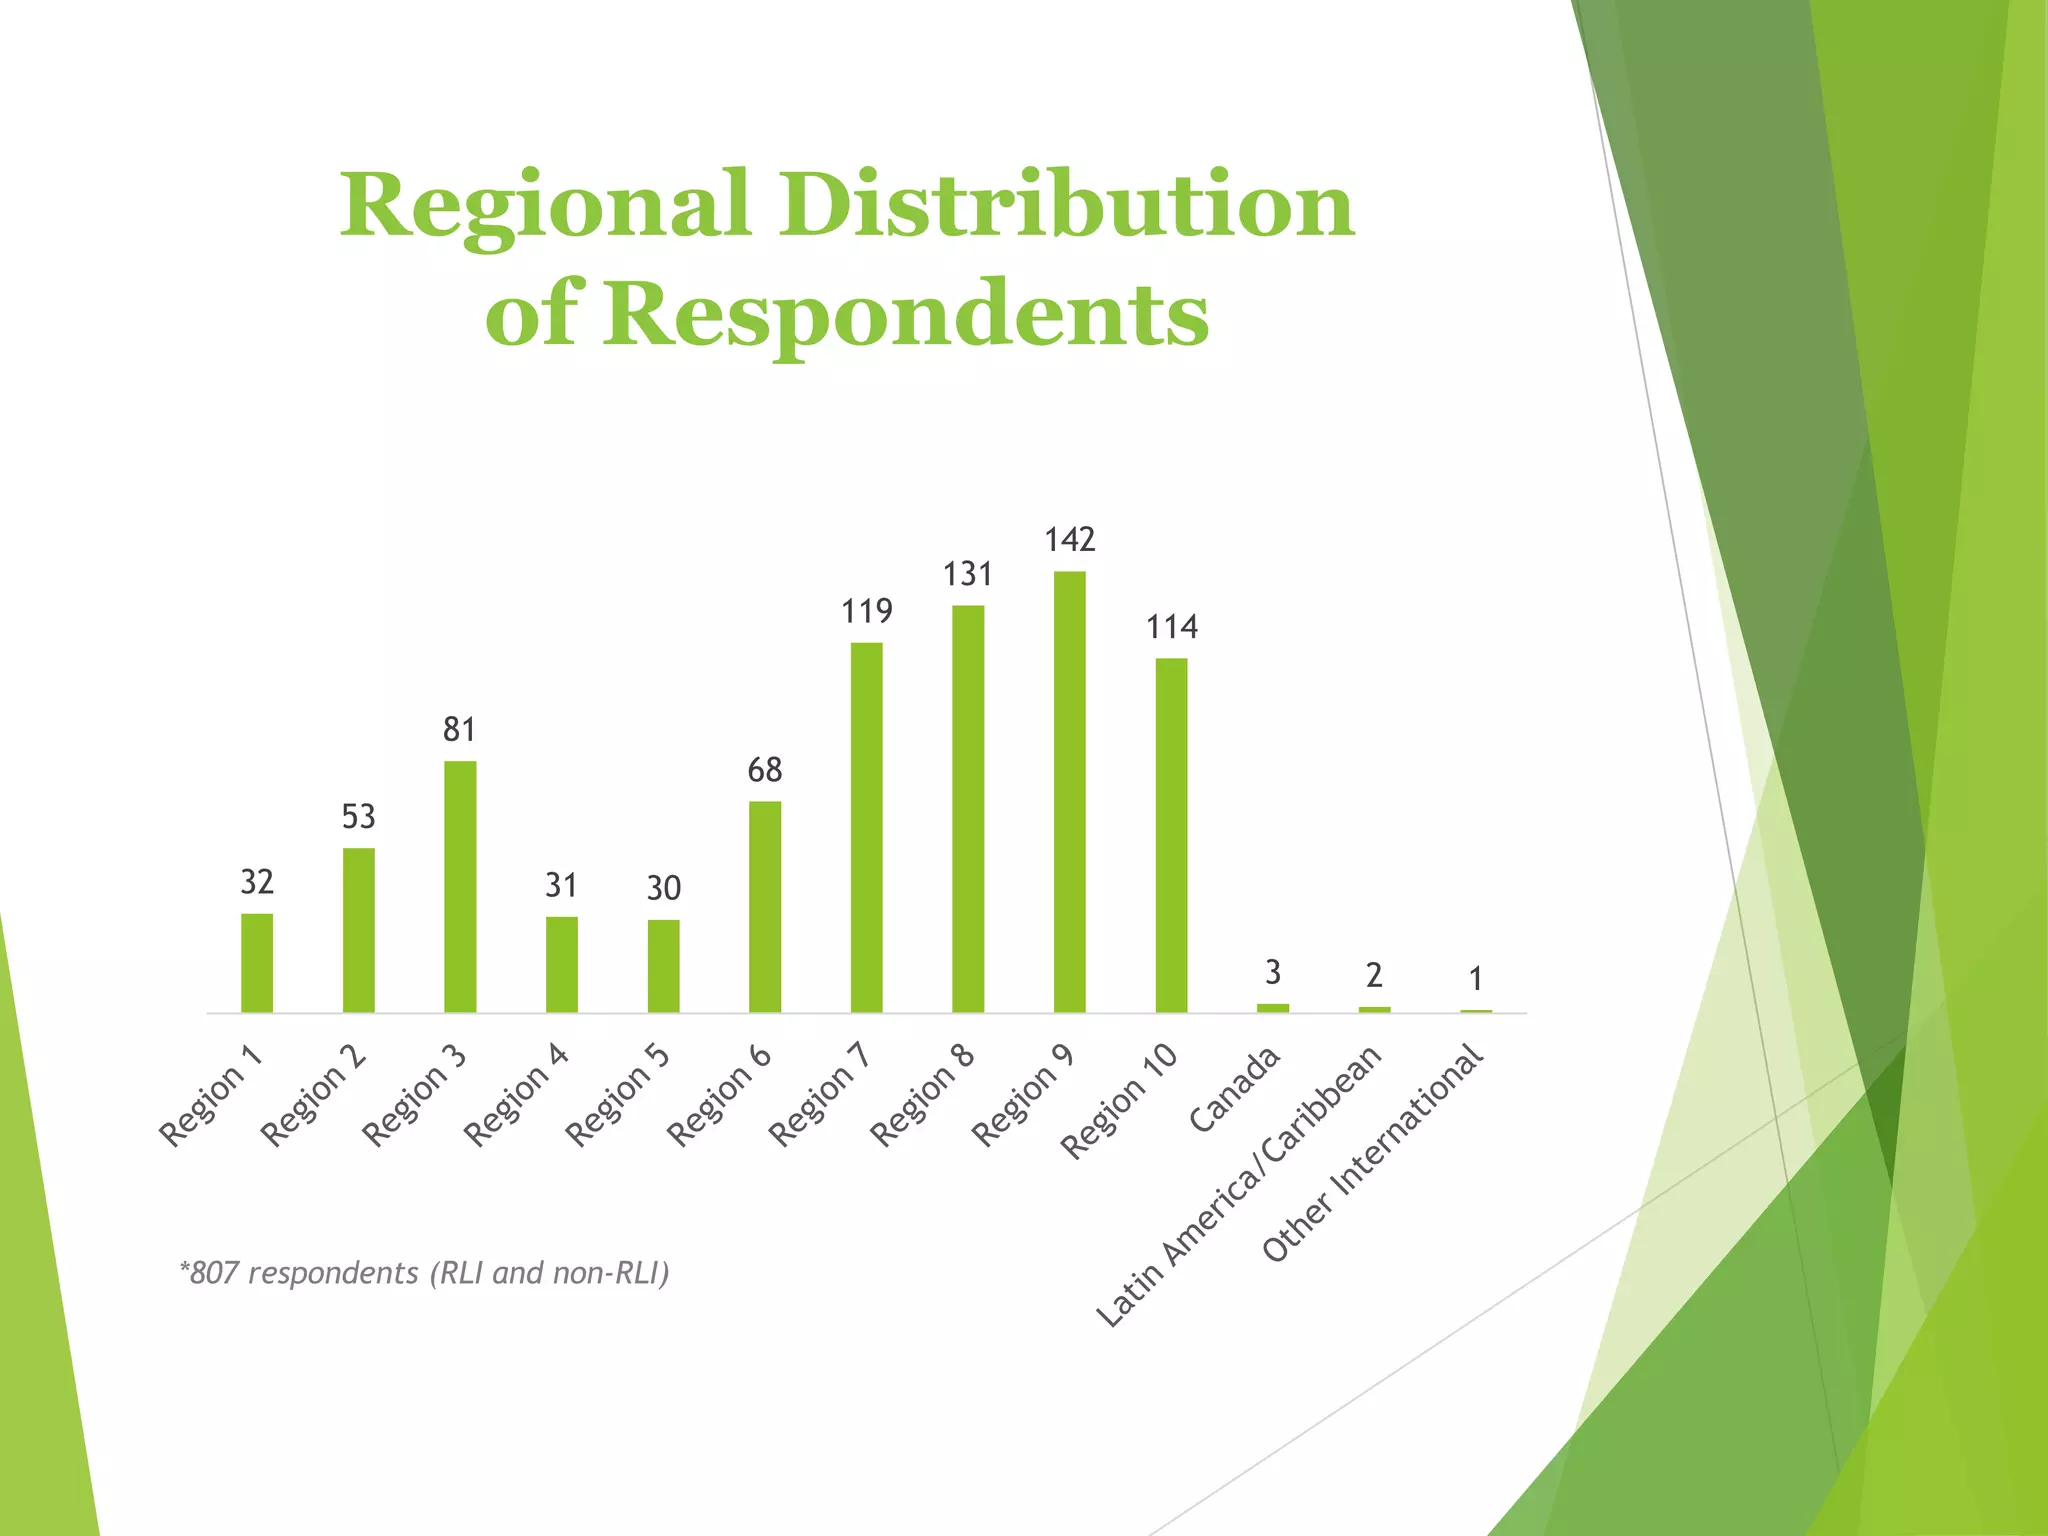
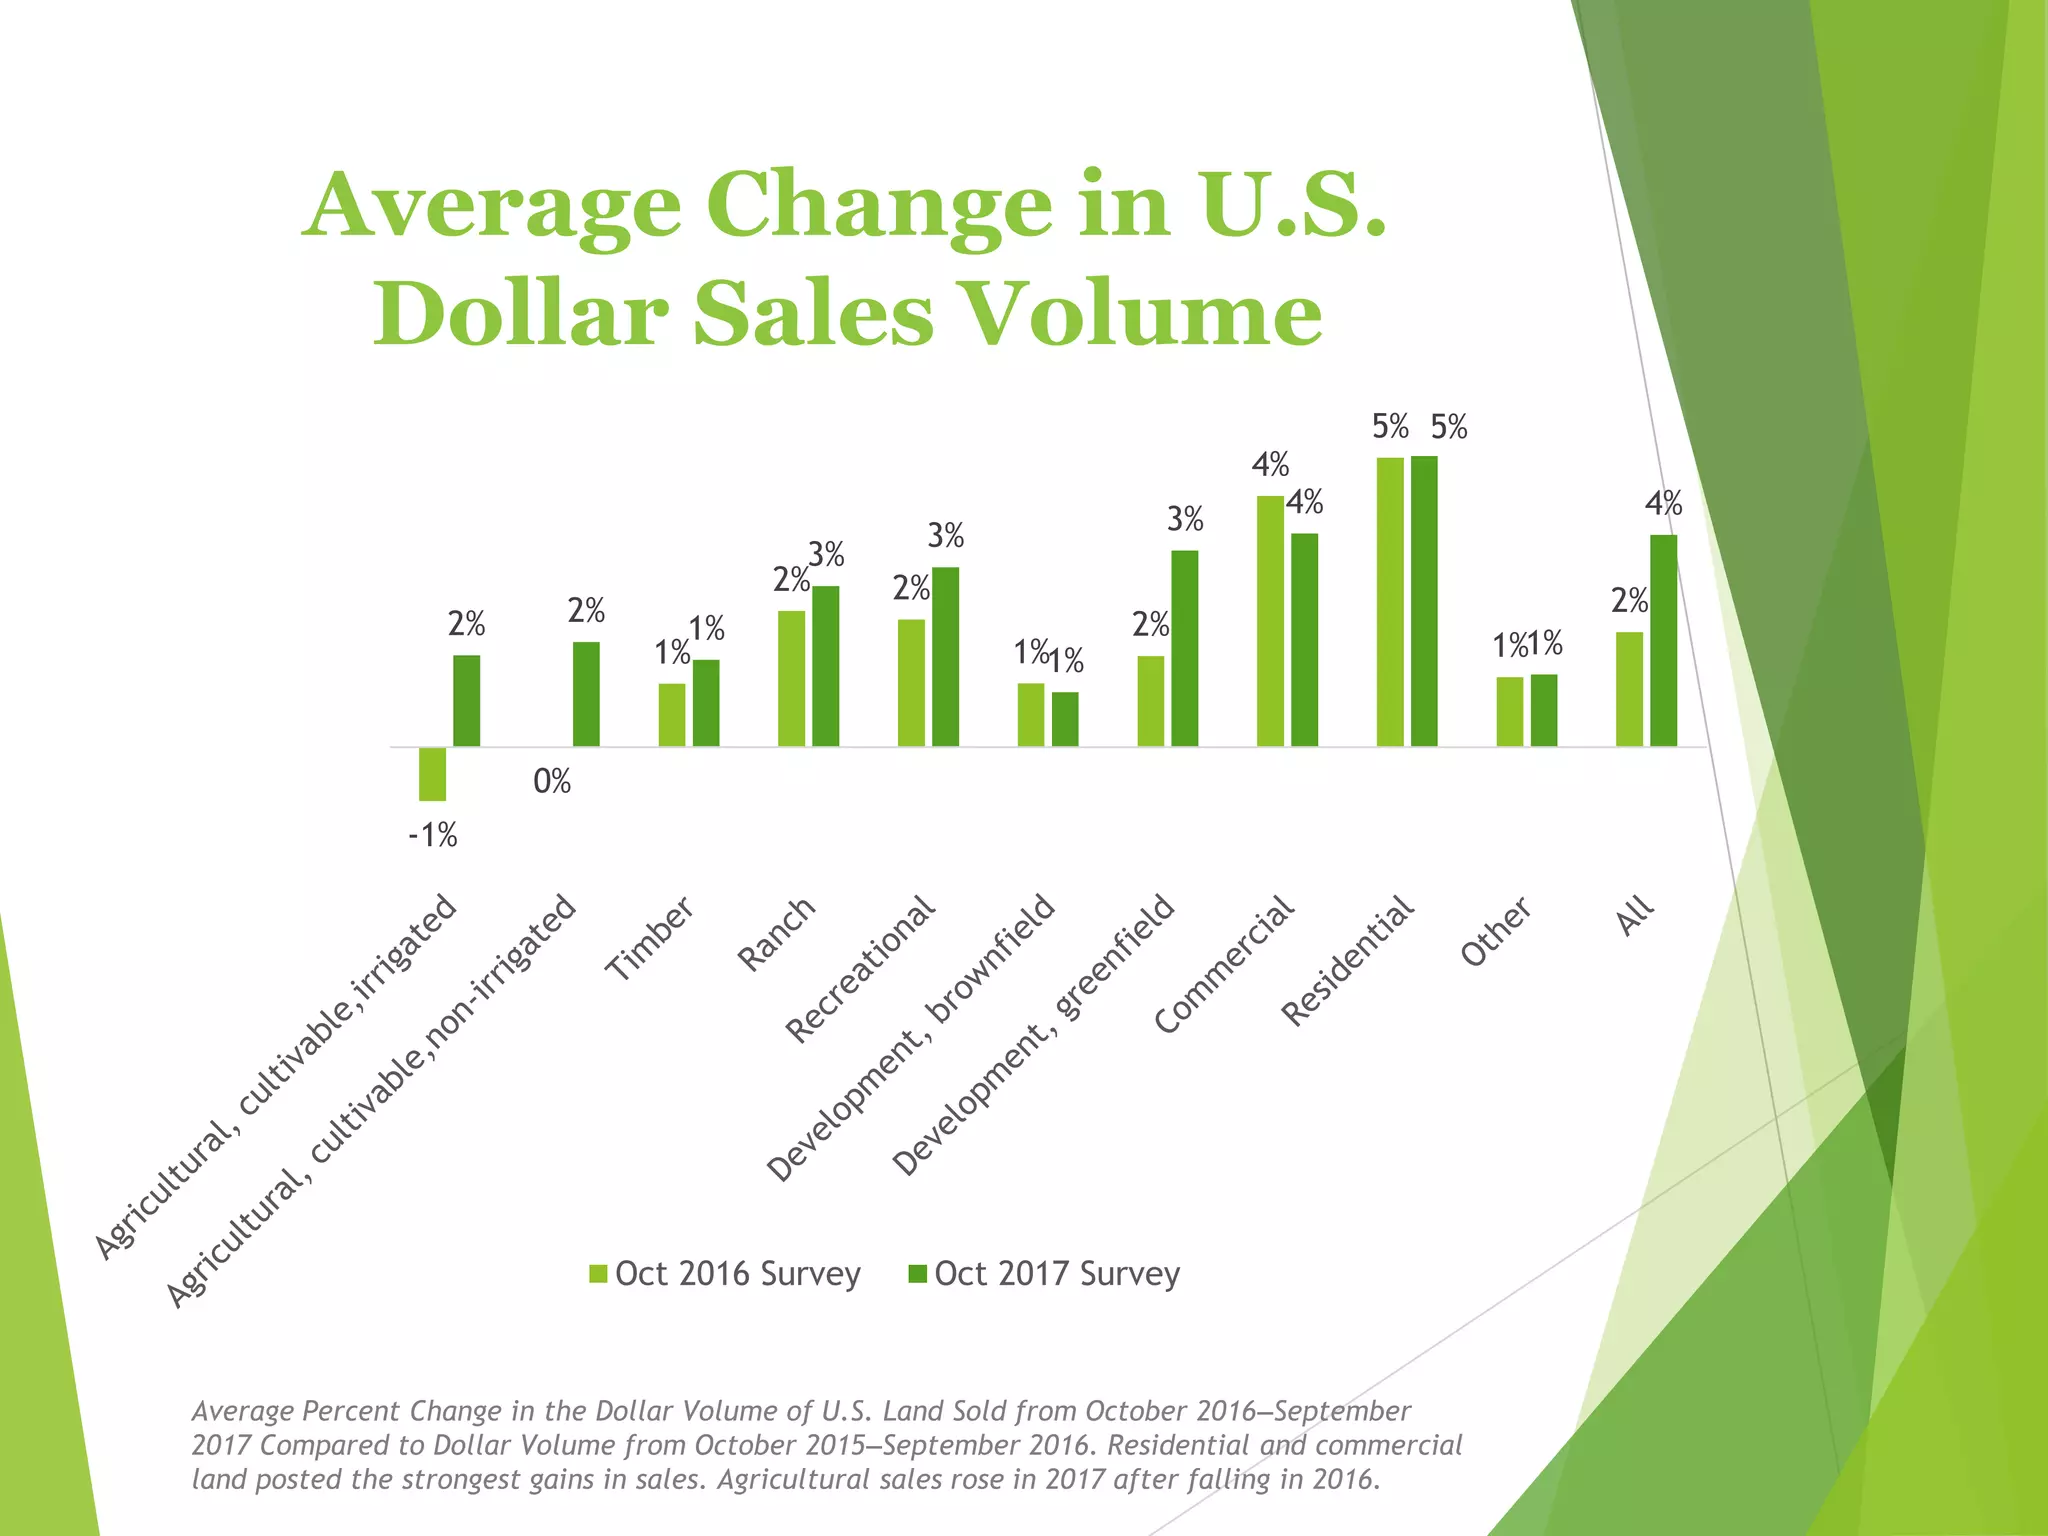
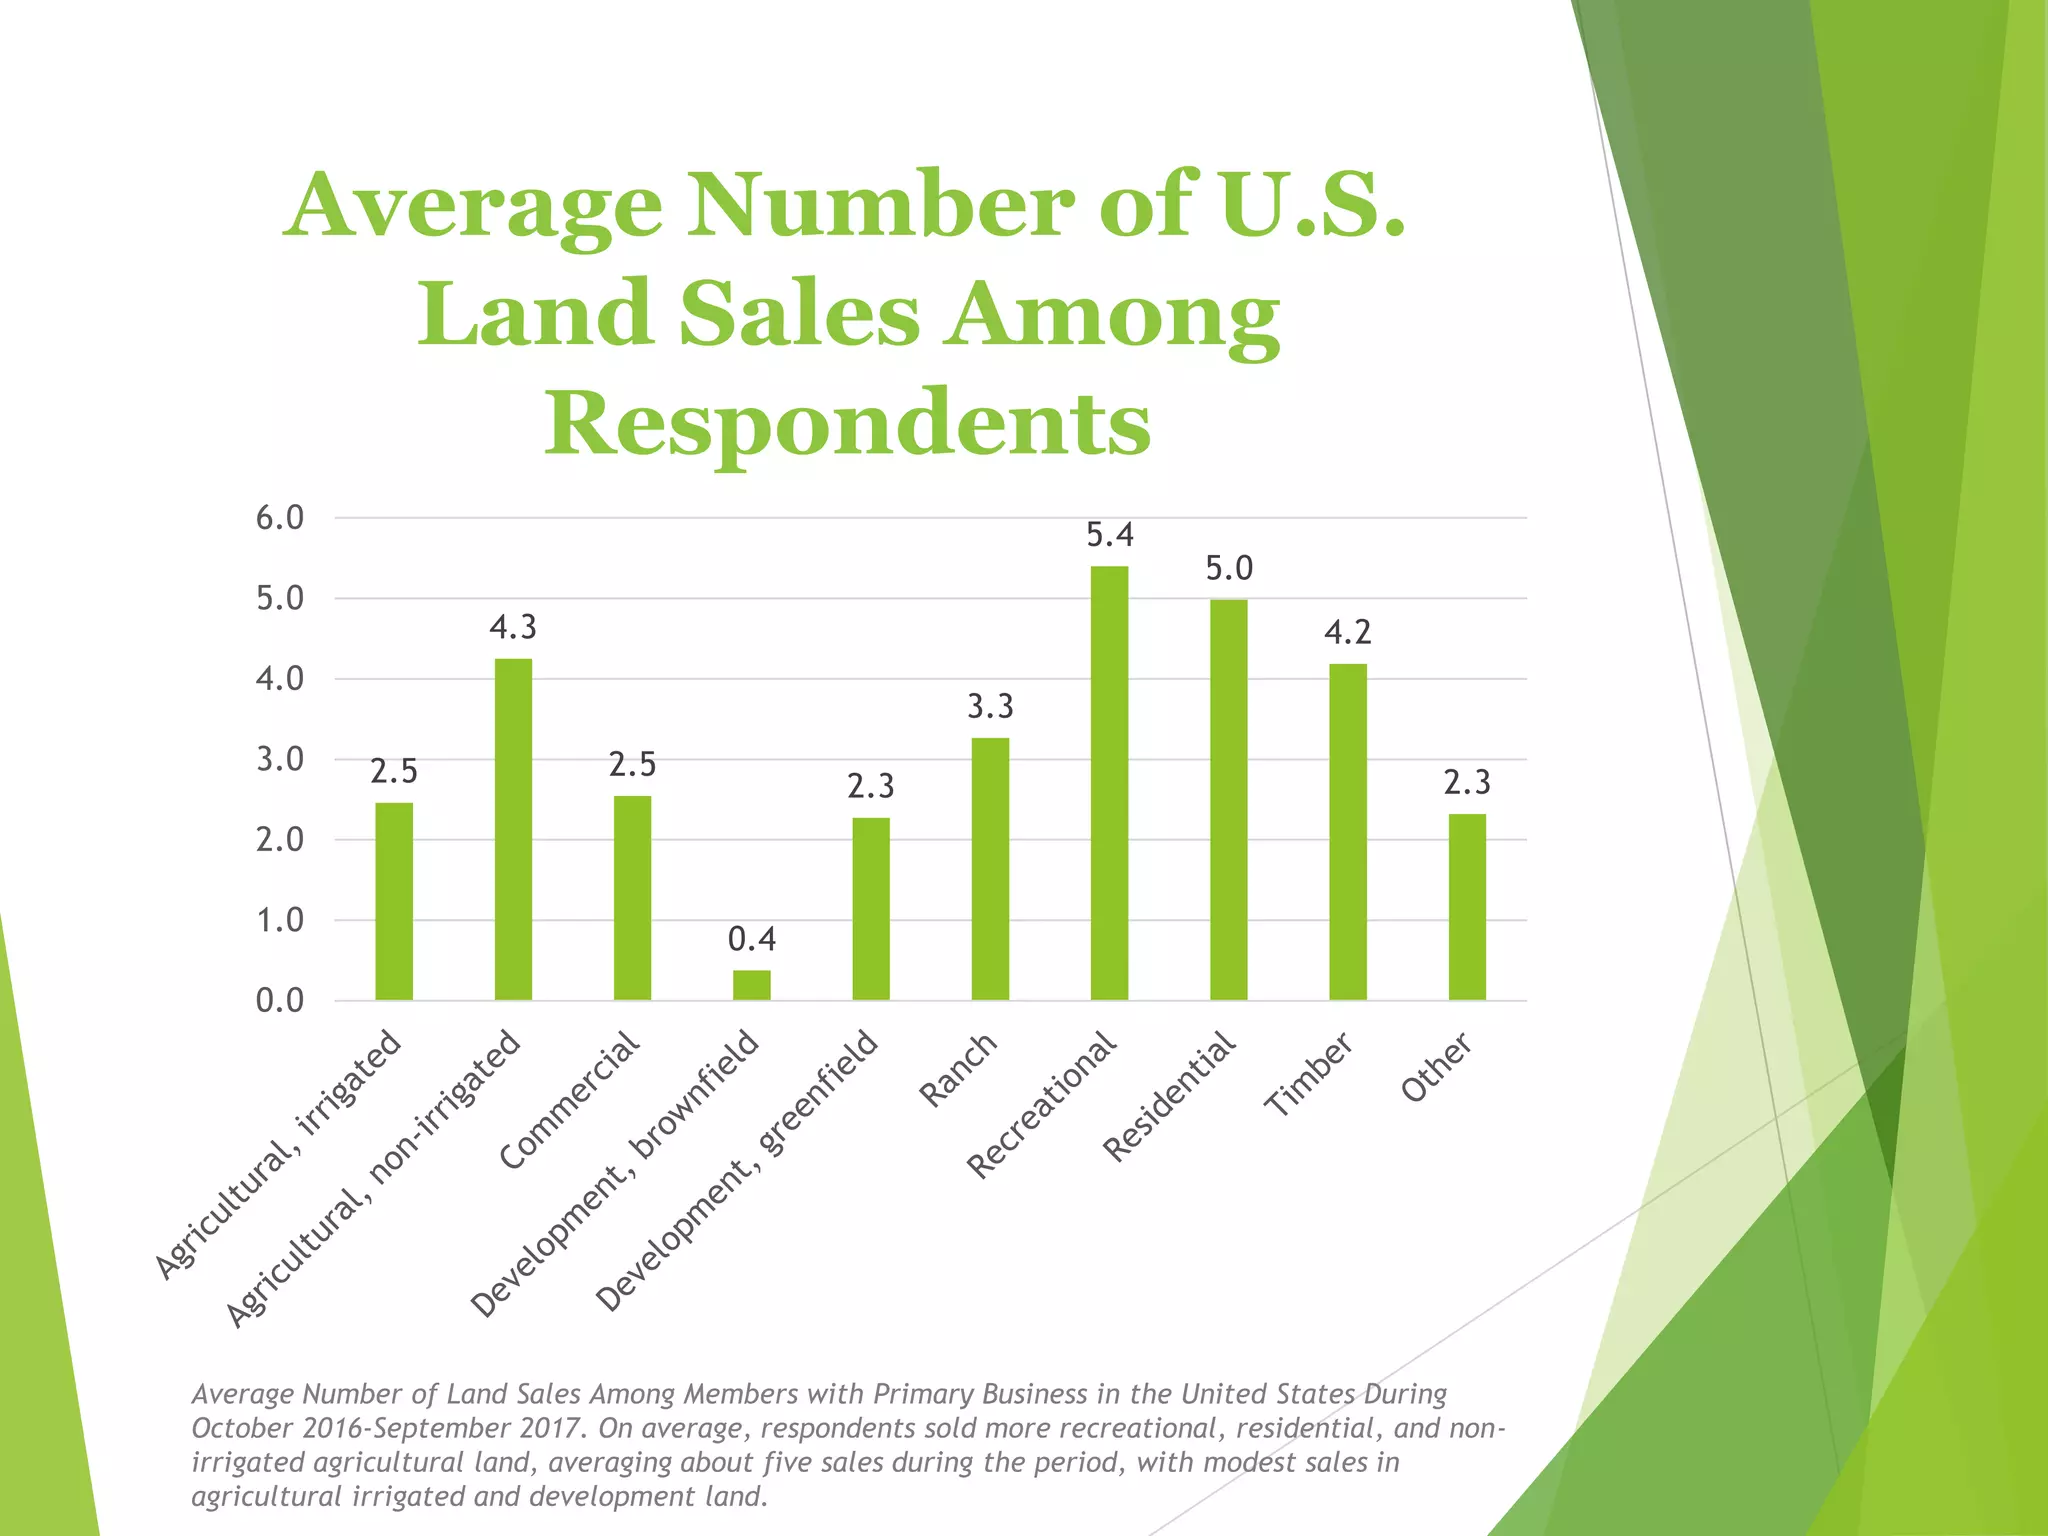
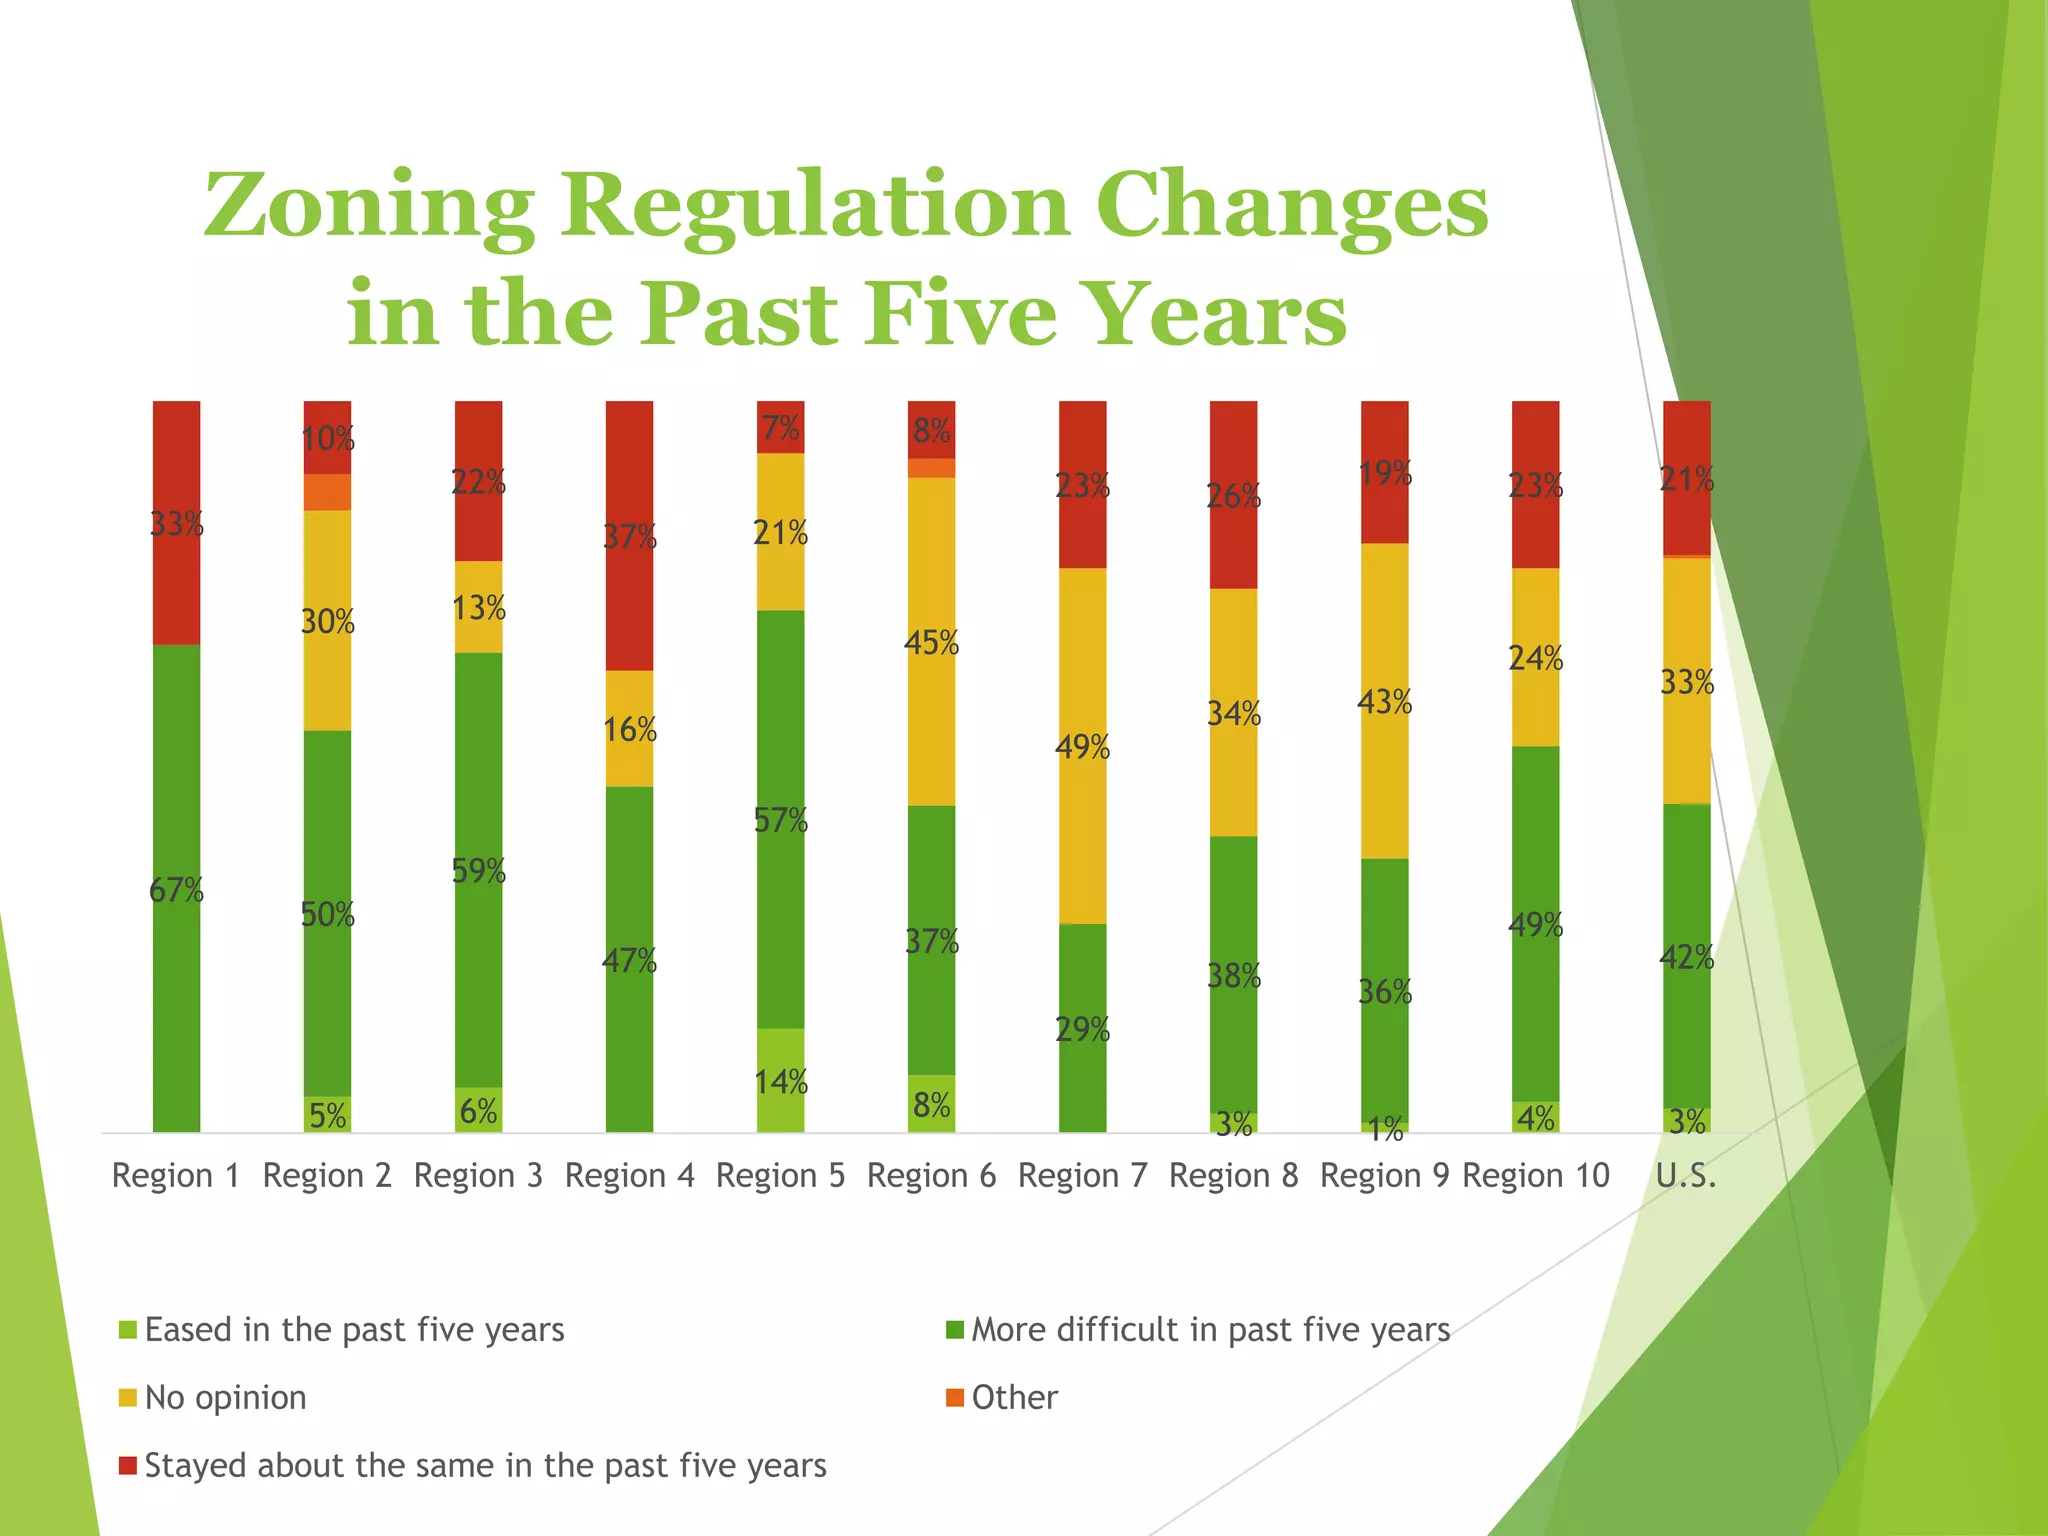
Advertisement
Advertisement

More Related Content

Similar to 2017 Land Markets Survey(20)

Advertisement

Recently uploaded(20)

2017 Land Markets Survey

  1. Land Market Survey National Association of REALTORS® REALTORS® Land Institute Released January 2018
  2. The U.S. Land Market Survey is an annual survey conducted by the National Association of REALTORS® (NAR) Research Group for the REALTORS® Land Institute (RLI). The findings from this Report can be cited with the proper attribution to NAR and the RLI. National Association of REALTORS® Research Group Lawrence Yun, Ph.D. Senior Vice President & Chief Economist George Ratiu, MA, Managing Director, Housing and Commercial Research Gay Cororaton, MS, Research Economist REALTORS® Land Institute Aubrie Kobernus, MBA, RCE, Chief Executive Officer Jessa Friedrich, MBA, Marketing Manager
  3. President’s Message “As the 2018 National President of the REALTORS® Land Institute (RLI), “The Voice of Land,” I am proud to release this results of our 2017 Land Markets Survey to the industry. Every year, in partnership with the National Association of REALTORS® (NAR) Research Group, RLI conducts and publishes this survey for the benefit of landowners and land real estate professionals across the industry to use as a resource.” - Jimmy Settle, ALC 2018 RLI National President
  4. About the Survey Objective  To gather information about land transactions among land real estate professionals during the reference period of October 2016–September 2017 and on their outlook for the period October 2017–September 2018. Timeframe  NAR and RLI conducted the online survey from October 9–November 20, 2017. Participants  807 respondents (614 in the October 2016 survey), 568 of which closed a land transaction.
  5. Survey Regions
  6. Regional Distribution of Respondents 32 53 81 31 30 68 119 131 142 114 3 2 1 *807 respondents (RLI and non-RLI)
  7. Professional Membership of Respondents 47.2% 80.1% 6.9% 0.8% 3.6% 0.4% 1.0% 21.1% RLI NAR CCIM SIOR AFSMRA NAIOP ULI Other
  8. Survey Highlights  Stronger economic growth, sustained growth in housing demand and residential construction, and stable commodity prices in 2017 after a three-year decline underpinned a stronger land market during the period October 2016–September 2017.  On average, respondents reported a 4% gain in the dollar volume of U.S. land sales between October 2016‒September 2017 from the prior 12-month period (2% in the October 2016 survey).  Sales for all types of land increased, led by residential land sales which rose 5% and commercial land which increased 4%.  Sales of agricultural irrigated and non-irrigated land each rose by 2%, a turnaround from the sales decline respondents reported in the October 2016 survey. With flat commodity prices, the growth was modest compared to residential and commercial land sales.
  9. Survey Highlights Continued…  On average, U.S. land prices (in dollars per acre) rose at a faster pace of 3% from September 2016 to September 2017 (1% in the October 2016 survey).  Prices rose across all land types, led by residential land at 5% and commercial and greenfield development land at 4%.  The price per acre of agricultural irrigated land sold rose 2%, while the price of agricultural non-irrigated land sold rose 1%, a rebound from the price decline respondents reported in the October 2016 survey.
  10. Survey Highlights Continued…  On average, respondents expect U.S. land sales volumes to increase at a healthy pace of 3% between October 2017‒September 2018 from the October 2016‒September 2017 period.  Timber, residential, and greenfield development land are expected to post the strongest growth rates at 3%.  Respondents expect an increase in transactions for all types of land, with the strongest pace in residential at 4% and recreational, commercial, greenfield development, and timber, each at 3%.
  11. Survey Highlights Continued…  On average, respondents expect U.S. land prices (in dollars per acre) to increase at a sustained pace of 3% from September 2017 to September 2018.  Prices are expected to increase across all land types, led by residential and commercial land, each at 4%.  Prices of agricultural land are expected to post a modest growth of 1%.
  12. Survey Highlights Continued…  Regions 7,8,9,and 10 accounted for 68% of U.S. land sales between October 2016‒September 2017.  In addition to residential land sales, most land transactions were:  Region 1: commercial, timber  Region 2: recreational, timber  Region 3: agricultural non-irrigated, recreational  Region 4: good mix of types of land  Region 5: commercial  Region 6: good mix of types of land  Region 7: agricultural non-irrigated, recreational  Region 8: ranch, recreational  Region 9: recreational, timber, commercial  Region 10: recreational, agricultural non- irrigated, commercial
  13. Survey Highlights Continued…  On average, respondents sold made 5 sales each on residential and recreational land, 4 sales each on agricultural non-irrigated and timber land, and 3 sales each on commercial and ranch land during October 2016–September 2017. Sales were modest on agricultural irrigated land, where respondents reported about 2 sales on average.  Individuals/family buyers accounted for 61% of U.S. land buyers and 76% of U.S. land sellers.  Amid flat commodity prices, expansion farmers accounted for 1% of land buyers, down from the 12% share reported in the October 2016 survey.  Investors accounted for 25% of U.S. land buyers and 12% of U.S. land sellers, indicating strong investor demand.  Foreign buyers accounted for 1% of U.S. land buyers and 2% of U.S. land sellers.
  14. Survey Highlights Continued…  U.S. lands for sale were typically sold within 95 days, slightly more quickly than the 100 days in the prior 12- month period.  Commercial land sold more quickly during October 2016-September 2017 at 200 days (180 days in the October 2016 survey), while residential land sold at the same duration of 120 days.  Amid weak commodity prices, agricultural irrigated land stayed on the market longer at 60 days, up from 30 days in the prior 12-month period.  Agricultural non-irrigated land sold most quickly at 45 days.  The acreage of U.S. land sold was typically 58 acres. The smallest land acreage sold were of residential lands, which were typically 4 acres, and commercial lands, which were typically 5 acres.
  15. Survey Highlights Continued…  Land purchases were financed by equity (cash) in 44% of transactions. Land purchased through a 1031 exchange accounted for 12%. The widespread use of equity(cash) indicates the lack of land financing, an issue reported by some respondents.  Local and regional banks accounted for 60% of land financing .  Mineral rights were conveyed in 61% of U.S. lands sold, with higher intensity in Regions 7, 9, and 10.
  16. Survey Highlights Continued…  Respondents reported facing land issues related to federal regulations, financing, state, local, and other issues (e.g., economy, commodity prices, easement/access, water rights, zoning, etc.).  42% reported that zoning regulations have tightened in the past five years; in Regions 1,2,3, and 5, at least half of respondents reported stricter zoning regulations.  52% reported that residential land has become less available in the past five years.  According to respondents, low commodity prices, tighter zoning, lack of land financing, and lack of good land database were issues that adversely impacted land transactions.
  17. Market Conditions & Outlook for U.S. Land Sales
  18. Stronger Economic Growth in 2016–2017 -10.0 -8.0 -6.0 -4.0 -2.0 0.0 2.0 4.0 6.0 Economic growth recovered in 2016 after faltering in 2015. Sustained growth bolsters demand for resources, including land. Source: Bureau of Economic Analysis, downloaded from Haver Analytics.
  19. Continued Recovery in Housing Demand and Residential Construction 0 50 100 150 200 250 20121 20122 20123 20124 20131 20132 20133 20134 20141 20142 20143 20144 20151 20152 20153 20154 20161 20162 20163 20164 20171 20172 20173 U.S. Northeast Midwest South West
  20. Flat Commodity Prices in 2016 Q4–2017 Q3 0.00 100.00 200.00 300.00 400.00 500.00 600.00 700.00 200003 200010 200105 200112 200207 200302 200309 200404 200411 200506 200601 200608 200703 200710 200805 200812 200907 201002 201009 201104 201111 201206 201301 201308 201403 201410 201505 201512 201607 201702 201709 S&P GSCI Livestock Nearby Index (Jan-2-70=100) S&P GSCI Grains Index (Jan-5-70=100) S&P GSCI All Cattle Index (Index) Commodity prices stabilized in late 2016 through 2017 after declining in 2014. Stable (and rising) commodity prices have a positive effect on the demand for agricultural land. Source: Standard & Poor's, downloaded from Haver Analytics.
  21. Average Change in U.S. Dollar Sales Volume -1% 0% 1% 2% 2% 1% 2% 4% 5% 1% 2% 2% 2% 1% 3% 3% 1% 3% 4% 5% 1% 4% Oct 2016 Survey Oct 2017 Survey Average Percent Change in the Dollar Volume of U.S. Land Sold from October 2016‒September 2017 Compared to Dollar Volume from October 2015‒September 2016. Residential and commercial land posted the strongest gains in sales. Agricultural sales rose in 2017 after falling in 2016.
  22. Average Change in Price of U.S. Land Sold -1% -2% 1% 1% 1% 1% 2% 3% 5% -3% 1% 2% 1% 1% 3% 2% 2% 4% 4% 5% 2% 3% Oct 2016 Survey Oct 2017 Survey Average Percent Change in the Dollar Price Per Acre of U.S. Land Sold in September 2017 Compared to September 2016. Residential, commercial, and greenfield development land posted the strongest change in price per acre of land sold.
  23. Expected Change in Dollar Volume of U.S. Land Sales in Next 12 Months 2% 2% 1% 3% 3% 1% 3% 4% 5% 1% 4% 2% 2% 3% 2% 4% 1% 3% 3% 4% 2% 3% Average Change in Dollar Sales in Past 12 Months Average Expected Change in Dollar Sales in Next 12 Months Average Expected Change in the Dollar Volume of U.S. Land Sales from October 2017–September 2018 Compared to Dollar Volume in October 2016–September 2017. Respondents expect the dollar volume to increase three percent by September 2018, about the same rate as the change in dollar volume during October 2016–September 2017, with strong gains in residential, recreational, and commercial land sales.
  24. Expected Change in Price of U.S. Land Sold 2% 1% 1% 3% 2% 2% 4% 4% 5% 2% 3% 1% 1% 2% 2% 3% 2% 3% 4% 4% 2% 3% Average Price Change in Past 12 Months Expected Price Change in Next 12 Months Average Expected Change in the Price of U.S. Land (in Dollars Per Acre) by September 2018 Compared to Prices in September 2017. Respondents expect prices to increase three percent by September 2018, about the same rate from September 2016 to September 2017, with strong gains in residential, commercial, and greenfield development land.
  25. Characteristics of U.S. Land Sales
  26. Distribution of U.S. Land Sales 3% 5% 8% 5% 3% 8% 16% 18% 18% 16% Region1 Region2 Region3 Region4 Region5 Region6 Region7 Region8 Region9 Region10 The distribution of land sales is based on respondents who reported that their primary region of business is in the United States. Regions 7,8,9,and 10 accounted for 68 percent of U.S. land sales.
  27. Type of U.S. Land Sales 6.3% 14.4% 9.5% 0.3% 2.6% 8.7% 20.6% 27.5% 11.8% 1.2% 0.0% 5.0% 10.0% 15.0% 20.0% 25.0% 30.0% Oct 2016 Survey Oct 2017 Survey Percentage Distribution of Land Sales Among Members with Primary Business in the United States. Residential and recreational land sales accounted for 48 percent of U.S. land sales.
  28. Type of U.S. Land Sales Among All Respondents and RLI Members 6.1% 13.6% 7.0% 0.3% 2.8% 9.3% 19.9% 28.9% 10.7% 1.2% 0.0% 5.0% 10.0% 15.0% 20.0% 25.0% 30.0% 35.0% All Respondents RLI Members Percentage Distribution of Land Sales Among Members with Primary Business in the United States. There is no stark difference between all respondents and only RLI Member respondents regarding the distribution of their land sales.
  29. Types of U.S. Land Sold by Region Land Sales Among Members with Primary Business in the United States During October 2016-September 2017. The estimates for Regions 1, 4, and 5 are based on less than 30 observations.
  30. Types of U.S. Land Sold by Region  In addition to residential land sales, most land sold were:  Region 1: commercial, timber  Region 2: recreational, timber  Region 3: agricultural-non-irrigated, recreational  Region 4: good mix of types of land  Region 5: commercial  Region 6: good mix of types of land  Region 7: agricultural non-irrigated, recreational  Region 8: ranch, recreational  Region 9: recreational, timber, commercial  Region 10: recreational, agricultural non-irrigated, commercial
  31. Average Number of U.S. Land Sales Among Respondents 2.5 4.3 2.5 0.4 2.3 3.3 5.4 5.0 4.2 2.3 0.0 1.0 2.0 3.0 4.0 5.0 6.0 Average Number of Land Sales Among Members with Primary Business in the United States During October 2016-September 2017. On average, respondents sold more recreational, residential, and non- irrigated agricultural land, averaging about five sales during the period, with modest sales in agricultural irrigated and development land.
  32. Type of Buyers of U.S. Land 61% 15% 1% 25% 1% 4% 0% 10% 20% 30% 40% 50% 60% 70% Jul 2014 Survey Feb 2015 Survey Oct 2015 Survey Oct 2016 Survey Oct 2017 Survey Based on the type of the most recent buyer. Multiple responses are allowed so the responses will not sum up to 100 percent. Individuals/family buyers accounted for 61 percent of U.S. land buyers.
  33. Type of Sellers of U.S. Land 76% 13% 1% 12% 2% 3% 0% 10% 20% 30% 40% 50% 60% 70% 80% 90% Jul 2014 Survey 2015 Feb Survey Oct 2015 Survey Oct 2016 Survey Oct 2017 Survey Based on the type of the most recent seller. Multiple responses are allowed so the responses will not sum up to 100 percent. Individuals/family sellers accounted for 76 percent of U.S. land sellers.
  34. Median Days on Market of Land Sold by Type 30 75 200 150 90 120 85 100 60 45 180 95 140 120 160 95 0 50 100 150 200 250 Oct 2015 Survey Oct 2016 Survey Oct 2017 Survey Based on the most recent sale of the respondent. Development land and “Other” types of land are not shown separately due to very small sample size, but the responses are used in calculating the median days on market of all land sold in the United States. Agricultural land is the quickest type of land to sell. With flat commodity price, agricultural irrigated land took longer to sell at 60 days.
  35. Median Acreage of U.S. Land Sold by Type 138 130 119 118 89 57 5 4 58 0 50 100 150 200 250 300 350 July 2014 Survey July 2014 Survey Oct 2015 Survey Oct 2016 Survey Oct 2017 Survey Based on the most recent sale of the respondents. Median acreage of development land and “Other” types of land are not shown separately due to very small sample size, but they are used in the calculation of the U.S. median acreage.
  36. Financing of U.S. Land Sold 44% 12% 37% 7% Equity (Cash) Exchange Debt Owner Land purchases are financed by equity (cash) in 44 percent of transactions. Land purchased through a 1031 exchange accounted for 12 percent. The use of equity (cash) indicates the difficulty of obtaining land financing.
  37. Sources of Financing of U.S. Land Purchased 34% 26% 9% 7% 6% 3% 1% 1% 1% 0% 0% 0% 12% Local and regional banks accounted for 60 percent of land financing.
  38. Land Sales With Mineral Rights Conveyed 44% 58% 55% 61% 44% 29% 84% 34% 71% 81% 61% Region 1 Region 2 Region 3 Region 4 Region 5 Region 6 Region 7 Region 8 Region 9 Region 10 U.S. Mineral rights were conveyed in 61 percent of U.S. lands sold, with higher intensity in Regions 7, 9, and 10.
  39. Issues Affecting Land Sales
  40. Issues Affecting Land Transactions in the Past Five Years Federal, 6% Financing, 39% Local, 24% Other, 25% State, 6% Federal Financing Local Other State Among respondents with primary business in the United States. Respondents reported issues related to federal regulations, financing, state, local, and other issues. “Other” includes economy, commodity prices, easement/access, zoning, water rights, “all of the above”, etc.
  41. Zoning Regulation Changes in the Past Five Years 5% 6% 14% 8% 3% 1% 4% 3% 67% 50% 59% 47% 57% 37% 29% 38% 36% 49% 42% 30% 13% 16% 21% 45% 49% 34% 43% 24% 33% 33% 10% 22% 37% 7% 8% 23% 26% 19% 23% 21% Region 1 Region 2 Region 3 Region 4 Region 5 Region 6 Region 7 Region 8 Region 9 Region 10 U.S. Eased in the past five years More difficult in past five years No opinion Other Stayed about the same in the past five years
  42. Availability of Residential Land 27% 21% 19% 28% 4% 29% 23% 17% 26% 5% Less available closer to city centers and more available in suburban or exurban areas Less available in all areas More available in all areas No opinion Other Oct 2016 Survey Oct 2017 Survey Among respondents with primary business in the United States, 52 percent reported that land has become less available compared to five years ago. an increase from the 48 percent share in the October 2016 survey.
  43. Where Respondents Listed Land for Sale 78% 51% 12% 11% 6% 3% 3% 2% 28% Percent of respondents who reported these responses. Multiple responses allowed, so the percentages won’t sum to 100 percent.
  44. Where Respondents Access Land Market Statistics and Prices 76% 44% 43% 26% 21% 19% 17% MLS Local Appraiser(s) Courthouse/ courthouse research companies REALTORS® Property Resource (RPR) Lands of America Loopnet Other Percent of respondents who reported these responses. Multiple responses allowed, so the percentages won’t sum to 100 percent.
  45. Issues Reported By Respondents ◦ Land financing is almost non-existent. ◦ Land in our area is difficult to sell if there are no utilities on the property such as city services, wells, and septic. The cost to install these items often stop a buyer from proceeding. ◦ Low commodity prices have drive agriculture land price down. ◦ Land sales has increased due to low inventory of homes on market. Buyers are looking for land to build the house of their dreams. ◦ In our area, it is very difficult to find buyers for land. Sellers want more money than land is valued at, buyers don't have the funds, and land is not appraising where the sellers want to sell. ◦ Water rights is the biggest issue facing the West and Pacific Northwest. ◦ Land has many environmental challenges. ◦ Appraisal values of commercial and entry level residential are still holding back development. If builders could make money on entry level housing, land market would be stronger, especially in tertiary markets in Florida ◦ Cities now are enacting onerous regulations. ◦ The issue of 1031 exchanges potentially going away has increasingly become a concern for buyers/sellers. ◦ An RLI –owned database of land sales would be a valuable asset to create.
  46. Technical Appendix This graph compares the distribution of the sample of respondents based on their self-identified region (“sample”) to the distribution of 1,260 RLI members by state provided by the REALTORS® Land Institute (‘’population”). 0.0% 5.0% 10.0% 15.0% 20.0% 25.0% Distribution of October 2017 Survey Respondents* Survey Respondents *807 respondents (RLI and non-RLI members)
  47.  The REALTORS® Land Institute, “The Voice of Land,” provides the expertise, camaraderie, and resources that are the foundation for all land real estate professionals to become the best in the business. The RLI continually strives to maintain its status as the acknowledged leader for all matters pertaining to the land real estate profession is the essential membership organization for the extraordinary real estate professionals who broker, lease, sell, develop, and manage our most precious resource: the land.  The NATIONAL ASSOCIATION of REALTORS®, “The Voice for Real Estate,” is America’s largest trade association, representing over 1 million members, including NAR’s institutes, societies, and councils, involved in all aspects of the real estate industry.  The NATIONAL ASSOCIATION of REALTORS® Research Group collects and disseminates timely, accurate, and comprehensive real estate data and to conduct economic analysis in order to inform and engage members, consumers, policy makers, and the media in a professional and accessible manner. REALTORS® Land Institute 430 N. Michigan Avenue Chicago, IL 60611 United States Phone: 800-441-5263 http://www.rliland.com/ NATIONAL ASSOCIATION of REALTORS® 500 New Jersey Avenue, NW Washington, DC 20001 Phone: 202-383-1000 https://www.nar.realtor/
Advertisement