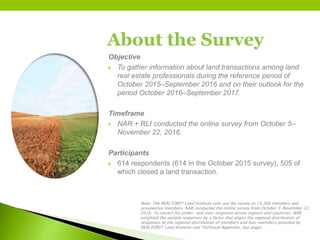
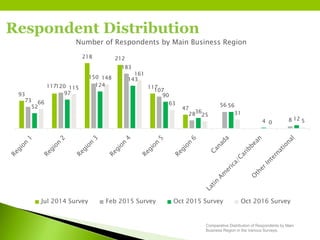
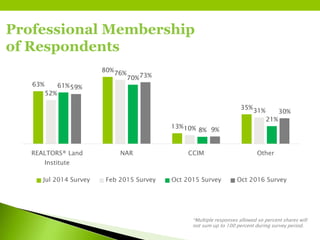
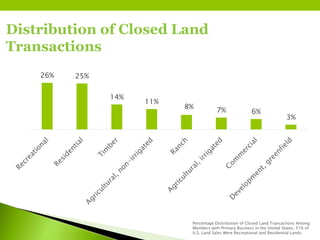
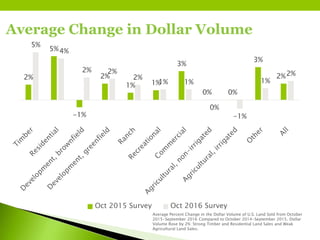
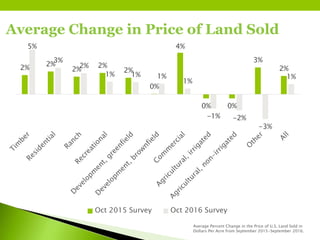
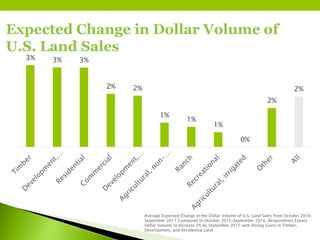
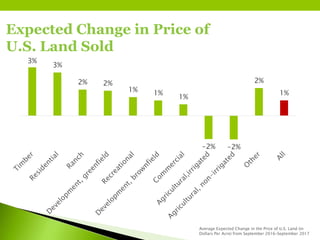
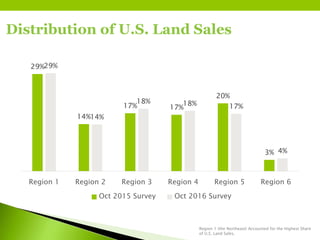
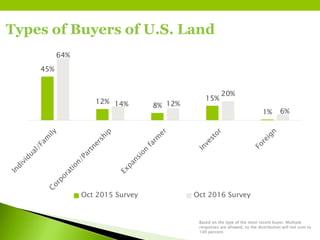
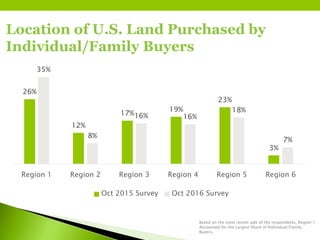
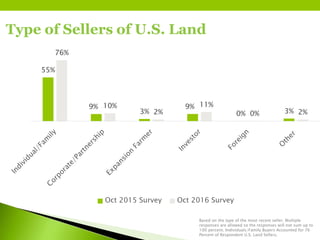
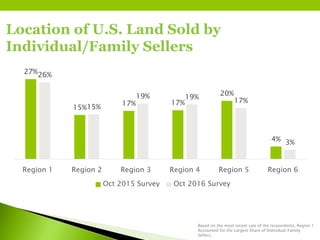
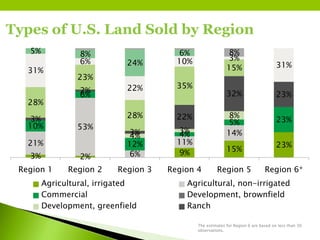
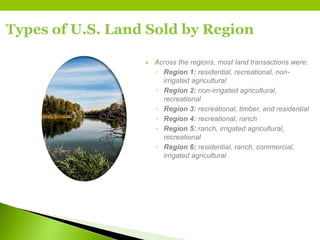
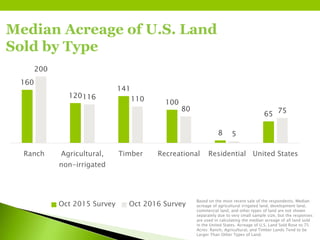
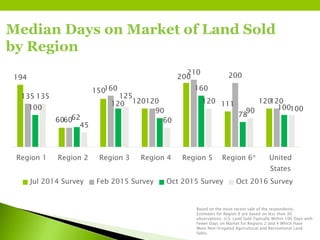
Advertisement

2016 Land Markets Survey

REALTORS® Land Institute
Feb. 13, 2017
Advertisement

More Related Content

Advertisement

Similar to 2016 Land Markets Survey(20)

Advertisement

2016 Land Markets Survey

  1. 2017 Land Market Survey
  2. National Association of REALTORS® Research Division Lawrence Yun, Ph.D. Senior Vice President & Chief Economist Danielle Hale, MS, Managing Director, Housing Research Gay Cororaton, MS, Research Economist REALTORS® Land Institute Aubrie Kobernus, MBA, Chief Executive Officer Jessa Friedrich, MBA, Marketing Manager Presented By
  3. President’s Message “As the 2017 National President of the REALTORS® Land Institute (RLI), “The Voice of Land,” I am proud to release this one of a kind report to the industry. The pertinent information included is an aggregation of survey results collected from land and commercial real estate professionals across the United States. Every year, in partnership with the National Association of REALTORS® (NAR) Research Department, RLI conducts and publishes this survey for the benefit of real estate professionals across the industry to use as a benchmarking resource. We want to thank everyone who took the time to contribute to this survey, as well as, NAR for continuing to support our efforts to bring vital information to brokers and agents across the country. For a digital copy of the survey and more information, please visit rliland.com/land-markets-survey” -Brandon Rogillio, ALC 2017 RLI National President
  4. About the Survey Objective  To gather information about land transactions among land real estate professionals during the reference period of October 2015–September 2016 and on their outlook for the period October 2016–September 2017. Timeframe  NAR + RLI conducted the online survey from October 5– November 22, 2016. Participants  614 respondents (614 in the October 2015 survey), 505 of which closed a land transaction. Note: The REALTORS® Land Institute sent out the survey to 13,388 members and prospective members. NAR conducted the online survey from October 5–November 22, 2016. To correct for under- and over-response across regions and countries, NAR weighted the sample responses by a factor that aligns the regional distribution of responses to the regional distribution of members and non-members provided by REALTORS® Land Institute (see Technical Appendix, last page).
  5. SurveyRegions
  6. Respondent Distribution 93 117 218 212 117 47 73 120 150 183 107 28 56 8 52 97 124 143 90 36 56 4 12 66 115 148 161 63 25 31 0 5 Number of Respondents by Main Business Region Jul 2014 Survey Feb 2015 Survey Oct 2015 Survey Oct 2016 Survey Comparative Distribution of Respondents by Main Business Region in the Various Surveys.
  7. Professional Membership of Respondents *Multiple responses allowed so percent shares will not sum up to 100 percent during survey period. 63% 80% 13% 35% 52% 76% 10% 31% 61% 70% 8% 21% 59% 73% 9% 30% REALTORS® Land Institute NAR CCIM Other Jul 2014 Survey Feb 2015 Survey Oct 2015 Survey Oct 2016 Survey
  8. Survey Highlights  Recreational and residential land accounted for about 50% of U.S. closed land transactions between October 2015‒September 2016.  On average, the dollar volume of U.S. land sales increased by 2% between October 2015‒September 2016 compared to the previous 12-month period (2% in the October 2015 survey). ◦ Sales increased the most for timber land at 5% and residential land at 4%. ◦ Agricultural irrigated land sales fell by 1%. ◦ Commercial land sales rose at a slower pace of 1% (compared to 3% in the October 2015 survey).
  9. Survey Highlights Continued…  On average, U.S. land prices (in dollars per acre) rose at a slower pace of 1% from September 2015 to September 2016 versus 2% in the prior year (in part due to the decline in agricultural land prices). ◦ Prices of agricultural irrigated land decreased by 1% and non-irrigated land by 2%, likely related to the slump in commodity prices. ◦ Land prices increased the most for timber land at 5% and residential land at 3%. ◦ Commercial land prices rose at a slower pace of 1%(compared to four percent in the October 2015 survey).
  10. Survey Highlights Continued…  On average, respondents expect U.S. land sales volumes to increase by 2% between October 2016‒September 2017 compared to the October 2015‒September 2016 period. ◦ Timber, residential, and greenfield development land are expected to post the strongest growth rates at 3%. ◦ Agricultural non-irrigated land sales are expected to grow by 1% and sales for agricultural irrigated land are expected to remain the same as in 2016.
  11. Survey Highlights Continued…  On average, respondents expect U.S. land prices (in dollars per acre) to increase at a modest pace of 1% from September 2016 to September 2017. ◦ Timber and residential land prices are expected to post the highest increases, each at 3%. ◦ Agricultural land prices are expected to decline by 2%. ◦ Commercial land prices are expected to increase by 1%.
  12. Survey Highlights Continued…  Across the regions, most land transactions were: ◦ Region 1: residential, recreational, non- irrigated agricultural ◦ Region 2: non-irrigated agricultural, recreational ◦ Region 3: recreational, timber, and residential ◦ Region 4: recreational, ranch ◦ Region 5: ranch, irrigated agricultural, recreational ◦ Region 6: residential, ranch, commercial, irrigated, agricultural  Individual/family buyers were the major buyers and sellers of U.S. land, with Region 1 accounting for the largest share of individual/family buyers (35%)and sellers (26%).
  13. Survey Highlights Continued…  The acreage of U.S. land sold was typically 75 acres; ranch lands were typically 200 acres, while residential lands were typically 5 acres.  U.S. lands for sale were typically sold within 100 days. Land sold more quickly in Regions 2 and 4 and for agricultural non-irrigated, timber, and recreational lands.  On average, buyers of U.S. land financed 32% of the value of the property (or made a 68% down payment).  Irrigated lands accounted for 10% of U.S. land sales. Nearly half of all irrigated land sales were in Region 5 (43%).  Mineral rights were conveyed in 68% of U.S. land sales.
  14. U.S. Land Sales
  15. Distribution of Closed Land Transactions Percentage Distribution of Closed Land Transactions Among Members with Primary Business in the United States. 51% of U.S. Land Sales Were Recreational and Residential Lands. 26% 25% 14% 11% 8% 7% 6% 3%
  16. Average Change in Dollar Volume Average Percent Change in the Dollar Volume of U.S. Land Sold from October 2015‒September 2016 Compared to October 2014‒September 2015. Dollar Volume Rose by 2%: Strong Timber and Residential Land Sales and Weak Agricultural Land Sales. 2% 5% -1% 2% 1% 1% 3% 0% 0% 3% 2% 5% 4% 2% 2% 2% 1% 1% 0% -1% 1% 2% Oct 2015 Survey Oct 2016 Survey
  17. Average Change in Price of Land Sold Average Percent Change in the Price of U.S. Land Sold in Dollars Per Acre from September 2015‒September 2016. 2% 2% 2% 2% 2% 0% 4% 0% 0% 3% 2% 5% 3% 2% 1% 1% 1% 1% -1% -2% -3% 1% Oct 2015 Survey Oct 2016 Survey
  18. Commodity Price Indices Commodity Price Declines in 2015–2016 Likely Affected Agricultural Land Prices. Source: Standard & Poor's, downloaded from Haver Analytics. 100 200 300 400 500 600 700 201208 201210 201304 201306 201308 201310 201403 201406 201408 201410 201503 201506 201508 201510 201604 201606 201608 201610 Commodity Price Indices S&P GSCI Livestock Nearby Index (Jan-2-70=100) S&P GSCI Grains Index (Jan-5-70=100)
  19. Quarterly New I-Unit Family Housing *Starts in thousands. More Housing Construction Between 2015‒2016 Likely Boosted Residential Land Sales and Prices. Source: Census Bureau, downloaded from Haver Analytics. 0 50 100 150 200 250 20121 20122 20123 20124 20131 20132 20133 20134 20141 20142 20143 20144 20151 20152 20153 20154 20161 20162 20163 United States Northeast Midwest South West
  20. Expected Change in Dollar Volume of U.S. Land Sales Average Expected Change in the Dollar Volume of U.S. Land Sales from October 2016– September 2017 Compared to October 2015–September 2016. Respondents Expect Dollar Volume to Increase 2% by September 2017 with Strong Gains in Timber, Development, and Residential Land. 3% 3% 3% 2% 2% 1% 1% 1% 0% 2% 2%
  21. Expected Change in Price of U.S. Land Sold Average Expected Change in the Price of U.S. Land (in Dollars Per Acre) from September 2016–September 2017 3% 3% 2% 2% 1% 1% 1% -2% -2% 2% 1%
  22. U.S. Land Sales
  23. Distribution of U.S. Land Sales Region 1 (the Northeast) Accounted for the Highest Share of U.S. Land Sales. 29% 14% 17% 17% 20% 3% 29% 14% 18% 18% 17% 4% Region 1 Region 2 Region 3 Region 4 Region 5 Region 6 Oct 2015 Survey Oct 2016 Survey
  24. Types of Buyers of U.S. Land Based on the type of the most recent buyer. Multiple responses are allowed, so the distribution will not sum to 100 percent. 45% 12% 8% 15% 1% 64% 14% 12% 20% 6% Oct 2015 Survey Oct 2016 Survey
  25. Location of U.S. Land Purchased by Individual/Family Buyers Based on the most recent sale of the respondents, Region 1 Accounted for the Largest Share of Individual/Family Buyers. 26% 12% 17% 19% 23% 3% 35% 8% 16% 16% 18% 7% Region 1 Region 2 Region 3 Region 4 Region 5 Region 6 Oct 2015 Survey Oct 2016 Survey
  26. Type of Sellers of U.S. Land Based on the type of the most recent seller. Multiple responses are allowed so the responses will not sum up to 100 percent. Individuals/Family Buyers Accounted for 76 Percent of Respondent U.S. Land Sellers. 55% 9% 3% 9% 0% 3% 76% 10% 2% 11% 0% 2% Oct 2015 Survey Oct 2016 Survey
  27. Location of U.S. Land Sold by Individual/Family Sellers Based on the most recent sale of the respondents, Region 1 Accounted for the Largest Share of Individual/Family Sellers. 27% 15% 17% 17% 20% 4% 26% 15% 19% 19% 17% 3% Region 1 Region 2 Region 3 Region 4 Region 5 Region 6 Oct 2015 Survey Oct 2016 Survey
  28. Types of U.S. Land Sold by Region The estimates for Region 6 are based on less than 30 observations. 3% 2% 9% 15% 23%21% 53% 6% 11% 14% 10% 6% 12% 4% 5% 23% 4% 3% 8%3% 2% 3% 22% 32% 23% 28% 23% 28% 35% 15%31% 6% 22% 10% 3% 31% 5% 8% 24% 6% 8% Region 1 Region 2 Region 3 Region 4 Region 5 Region 6* Agricultural, irrigated Agricultural, non-irrigated Commercial Development, brownfield Development, greenfield Ranch
  29. Types of U.S. Land Sold by Region  Across the regions, most land transactions were: ◦ Region 1: residential, recreational, non- irrigated agricultural ◦ Region 2: non-irrigated agricultural, recreational ◦ Region 3: recreational, timber, and residential ◦ Region 4: recreational, ranch ◦ Region 5: ranch, irrigated agricultural, recreational ◦ Region 6: residential, ranch, commercial, irrigated agricultural
  30. Median Acreage of U.S. Land Sold by Region 44 98 82 104 129 64 81 20 80 103 113 61 20 80 42 80 91 80 39 20 65 57 85 47 93 80 46 75 Region 1 Region 2 Region 3 Region 4 Region 5 Region 6* United States July 2014 Survey Feb 2015 Survey Oct 2015 Survey Oct 2016 Survey Based on the most recent sale of the respondents. The estimates for Region 6 are based on less than 30 observations. Lands Sold in Regions 2, 4, and 5 Were Typically Larger: These Regions Have More Ranch and Non-Irrigated Agricultural Land Sales.
  31. Median Acreage of U.S. Land Sold by Type Based on the most recent sale of the respondents. Median acreage of agricultural irrigated land, development land, commercial land, and other types of land are not shown separately due to very small sample size, but the responses are used in calculating the median acreage of all land sold in the United States. Acreage of U.S. Land Sold Rose to 75 Acres: Ranch, Agricultural, and Timber Lands Tend to be Larger Than Other Types of Land. 160 120 141 100 8 65 200 116 110 80 5 75 Ranch Agricultural, non-irrigated Timber Recreational Residential United States Oct 2015 Survey Oct 2016 Survey
  32. Median Days on Market of Land Sold by Region Based on the most recent sale of the respondents. Estimates for Region 6 are based on less than 30 observations. U.S. Land Sold Typically Within 100 Days with Fewer Days on Market for Regions 2 and 4 Which Have More Non-Irrigated Agricultural and Recreational Land Sales. 194 60 150 120 200 111 120 135 60 160 120 210 200 120 100 62 120 90 160 78 100 135 45 125 60 120 90 100 Region 1 Region 2 Region 3 Region 4 Region 5 Region 6* United States Jul 2014 Survey Feb 2015 Survey Oct 2015 Survey Oct 2016 Survey
  33. Median Days on Market of Land Sold by Type Based on the most recent sale of the respondent. Data for agricultural irrigated land, development land, commercial land, and other types of land are not shown separately due to very small sample size, but the responses are used in calculating the median acreage of all land sold in the United States. 60 126 120 100 180 100 75 150 90 120 85 100 Agricultural, non-irrigated Ranch Recreational Residential Timber United States Oct 2015 Survey Oct 2016 Survey
  34. Average Financing of U.S. Land Sold Based on the most recent sale of the respondent. Data for agricultural irrigated land, development land, commercial land, and other types of land are not shown separately due to very small sample size, but the responses are used in calculating the percent financing of all land sold in the United States. On Average, Buyers Financed 32% of the Value of the Land Purchased in the United States. 30% 33% 33% 27% 16% 29% 42% 38% 34% 31% 22% 32% Agricultural, non-irrigated Residential Recreational Ranch Timber United States Oct 2015 Survey Oct 2016 Survey
  35. Irrigated to Total Land Sales Comparison *Based on the most recent sale of the respondents. Estimates for Region 6 are based on less than 30 observations. 2% 5% 10% 9% 41% 18% 9% 7% 7% 9% 8% 33% 31% 24% 7% 4% 4% 11% 34% 48% 28% 7% 2% 4% 8% 38% 38% 10% Region 1 Region 2 Region 3 Region 4 Region 5 Region 6* United States Jul 2014 Survey Feb 2015 Survey Oct 2015 Survey Oct 2016 Survey
  36. Land Sales With Mineral Rights Conveyed Based on the most recent sale of the respondents. Estimates for Region 6 are based on less than 30 observations, Nearly 70% of U.S. Lands Sold Had Mineral Rights Conveyed, With Greater Frequency in Regions 1,2,3. 53% 76% 68% 53% 51% 57% 60% 68% 75% 71% 56% 53% 50% 64% 57% 77% 79% 68% 40% 42% 61% 76% 72% 77% 61% 54% 42% 68% Region 1 Region 2 Region 3 Region 4 Region 5 Region 6* United States July 2014 Survey Feb 2015 Survey Oct 2015 Survey Oct 2016 Survey
  37. Survey Conclusions  Respondents who conducted most of their business in the U.S. between October 2015‒September 2016 reported modest price and sales growth. ◦ Timber and residential land sales had the strongest growth, while sales of agricultural lands fell. ◦ Demand for housing appeared to have boosted residential land sales, while falling commodity prices negatively impacted agricultural land sales.  In the next 12 months, respondents expect dollar volume of sales to increase at an average of 2% and prices to increase at an average of 1%. ◦ Timber, development, and residential land are expected to continue to be the bright spots, while agricultural land sales are expected to stay essentially flat.
  38. Technical Appendix  This graph compares the distribution of the sample of respondents based on their self- identified region (“sample”) to the distribution of the members and prospective members based on their regional classification provided by the REALTORS® Land Institute (‘’population”). The chart shows an under-response in Regions 1, 5, and 6.
  39. Technical Appendix Continued  To align the distribution across regions of the sample to the distribution across regions of the target population, each respondent was given a weight factor based on the respondent’s region of primary business which the respondent self- identified in the survey. The weight is calculated as: ◦ Weight of region i = percent share of region i based on the target distribution percent share of region i based on the sample distribution  In cases of under-response, the weight will be greater than 1 (Regions 1, 5, and 6). In cases of over-response, the weight will be less than 1 (Regions 2, 3, 4, Canada, Other International).  Each response is then multiplied by the appropriate weight factor based on the respondent’s indicated region of primary business.
  40. Thank You  The REALTORS® Land Institute, “The Voice of Land,” provides the expertise, camaraderie, and resources that are the foundation for all land real estate professionals to become the best in the business. The RLI continually strives to maintain its status as the acknowledged leader for all matters pertaining to the land real estate profession is the essential membership organization for the extraordinary real estate professionals who broker, lease, sell, develop, and manage our most precious resource: the land.  The NATIONAL ASSOCIATION of REALTORS®, “The Voice for Real Estate,” is America’s largest trade association, representing over 1 million members, including NAR’s institutes, societies, and councils, involved in all aspects of the real estate industry.  The NATIONAL ASSOCIATION of REALTORS® Research Division collects and disseminates timely, accurate, and comprehensive real estate data and to conduct economic analysis in order to inform and engage members, consumers, policy makers, and the media in a professional and accessible manner. REALTORS® Land Institute 430 N. Michigan Avenue Chicago, IL 60611 United States Phone: 800-441-5263 rliland.com NATIONAL ASSOCIATION of REALTORS® Research Division 500 New Jersey Avenue, NW Washington, DC 20001 Phone: 202-383-1000 Realtor.org

Editor's Notes

  1. Hint: Choose your own images and crop to fit where needed throughout this slide deck. Note: Always follow visual standards guidelines when creating a PPT in this template.
Advertisement