SlideShare a Scribd company logo
1 of 23
Download to read offline
Journal of Economic Perspectives—Volume 26, Number 4—Fall 2012—Pages 103–124
TT
he pace and scale of China’s economic transformation have no historicalhe pace and scale of China’s economic transformation have no historical
precedent. In 1978, China was one of the poorest countries in the world.precedent. In 1978, China was one of the poorest countries in the world.
The real per capita GDP in China was only one-fortieth of the U.S. levelThe real per capita GDP in China was only one-fortieth of the U.S. level
and one-tenth the Brazilian level. Since then, China’s real per capita GDP hasand one-tenth the Brazilian level. Since then, China’s real per capita GDP has
grown at an average rate exceeding 8 percent per year. As a result, China’s real pergrown at an average rate exceeding 8 percent per year. As a result, China’s real per
capita GDP is now almost one-fifth the U.S. level and at the same level as Brazil.capita GDP is now almost one-fifth the U.S. level and at the same level as Brazil.
This rapid and sustained improvement in average living standard has occurred in aThis rapid and sustained improvement in average living standard has occurred in a
country with more than 20 percent of the world’s population so that China is nowcountry with more than 20 percent of the world’s population so that China is now
the second-largest economy in the world.the second-largest economy in the world.
To set the stage in this paper, I will begin by discussing briefly China’s historicalTo set the stage in this paper, I will begin by discussing briefly China’s historical
growth performance: that is, how China went from the world’s leading economicgrowth performance: that is, how China went from the world’s leading economic
power about 900 years ago to a situation in which it essentially missed the Indus-power about 900 years ago to a situation in which it essentially missed the Indus-
trial Revolution and had close-to-zero growth in per capita GDP from 1800 to 1950.trial Revolution and had close-to-zero growth in per capita GDP from 1800 to 1950.
I then present growth accounting results for the period from 1952 to 1978 and theI then present growth accounting results for the period from 1952 to 1978 and the
period since 1978, using as my starting point a standard growth accounting exerciseperiod since 1978, using as my starting point a standard growth accounting exercise
that decomposes the sources of growth into capital deepening, labor deepening,that decomposes the sources of growth into capital deepening, labor deepening,
and productivity growth. For the period from 1952 to 1978, China’s per capita GDPand productivity growth. For the period from 1952 to 1978, China’s per capita GDP
did rise by about 3 percent per year, but all of the growth was due to forced increasesdid rise by about 3 percent per year, but all of the growth was due to forced increases
in government investment as well as a rise in education levels. Productivity actu-in government investment as well as a rise in education levels. Productivity actu-
ally regressed during this period, as China’s economy went through the enormousally regressed during this period, as China’s economy went through the enormous
disruptions of the famine in the late 1950s and the Cultural Revolution startingdisruptions of the famine in the late 1950s and the Cultural Revolution starting
in the late 1960s. But the main focus of this paper will be to examine the sourcesin the late 1960s. But the main focus of this paper will be to examine the sources
of growth since 1978, the year when China started economic reform. Perhapsof growth since 1978, the year when China started economic reform. Perhaps
Understanding China’s Growth: Past,
Present, and Future
■■ Xiaodong Zhu is Professor of Economics, University of Toronto, Toronto, Ontario, Canada.
His email address is xzhu@chass.utoronto.ca.
http://dx.doi.org/10.1257/jep.26.4.103. doi=10.1257/jep.26.4.103
Xiaodong Zhu
104 Journal of Economic Perspectives
surprisingly, given China’s well-documented sky-high rates of saving and investment,surprisingly, given China’s well-documented sky-high rates of saving and investment,
I will argue that China’s rapid growth over the last three decades has been drivenI will argue that China’s rapid growth over the last three decades has been driven
by productivity growth rather than by capital investment. The growth contributionsby productivity growth rather than by capital investment. The growth contributions
made by human capital accumulation and an increase in labor participation aremade by human capital accumulation and an increase in labor participation are
positive but modest. I will also examine the contributions of sector-level productivitypositive but modest. I will also examine the contributions of sector-level productivity
growth, and of resource reallocation across sectors and across firms within a sector,growth, and of resource reallocation across sectors and across firms within a sector,
to aggregate productivity growth. Overall, gradual and persistent institutionalto aggregate productivity growth. Overall, gradual and persistent institutional
change and policy reforms that have reduced distortions and improved economicchange and policy reforms that have reduced distortions and improved economic
incentives are the main reasons for the productivity growth.incentives are the main reasons for the productivity growth.
Despite the rapid growth of the last three decades, China’s productivity is stillDespite the rapid growth of the last three decades, China’s productivity is still
only 13 percent of the U.S. level, which suggests that China still has plenty of roomonly 13 percent of the U.S. level, which suggests that China still has plenty of room
for productivity growth through further economic reforms. Even if China can repli-for productivity growth through further economic reforms. Even if China can repli-
cate its extraordinary growth performance for another two decades, its productivitycate its extraordinary growth performance for another two decades, its productivity
would still be only around 40 percent of the frontier productivity level.would still be only around 40 percent of the frontier productivity level.
Before delving into the analysis, let me first mention the three main data sourcesBefore delving into the analysis, let me first mention the three main data sources
that I use for this paper. For examining China’s historical performance, I use the datathat I use for this paper. For examining China’s historical performance, I use the data
constructed by Madison (2007); for comparing China with other countries, I use theconstructed by Madison (2007); for comparing China with other countries, I use the
purchasing power parity data from Penn World Table (PWT7.0); and for detailedpurchasing power parity data from Penn World Table (PWT7.0); and for detailed
growth accounting exercises, I mainly use the data series my coauthor and I constructedgrowth accounting exercises, I mainly use the data series my coauthor and I constructed
for Brandt and Zhu (2010), in which we made adjustments to China’s official statisticsfor Brandt and Zhu (2010), in which we made adjustments to China’s official statistics
by using alternative deflators and information from household surveys.by using alternative deflators and information from household surveys.
China’s Historical Economic Performance
China was a world economic and technological leader in the “premodern” era.China was a world economic and technological leader in the “premodern” era.
Many historians think that China’s premodern economic performance reached aMany historians think that China’s premodern economic performance reached a
peak in the Song Dynasty (circa 1200) when China is though to have had the mostpeak in the Song Dynasty (circa 1200) when China is though to have had the most
advancedtechnologies(NeedhamandRonan1978),thehighestironoutput(Hartwelladvancedtechnologies(NeedhamandRonan1978),thehighestironoutput(Hartwell
1962), the highest urbanization rate (Chao 1986), and the largest national economy1962), the highest urbanization rate (Chao 1986), and the largest national economy
(Madison 2007) in the world. However, sometime between 1500 and 1800, China lost(Madison 2007) in the world. However, sometime between 1500 and 1800, China lost
its leadership position to Western Europe. Figure 1 plots Angus Madison’s estimatesits leadership position to Western Europe. Figure 1 plots Angus Madison’s estimates
of per capita GDP for China and Western Europe. According to his estimates, China’sof per capita GDP for China and Western Europe. According to his estimates, China’s
per capita GDP stagnated between 1500 and 1800 while Western Europe’s per capitaper capita GDP stagnated between 1500 and 1800 while Western Europe’s per capita
GDP increased steadily during the same period. These estimates suggest that, by theGDP increased steadily during the same period. These estimates suggest that, by the
end of the fifteenth century, China had already started to fall behind Western Europe,end of the fifteenth century, China had already started to fall behind Western Europe,
wellwell before the Industrial Revolution occurred in England. Some historians and econo-the Industrial Revolution occurred in England. Some historians and econo-
mists attribute China’s falling behind during this period to the more centralized andmists attribute China’s falling behind during this period to the more centralized and
inward-looking political systems of the Ming (1368–1644) and Qing (1644–1911)inward-looking political systems of the Ming (1368–1644) and Qing (1644–1911)
dynasties that stifled innovation and commercial activities in China.dynasties that stifled innovation and commercial activities in China.
Not all economic historians agree with this explanation. Kenneth PomeranzNot all economic historians agree with this explanation. Kenneth Pomeranz
(2000) argues in(2000) argues in The Great Divergence that in the eighteenth century, living stan-that in the eighteenth century, living stan-
dards and the degree of commercialization in China’s Lower Yangzi region weredards and the degree of commercialization in China’s Lower Yangzi region were
comparable to those in the richest parts of Europe and that China only startedcomparable to those in the richest parts of Europe and that China only started
Xiaodong Zhu 105
to fall behind Western Europeto fall behind Western Europe after the Industrial Revolution in England. Shiuethe Industrial Revolution in England. Shiue
and Keller (2007) provide evidence that in the late eighteenth century, the degreeand Keller (2007) provide evidence that in the late eighteenth century, the degree
of market integration was higher in the Lower Yangzi region than in continentalof market integration was higher in the Lower Yangzi region than in continental
Europe and only slightly lower than that in England. Instead of asking what wentEurope and only slightly lower than that in England. Instead of asking what went
wrong in China, Pomeranz attributes the success of the Industrial Revolution towrong in China, Pomeranz attributes the success of the Industrial Revolution to
two lucky breaks for England: accesses to coal and colonies.two lucky breaks for England: accesses to coal and colonies.
The questions of why China was not able to maintain its technological lead and theThe questions of why China was not able to maintain its technological lead and the
exact time when China started to fall behind Western Europe remain unresolved. Thereexact time when China started to fall behind Western Europe remain unresolved. There
is no doubt, however, about the great divergence in economic performance betweenis no doubt, however, about the great divergence in economic performance between
China and Western Europe in the nineteenth century and the first half of the twentiethChina and Western Europe in the nineteenth century and the first half of the twentieth
century. Brandt, Ma, and Rawski (2012) review the debates over possible causes and thecentury. Brandt, Ma, and Rawski (2012) review the debates over possible causes and the
related literature. They argue that China’s economic failure during this time periodrelated literature. They argue that China’s economic failure during this time period
was due to an imperial political-institutional system that protected vested interests ofwas due to an imperial political-institutional system that protected vested interests of
elite groups—like imperial households, members of bureaucracy, and local gentry—elite groups—like imperial households, members of bureaucracy, and local gentry—
who in turn were resistant to adoptions of new technologies. This imperial system waswho in turn were resistant to adoptions of new technologies. This imperial system was
significantly weakened and eventually collapsed after two Opium Wars between Chinasignificantly weakened and eventually collapsed after two Opium Wars between China
and Great Britain in the 1840s and 1850s and the Sino-Japanese War of 1894–95. Theand Great Britain in the 1840s and 1850s and the Sino-Japanese War of 1894–95. The
series of Chinese defeats was in effect a forced opening of China’s borders, and it ledseries of Chinese defeats was in effect a forced opening of China’s borders, and it led
to territories and treaty ports being conceded to the West and to Japan. These changesto territories and treaty ports being conceded to the West and to Japan. These changes
brought to China industrial technologies and factories, but continuous civil wars andbrought to China industrial technologies and factories, but continuous civil wars and
World War II prevented the industrialization process from gaining much momentumWorld War II prevented the industrialization process from gaining much momentum
in China until the 1950s. Indeed, industrialization had so little effect during this timein China until the 1950s. Indeed, industrialization had so little effect during this time
that China’s per capita GDPthat China’s per capita GDP declined between 1800 and 1950.between 1800 and 1950.
Figure 1
Per capita GDP of China and Western Europe
Source: Madison (2007).
100
1,000
10,000
100,000
1500 1550 1600 1650 1700 1750 1800 1850 1900 1950 2000
Western Europe
China
1990internationaldollars(logarithmicscale)
106 Journal of Economic Perspectives
A Growth Accounting Decomposition for Modern China
After the establishment of the People’s Republic in October 1949, China finallyAfter the establishment of the People’s Republic in October 1949, China finally
started its industrialization process in the early 1950s. However, growth perfor-started its industrialization process in the early 1950s. However, growth perfor-
mance before and after 1978 differs significantly. Prior to 1978, the average growthmance before and after 1978 differs significantly. Prior to 1978, the average growth
rate of real per capita GDP was a modest 3 percent a year, not much different fromrate of real per capita GDP was a modest 3 percent a year, not much different from
the growth rate in the United States though starting from a much lower base.the growth rate in the United States though starting from a much lower base.
Since 1978, China’s growth in per capita GDP has accelerated to a rate in excess ofSince 1978, China’s growth in per capita GDP has accelerated to a rate in excess of
8 percent per year, and Figure 2 shows (on a log scale) how China’s per capita GDP8 percent per year, and Figure 2 shows (on a log scale) how China’s per capita GDP
has begun to close the gap with U.S. per capita GDP.has begun to close the gap with U.S. per capita GDP.
Why did China’s growth performance differ so much before and after 1978? ToWhy did China’s growth performance differ so much before and after 1978? To
answer this question, I begin in this section by using the standard growth accountinganswer this question, I begin in this section by using the standard growth accounting
method to take a look at the sources of China’s growth in both periods, which showsmethod to take a look at the sources of China’s growth in both periods, which shows
that capital accumulation was the main source of economic growth in the 1952–1978that capital accumulation was the main source of economic growth in the 1952–1978
period while productivity growth has been the main source of growth since then.period while productivity growth has been the main source of growth since then.
In the next two sections, I offer more details on these two periods, including whyIn the next two sections, I offer more details on these two periods, including why
the capital-investment-led growth of the 1952–1978 period was unsustainable andthe capital-investment-led growth of the 1952–1978 period was unsustainable and
came at such a high cost to the country, and what has been underlying the rapidcame at such a high cost to the country, and what has been underlying the rapid
productivity growth since 1978.productivity growth since 1978.
Let the relationship between production inputs (physical capital, humanLet the relationship between production inputs (physical capital, human
capital, and labor) and GDP be represented by a standard Cobb–Douglas produc-capital, and labor) and GDP be represented by a standard Cobb–Douglas produc-
tion function:tion function:
Y = AKα
(hL)1–α
.
Figure 2
GDP per capita of China and US: 1952–2009
100
1,000
10,000
100,000
1952
2005internationaldollar(logarithmicscale)
Pre-reform period Reform period
2009
1957
1962
1967
1972
1977
1982
1987
1992
1997
2002
2007
United States
China
Understanding China’s Growth: Past, Present, and Future 107
Here Y is GDP, K is physical capital stock, L is labor (number of workers), h is the
average level of human capital, A is total factor productivity (TFP), and α is the output
elasticity of physical capital, which is usually measured by capital’s share of national
income. Hall and Jones (1999) show how to use this framework to calculate per capita
GDP,1
while Kehoe and Prescott (2002) note that in this framework the growth rate of
per capita GDP can be decomposed as the sum of four terms:
Growth rate of per capita GDP = growth rate of labor participation rate
+ α/(1 – α) growth rate of the capital/output ratio
+ growth rate of average human capital
+ 1/(1 – α) growth rate of total factor productivity.
Note that in this decomposition the contribution of total factor productivity growth is
weighted by 1/(1 – α), taking into account both the direct contribution of total factor
productivity and the indirect contribution through its impact on capital accumulation.
For Table 1, I will set the value ofFor Table 1, I will set the value of α to 1to 1//2 (as in Brandt, Hsieh, and Zhu 2008)2 (as in Brandt, Hsieh, and Zhu 2008)
to match China’s average capital income share as reported in China’s nationalto match China’s average capital income share as reported in China’s national
accounts. With this assumption in place, Table 1 presents a decomposition of China’saccounts. With this assumption in place, Table 1 presents a decomposition of China’s
per capita GDP growth into contributions from growth of the labor participationper capita GDP growth into contributions from growth of the labor participation
rate, the capital/output ratio, average human capital, and total factor productivity.rate, the capital/output ratio, average human capital, and total factor productivity.22
This decomposition reveals very different patterns of growth in the two periods.This decomposition reveals very different patterns of growth in the two periods.
In the pre-1978 period, growth was mainly coming from increases in both physicalIn the pre-1978 period, growth was mainly coming from increases in both physical
and human capital rather than increases in productive efficiency. Total factorand human capital rather than increases in productive efficiency. Total factor
productivity actually deteriorated during this period, declining by 1.07 percent perproductivity actually deteriorated during this period, declining by 1.07 percent per
year. Due to the increases in average schooling years, average human capital grewyear. Due to the increases in average schooling years, average human capital grew
at 1.55 percent a year, partially offseting the reduction in total factor productivity.at 1.55 percent a year, partially offseting the reduction in total factor productivity.
1
Specifically, Hall and Jones (1999) show that in this Cobb–Douglas framework one can express the GDP
per capita in the following way:
Y_
Pop
=
L_
Pop (K_
Y )
α_
1–α
hA
1_
1–α .
In this formulation, Pop is the population. GDP per capita can thus be calculated as the product of four
terms: the labor participation rate, the capital/output ratio raised to the power of α/(1 – α), the average
level of human capital, and total factor productivity raised to the power of 1/(1 – α) . The other variables
are defined in the text.
2
The data on GDP per capita, GDP per worker, and labor participation rate are taken from the Penn
World Table (PWT7.0). The Penn World Table contains two versions of data for China. I use version 1
because it is more consistent with the series we constructed for Brandt and Zhu (2010) using China’s
national accounts data, with adjustments made to deflators in a way that is similar to what Alwyn Young
(2003) did for the data over a shorter period of time. The physical capital stock data are constructed
using the real investment data from the PWT7.0 and the perpetual inventory method with a depreciation
rate of 0.06. The initial capital stock in 1952 was set to I52/(0.06 + ln(I57/I52)/5), where It is the real
investment in year t. The average level of human capital is constructed using the average schooling years
reported in the Barro and Lee (2010) dataset and the method of Hall and Jones (1999).
108 Journal of Economic Perspectives
The labor participation rate increased slightly, growing at 0.11 percent a year. TheThe labor participation rate increased slightly, growing at 0.11 percent a year. The
most important source of growth was increases in the physical capital/output ratio,most important source of growth was increases in the physical capital/output ratio,
which on average grew 3.45 percentage points a year and accounted for 116 percentwhich on average grew 3.45 percentage points a year and accounted for 116 percent
of the per capita GDP growth.of the per capita GDP growth.
After 1978, capital accumulation and total factor productivity growth reversedAfter 1978, capital accumulation and total factor productivity growth reversed
their roles. Between 1978 and 2007, the physical capital/output ratio remainedtheir roles. Between 1978 and 2007, the physical capital/output ratio remained
roughly constant and the average human capital growth rate was lower than theroughly constant and the average human capital growth rate was lower than the
growth rate in the pre-1978 period. The two sources combined contributed togrowth rate in the pre-1978 period. The two sources combined contributed to
around 15 percent of the growth in per capita GDP. Demographic factors played aaround 15 percent of the growth in per capita GDP. Demographic factors played a
very limited role. Partly due to the one child policy, the labor participation rate grewvery limited role. Partly due to the one child policy, the labor participation rate grew
at 0.57 percent a year during this period, faster than in the pre-1978 period. But theat 0.57 percent a year during this period, faster than in the pre-1978 period. But the
contribution of the increases in labor participation rate was still modest, accountingcontribution of the increases in labor participation rate was still modest, accounting
for only about 7 percent of the growth. In contrast, total factor productivity grewfor only about 7 percent of the growth. In contrast, total factor productivity grew
rapidly at 3.16 percent a year. (Bosworth and Collins, 2008, in this journal, andrapidly at 3.16 percent a year. (Bosworth and Collins, 2008, in this journal, and
Perkins and Rawski, 2008, report similar results in their growth accounting exer-Perkins and Rawski, 2008, report similar results in their growth accounting exer-
cises.) Since the contribution of total factor productivity growth is weighted bycises.) Since the contribution of total factor productivity growth is weighted by
1/(1 –1/(1 – αα) and) and αα is 0.5, the growth contribution of total factor productivity growth isis 0.5, the growth contribution of total factor productivity growth is
22 ×× 3.163.16 == 6.32 percentage points, or 78 percent of the growth in GDP per capita.6.32 percentage points, or 78 percent of the growth in GDP per capita.
The finding that aggregate productivity growth has been the most importantThe finding that aggregate productivity growth has been the most important
source of China’s growth since 1978 may seem surprising because it runs in thesource of China’s growth since 1978 may seem surprising because it runs in the
face of a popular view that China has followed anface of a popular view that China has followed an investment-driven growth modelgrowth model
that relied heavily on capital-deepening for growth over the last three decades (forthat relied heavily on capital-deepening for growth over the last three decades (for
Table 1
Decomposing China’s Growth: 1952–2007
Average annual growth rates (%)
Period
GDP per capita
Labor partication
rate
Capital/output
ratio
Average human
capital TFP
1952–1978 2.97 0.11 3.45 1.55 –1.07
1978–2007 8.12 0.57 0.04 1.18 3.16
Contributions to per capita GDP growth
Period
GDP per capita
Labor partication
rate
Capital/output
ratio
Average human
capital TFP
1952–1978 100 3.63 116.15 52.25 –72.03
1978–2007 100 7.05 0.51 14.55 77.89
Source: Authors calculations. The data on GDP per capita, GDP per worker, and labor participation
rate are taken from the Penn World Table (PWT7.0). The average level of human capital is
constructed using the average schooling years reported in the Barro and Lee (2010) dataset. See
footnote 2 for details.
Notes: Table 1 presents a decomposition of China’s per capita GDP growth into contributions from
growth of labor participation rate, capital/output ratio, average human capital, and total factor
productivity. “TFP” is total factor productivity. See text for details.
Xiaodong Zhu 109
example, Wolf 2011). But, although the share of annual GDP that flows to real fixedexample, Wolf 2011). But, although the share of annual GDP that flows to real fixed
capital investment in China increased from 33 percent to 39 percent between 1978capital investment in China increased from 33 percent to 39 percent between 1978
and 2007, China’s capital-to-output ratio barely increased during this time. China’sand 2007, China’s capital-to-output ratio barely increased during this time. China’s
capital investment since 1978 has been keeping up with its rapid rate of outputcapital investment since 1978 has been keeping up with its rapid rate of output
growth but not leading it. Examining the data between 1978 and 1998, Younggrowth but not leading it. Examining the data between 1978 and 1998, Young
(2003) also comes to the conclusion that capital deepening was(2003) also comes to the conclusion that capital deepening was not the source ofthe source of
China’s growth. As Solow (1956) taught us: persistent economic growth can onlyChina’s growth. As Solow (1956) taught us: persistent economic growth can only
come from growth in total factor productivity. More than three decades of rapidcome from growth in total factor productivity. More than three decades of rapid
economic growth in China would not have been possible without significant growtheconomic growth in China would not have been possible without significant growth
in aggregate total factor productivity.in aggregate total factor productivity.
Government-led Industrialization between 1952 and 1978
AfterthePeople’sRepublicofChinawasestablishedin1949,theChineseCommu-AfterthePeople’sRepublicofChinawasestablishedin1949,theChineseCommu-
nist Party government, like governments of many other countries at the time, thoughtnist Party government, like governments of many other countries at the time, thought
the most effective way to speed up the industrialization process was by increasingthe most effective way to speed up the industrialization process was by increasing
investment in heavy industries such as steel, concrete, and heavy machinery. China’sinvestment in heavy industries such as steel, concrete, and heavy machinery. China’s
government mobilized the resources for investment by limiting household consump-government mobilized the resources for investment by limiting household consump-
tion and setting low prices for agricultural goods so that forced savings and surplusestion and setting low prices for agricultural goods so that forced savings and surpluses
extracted from the agricultural sector could be used for investment in such industries.extracted from the agricultural sector could be used for investment in such industries.
This strategy of extensive growth based so heavily on capital accumulation wasThis strategy of extensive growth based so heavily on capital accumulation was
not sustainable and had grave welfare consequences. The big push towards industri-not sustainable and had grave welfare consequences. The big push towards industri-
alization during the Great Leap Forward years (1958–1960) not only failed to raisealization during the Great Leap Forward years (1958–1960) not only failed to raise
the GDP growth rate, it also had such disruptive effects on agricultural productionthe GDP growth rate, it also had such disruptive effects on agricultural production
that a severe famine occurred when China was hit by adverse weather shocks inthat a severe famine occurred when China was hit by adverse weather shocks in
1959 (Li and Yang 2005). The Great Leap Forward became the Great Leap Famine1959 (Li and Yang 2005). The Great Leap Forward became the Great Leap Famine
of 1959–1961, when the official statistics admit to 15 million deaths and unofficialof 1959–1961, when the official statistics admit to 15 million deaths and unofficial
estimates suggest double that number or more.estimates suggest double that number or more.
Despite these disastrous results, the Chinese government continued its unbal-Despite these disastrous results, the Chinese government continued its unbal-
anced growth strategy with only minor adjustments after the famine. Unfavorableanced growth strategy with only minor adjustments after the famine. Unfavorable
terms of trade were set on farm products, which effectively imposed heavy taxesterms of trade were set on farm products, which effectively imposed heavy taxes
on farmers. Theon farmers. The hukou or household registration system was implemented to keepor household registration system was implemented to keep
heavily taxed farmers from leaving rural areas. Furthermore, farmers were prohibitedheavily taxed farmers from leaving rural areas. Furthermore, farmers were prohibited
from engaging in any nonfarm activities. These policies initially helped to ensure thatfrom engaging in any nonfarm activities. These policies initially helped to ensure that
the government could extract surpluses from the agricultural sector to support thethe government could extract surpluses from the agricultural sector to support the
capital accumulation in the industrial sector. However, they also created incentivecapital accumulation in the industrial sector. However, they also created incentive
problems that significantly reduced the productivity of farmers. As a result, agricul-problems that significantly reduced the productivity of farmers. As a result, agricul-
tural output grew slowly. In the late 1970s, the agricultural sector included more thantural output grew slowly. In the late 1970s, the agricultural sector included more than
70 percent of China’s labor force but was not even able to provide China’s population70 percent of China’s labor force but was not even able to provide China’s population
with 2,300 calories per capita per day (near the UN-established minimum). Emer-with 2,300 calories per capita per day (near the UN-established minimum). Emer-
gency grain imports were frequently needed to meet food deficits (Huang, Otsuka,gency grain imports were frequently needed to meet food deficits (Huang, Otsuka,
and Rozelle 2008). China’s nonagricultural sector was little better. It was dominatedand Rozelle 2008). China’s nonagricultural sector was little better. It was dominated
by the state-owned enterprises in which resource allocation and production activitiesby the state-owned enterprises in which resource allocation and production activities
110 Journal of Economic Perspectives
were carried out according to government plan rather than market signals. Most ofwere carried out according to government plan rather than market signals. Most of
the state-owned enterprises at that time were inefficient, overflowing with redundantthe state-owned enterprises at that time were inefficient, overflowing with redundant
workers, and often producing output for which there was no market demand. At theworkers, and often producing output for which there was no market demand. At the
same time, there were very few firms in the light industries like home appliances,same time, there were very few firms in the light industries like home appliances,
furniture, and clothing, and there were constant shortages of consumer products.furniture, and clothing, and there were constant shortages of consumer products.
Given this background, it may seem paradoxical that China’s economyGiven this background, it may seem paradoxical that China’s economy
managed an average per capita GDP growth rate of even 3 percent from 1952 tomanaged an average per capita GDP growth rate of even 3 percent from 1952 to
1978. The main reason for such a gain, as earlier emphasized earlier in Table 1, was1978. The main reason for such a gain, as earlier emphasized earlier in Table 1, was
the increases in physical and human capital, both of which were at very low levelsthe increases in physical and human capital, both of which were at very low levels
in 1952. The capital/output ratio rose by about 140 percent during this time, fromin 1952. The capital/output ratio rose by about 140 percent during this time, from
0.91 in 1952 to 2.22 in 1978. In addition, average years of education rose from 0.740.91 in 1952 to 2.22 in 1978. In addition, average years of education rose from 0.74
in 1952 to 3.75 in 1978. Even with the substantial decline in aggregate productivity,in 1952 to 3.75 in 1978. Even with the substantial decline in aggregate productivity,
these factors were sufficient to increase China’s per capita GDP over this time.these factors were sufficient to increase China’s per capita GDP over this time.
In summary, the industrialization policies pursued by the Chinese governmentIn summary, the industrialization policies pursued by the Chinese government
during this period from 1952 to 1978 created adverse incentives and gross misal-during this period from 1952 to 1978 created adverse incentives and gross misal-
location of resources that resulted in declining aggregate productivity, recurringlocation of resources that resulted in declining aggregate productivity, recurring
food crises, and relatively little improvement in living standards.food crises, and relatively little improvement in living standards.
Sectoral Shifts and Productivity Growth Since 1978
When the Cultural Revolution ended after the death of the Communist PartyWhen the Cultural Revolution ended after the death of the Communist Party
chairman Mao Zedong in 1976, the Chinese government under the leadership ofchairman Mao Zedong in 1976, the Chinese government under the leadership of
Deng Xiaoping sought to increase its legitimacy by improving aggregate economicDeng Xiaoping sought to increase its legitimacy by improving aggregate economic
performance and raising living standards. In December 1978, the governmentperformance and raising living standards. In December 1978, the government
decided on a general policy ofdecided on a general policy of Gaige Kaifang or “reform and opening up.” Xu (2011)or “reform and opening up.” Xu (2011)
reviews the institutional changes during the reform period in China. There was noreviews the institutional changes during the reform period in China. There was no
grand design of systematic reform policies; instead, economic reforms have takengrand design of systematic reform policies; instead, economic reforms have taken
place in a gradual, experimental, and decentralized fashion. How did the reformsplace in a gradual, experimental, and decentralized fashion. How did the reforms
generate such impressive growth? Is the growth sustainable? As a starting point togenerate such impressive growth? Is the growth sustainable? As a starting point to
answering this question, in this section, I look at productivity growth in differentanswering this question, in this section, I look at productivity growth in different
sectors and the reallocation of labor across sectors. In the following two sections,sectors and the reallocation of labor across sectors. In the following two sections,
I then discuss the key economic reforms and institutional changes that were behindI then discuss the key economic reforms and institutional changes that were behind
the sector-level productivity growth in agriculture and in the nonstate sector.the sector-level productivity growth in agriculture and in the nonstate sector.
Table 2 presents total factor productivity growth rates of the aggregateTable 2 presents total factor productivity growth rates of the aggregate
economy, the agricultural sector, and the nonagricultural sector. Because of theeconomy, the agricultural sector, and the nonagricultural sector. Because of the
importance of the state sector in the Chinese economy, the nonagricultural sectorimportance of the state sector in the Chinese economy, the nonagricultural sector
is divided into the state and the nonstate sectors. The “state sector” includesis divided into the state and the nonstate sectors. The “state sector” includes
both state-owned enterprises and shareholding companies; and the “nonstateboth state-owned enterprises and shareholding companies; and the “nonstate
sector” includes domestic private firms, foreign-invested firms,sector” includes domestic private firms, foreign-invested firms,33
and collectiveand collective
3
In China, “foreign-invested” firm is a term used for any one of a number of legal entities with foreign
stakeholders, including equity joint ventures, cooperative joint ventures, wholly-owned foreign enter-
prises, and foreign-invested companies limited by shares.
Understanding China’s Growth: Past, Present, and Future 111
firms in the nonagricultural sector. We include the shareholding companies infirms in the nonagricultural sector. We include the shareholding companies in
the state sector because many of them are former state-owned enterprises thatthe state sector because many of them are former state-owned enterprises that
were restructured into shareholding companies after the mid-1990s but are stillwere restructured into shareholding companies after the mid-1990s but are still
controlled by the state. They continue to receive favorable treatment by thecontrolled by the state. They continue to receive favorable treatment by the
state, have easy access to bank credit, and are concentrated in protected indus-state, have easy access to bank credit, and are concentrated in protected indus-
tries such as energy and telecommunication. In contrast, the collective firms,tries such as energy and telecommunication. In contrast, the collective firms,
including those that are controlled by lower-level governments, receive littleincluding those that are controlled by lower-level governments, receive little
support from the state and, like domestic private firms, have difficulties gettingsupport from the state and, like domestic private firms, have difficulties getting
bank credit and entering into protected industries. Thus, we include them in thebank credit and entering into protected industries. Thus, we include them in the
nonstate sector.nonstate sector.
The growth rates are reported for the entire period of 1978–2007 and threeThe growth rates are reported for the entire period of 1978–2007 and three
subperiods. The productivity growth rates are calculated using China’s officialsubperiods. The productivity growth rates are calculated using China’s official
national accounts data on nominal output and fixed investment, the revised GDPnational accounts data on nominal output and fixed investment, the revised GDP
and fixed investment deflators, the revised employment series that is consistent withand fixed investment deflators, the revised employment series that is consistent with
Table 2
Employment Share, GDP Share, and Total Factor Productivity
Growth by Sector
Average annual total factor productivity growth (%)
Nonagricultural sector
Period Agriculture Nonstate State Aggregate
1978–2007 4.01 3.91 1.68 3.61
1978–1988 2.79 5.87 –0.36 3.83
1988–1998 5.10 2.17 0.27 2.45
1998–2007 4.13 3.67 5.50 4.68
Year Employment share (%)
1978 69 15 16 100
2007 26 62 12 100
Year GDP share (%)
1978 28 27 45 100
2007 10 70 20 100
Source: Brandt and Zhu (2010).
Notes: Table 2 presents total factor productivity (TFP) growth rates of the
aggregate economy, the agricultural sector, and the nonagricultural sector, with
the nonagricultural sector divided into state and the nonstate sectors. See text
for details on the categorization of firms and enterprises into sectors. Because
the TFP growth rates reported in this table are based on China’s national
accounts data that use domestic prices, they are different from the TFP growth
rates reported in Table 1, which are calculated from the Penn World Table data
that use international prices.
112 Journal of Economic Perspectives
China’s census data, and the schooling year data of Barro and Lee (2010). In BrandtChina’s census data, and the schooling year data of Barro and Lee (2010). In Brandt
and Zhu (2010), we offer details on the construction of the data series.and Zhu (2010), we offer details on the construction of the data series.44
Total factor productivity grew rapidly in both the agricultural and the nonstateTotal factor productivity grew rapidly in both the agricultural and the nonstate
sectors. For the overall period from 1978 to 2007, the average annual growth ratessectors. For the overall period from 1978 to 2007, the average annual growth rates
of total factor productivity in these two sectors is 4.01 and 3.91 percent, respectively.of total factor productivity in these two sectors is 4.01 and 3.91 percent, respectively.
In contrast, the average growth rate of total factor productivity in the state sector isIn contrast, the average growth rate of total factor productivity in the state sector is
only 1.68 percent per year. Prior to 1998, in particular, the state sector had very lowonly 1.68 percent per year. Prior to 1998, in particular, the state sector had very low
productivity growth rates. After 1998, though, total factor productivity in the stateproductivity growth rates. After 1998, though, total factor productivity in the state
sector grew rapidly, averaging 5.5 percent annually.sector grew rapidly, averaging 5.5 percent annually.
The similarity of productivity growth rates in agriculture and in the nonstateThe similarity of productivity growth rates in agriculture and in the nonstate
sector are associated with very different movements of these two sectors’ employ-sector are associated with very different movements of these two sectors’ employ-
ment shares. As reported in Table 2, agriculture’s share of total employmentment shares. As reported in Table 2, agriculture’s share of total employment
declined from 69 percent in 1978 to 26 percent in 2007. The high rate of produc-declined from 69 percent in 1978 to 26 percent in 2007. The high rate of produc-
tivity growth in agriculture helped to push workers away from jobs in agriculture.tivity growth in agriculture helped to push workers away from jobs in agriculture.
Conversely, the nonstate sector’s share of employment increased from 15 percent inConversely, the nonstate sector’s share of employment increased from 15 percent in
1978 to 62 percent by 2007. The extraordinary increase in the number of workers1978 to 62 percent by 2007. The extraordinary increase in the number of workers
in this sector was not sufficient to drive down their productivity. Instead, the growthin this sector was not sufficient to drive down their productivity. Instead, the growth
of the nonstate secotor represents the productivity benefits of a sectoral shift awayof the nonstate secotor represents the productivity benefits of a sectoral shift away
from the agricultural sector to a sector of the economy that could absorb this laborfrom the agricultural sector to a sector of the economy that could absorb this labor
and still generate rapid productivity growth.and still generate rapid productivity growth.
The state sector’s share of total employment remained remarkably constant atThe state sector’s share of total employment remained remarkably constant at
around 16–17 percent of the total labor force from 1978 until 1997. The restruc-around 16–17 percent of the total labor force from 1978 until 1997. The restruc-
turing of state enterprises circa 1998 led both to a rise in the rate of productivityturing of state enterprises circa 1998 led both to a rise in the rate of productivity
growth for this sector and also to a decline in its share of China’s labor to 12 percentgrowth for this sector and also to a decline in its share of China’s labor to 12 percent
in 2001—a level where it has remained since.in 2001—a level where it has remained since.
In the next section, I’ll discuss the transformation in agriculture in more depth.In the next section, I’ll discuss the transformation in agriculture in more depth.
In the following section, I’ll delve more deeply into productivity growth for theIn the following section, I’ll delve more deeply into productivity growth for the
nonstate and state producers in the nonagricultural sector.nonstate and state producers in the nonagricultural sector.
Productivity Growth in Agriculture and Structural Transformation
Since China had experienced recurring food crises before 1978, it is notSince China had experienced recurring food crises before 1978, it is not
surprising that its economic reform started in the agricultural sector. Theresurprising that its economic reform started in the agricultural sector. There
were two important reforms. First, the government increased prices for agricul-were two important reforms. First, the government increased prices for agricul-
tural goods. Second, the previous “collective farming system” was shifted to thetural goods. Second, the previous “collective farming system” was shifted to the
“household-responsibility system.” Under the new system, each farm household was“household-responsibility system.” Under the new system, each farm household was
assigned a fixed quota of grains that the household had to sell to the government atassigned a fixed quota of grains that the household had to sell to the government at
4
Because the national accounts use domestic prices rather than international prices, these growth rates
are not the same as the growth rates calculated from the Penn World Tables. However, the differences
are small. For the entire period of 1978–2007, the annual growth rates of GDP per worker and total
factor productivity calculated using the Penn World Tables are 7.55 and 3.16 percent, respectively. The
corresponding growth rates calculated using China’s national accounts data are 7.58 and 3.61 percent.
Xiaodong Zhu 113
official prices. However, any extra grain the household produced could be sold atofficial prices. However, any extra grain the household produced could be sold at
market prices. The reforms were implemented gradually and completed in 1984.market prices. The reforms were implemented gradually and completed in 1984.
Between 1978 and 1984, total factor productivity in the agricultural sector grewBetween 1978 and 1984, total factor productivity in the agricultural sector grew
5.62 percent per year. Several studies argue that most of the productivity growth5.62 percent per year. Several studies argue that most of the productivity growth
during this period can be attributed to the price and institutional reforms thatduring this period can be attributed to the price and institutional reforms that
generated strong positive incentive effects on farmers’ efforts and input choicesgenerated strong positive incentive effects on farmers’ efforts and input choices
(for example, McMillan, Walley, and Zhu 1989; Lin 1992).(for example, McMillan, Walley, and Zhu 1989; Lin 1992).
As a result of the productivity growth, China’s agricultural output increased byAs a result of the productivity growth, China’s agricultural output increased by
47 percent during this period. The increase in food availability alleviated China’s47 percent during this period. The increase in food availability alleviated China’s
subsistence food constraint and started a structural transformation that reallocated asubsistence food constraint and started a structural transformation that reallocated a
large amount of labor from agriculture to industry. From 1978 to 1984, agriculture’slarge amount of labor from agriculture to industry. From 1978 to 1984, agriculture’s
share of total employment fell from 69 percent to 50 percent: that is, in just six years,share of total employment fell from 69 percent to 50 percent: that is, in just six years,
19 percent of China’s labor force—more than 49 million workers—reallocated out19 percent of China’s labor force—more than 49 million workers—reallocated out
of the agricultural sector. Most of the 49 million reallocated workers did not moveof the agricultural sector. Most of the 49 million reallocated workers did not move
to urban centers. Instead, they went to work in the rural industrial enterprises setto urban centers. Instead, they went to work in the rural industrial enterprises set
up by township and village-level governments that are called “township and villageup by township and village-level governments that are called “township and village
enterprises” (TVEs).enterprises” (TVEs).
For the first few years, the price and institutional reforms increased agriculturalFor the first few years, the price and institutional reforms increased agricultural
output mainly by improving incentives without much change in the production tech-output mainly by improving incentives without much change in the production tech-
nologies being used. However, by about 1984 these static efficiency gains, from workersnologies being used. However, by about 1984 these static efficiency gains, from workers
using the same technology with a much more rewarding set of incentives, were largelyusing the same technology with a much more rewarding set of incentives, were largely
exhausted. Both agricultural productivity and structural transformation stagnated inexhausted. Both agricultural productivity and structural transformation stagnated in
the second half of the 1980s. Starting around 1990, markets for agricultural inputs andthe second half of the 1980s. Starting around 1990, markets for agricultural inputs and
outputs were gradually liberalized and government interventions were significantlyoutputs were gradually liberalized and government interventions were significantly
reduced. Huang, Otsuka, and Rozelle (2008) document extensive market liberaliza-reduced. Huang, Otsuka, and Rozelle (2008) document extensive market liberaliza-
tion in China’s agricultural sector and state: “aside from restrictions on land ownership,tion in China’s agricultural sector and state: “aside from restrictions on land ownership,
China today may have one of the least distorted domestic agricultural economies in theChina today may have one of the least distorted domestic agricultural economies in the
World.” As this market liberalization provided farmers with strong incentives to adoptWorld.” As this market liberalization provided farmers with strong incentives to adopt
new technologies, the average annual growth rate of total factor productivity in agri-new technologies, the average annual growth rate of total factor productivity in agri-
culture reached 5.10 percent between 1988 and 1998, and remained at 4.13 percentculture reached 5.10 percent between 1988 and 1998, and remained at 4.13 percent
between 1998 and 2007. Most of agriculture’s growth in total factor productivity afterbetween 1998 and 2007. Most of agriculture’s growth in total factor productivity after
1990 came from technological progress ( Jin, Ma, Huang, Hu, and Rozelle 2010).1990 came from technological progress ( Jin, Ma, Huang, Hu, and Rozelle 2010).
Structural transformation also resumed after 1990. By 2007, agriculture’s share of totalStructural transformation also resumed after 1990. By 2007, agriculture’s share of total
employment had been reduced from 46 percent in 1991 to 26 percent in 2007.employment had been reduced from 46 percent in 1991 to 26 percent in 2007.
How did productivity growth in agriculture contribute to the overall economicHow did productivity growth in agriculture contribute to the overall economic
growth in China? Since T. W. Schultz (1953)’s pioneering work, economists havegrowth in China? Since T. W. Schultz (1953)’s pioneering work, economists have
long emphasized the role of agriculture in economic development.long emphasized the role of agriculture in economic development.55
The standardThe standard
argument is that productivity growth in agriculture not only contributes to aggregateargument is that productivity growth in agriculture not only contributes to aggregate
productivity growth directly, but also indirectly through structural transformation.productivity growth directly, but also indirectly through structural transformation.
When agricultural productivity increases, food demand can be met with a smallerWhen agricultural productivity increases, food demand can be met with a smaller
5
See, for example, Johnston and Mellor (1961), Jorgenson (1961), Schultz (1964), and Timmer (1988).
See also Gollin, Parente, and Rogerson (2002), Restuccia, Yang, and Zhu (2008), and Yang and Zhu
(2010) for some recent analyses.
114 Journal of Economic Perspectives
number of workers in the agricultural sector than before. As a result, some workersnumber of workers in the agricultural sector than before. As a result, some workers
can be reallocated to the nonagricultural sector. Because average labor productivity iscan be reallocated to the nonagricultural sector. Because average labor productivity is
generally higher in the nonagricultural sector than in the agricultural sector, the real-generally higher in the nonagricultural sector than in the agricultural sector, the real-
location of workers from agriculture contributes positively to aggregate productivitylocation of workers from agriculture contributes positively to aggregate productivity
growth. Indeed, in 1978, the average labor productivity in China’s nonagriculturalgrowth. Indeed, in 1978, the average labor productivity in China’s nonagricultural
sector was six times as high as in the agricultural sector, and therefore one wouldsector was six times as high as in the agricultural sector, and therefore one would
expect a significant contribution from the labor reallocation. For this reason, Youngexpect a significant contribution from the labor reallocation. For this reason, Young
(2003) suggests that the reforms in the agricultural sector may have been the most(2003) suggests that the reforms in the agricultural sector may have been the most
important source of China’s growth during the first two decades of economic reform.important source of China’s growth during the first two decades of economic reform.
In Brandt and Zhu (2010), my coauthor and I use a multisector model toIn Brandt and Zhu (2010), my coauthor and I use a multisector model to
quantify this contribution during the period of 1978–2007. We find that, out ofquantify this contribution during the period of 1978–2007. We find that, out of
the 43 percentage points of the reduction in agriculture’s share of employmentthe 43 percentage points of the reduction in agriculture’s share of employment
between 1978 and 2007, total factor productivity growth in agriculture accountsbetween 1978 and 2007, total factor productivity growth in agriculture accounts
for 39 percentage points or 91 percent of the total reduction. Taking both thefor 39 percentage points or 91 percent of the total reduction. Taking both the
direct and indirect effects into account, we find that the contribution of total factordirect and indirect effects into account, we find that the contribution of total factor
productivity growth in agriculture to aggregate productivity growth is 1.5 percentageproductivity growth in agriculture to aggregate productivity growth is 1.5 percentage
points a year for the entire period of 1978 and 2007. However, we also find that thepoints a year for the entire period of 1978 and 2007. However, we also find that the
role of agriculture’s productivity growth diminishes over time, from a contributionrole of agriculture’s productivity growth diminishes over time, from a contribution
of 2.1 percentage points per year between 1978 and 1988, to a contribution of onlyof 2.1 percentage points per year between 1978 and 1988, to a contribution of only
0.6 percentage points per year for the period between 1998 and 2007. There are0.6 percentage points per year for the period between 1998 and 2007. There are
two reasons for the decline. First, as the economy grew, agriculture’s share of value-two reasons for the decline. First, as the economy grew, agriculture’s share of value-
added decreased, and therefore its direct contribution also diminished. Second, theadded decreased, and therefore its direct contribution also diminished. Second, the
marginal contribution of reallocation is a decreasing function of the agriculturalmarginal contribution of reallocation is a decreasing function of the agricultural
productivity level. After 20 years of productivity growth, the gain from reallocationproductivity level. After 20 years of productivity growth, the gain from reallocation
naturally declined in the later years. As agriculture’s share of employment and value-naturally declined in the later years. As agriculture’s share of employment and value-
added continue to decline, the contribution of productivity growth in agriculture toadded continue to decline, the contribution of productivity growth in agriculture to
aggregate productivity growth will be even smaller in the future.aggregate productivity growth will be even smaller in the future.
Growth outside Agriculture: A Tale of Two Sectors
Before economic reform started in 1978, resource allocation was centrallyBefore economic reform started in 1978, resource allocation was centrally
determined by the government’s plan rather than by the market. The state sectordetermined by the government’s plan rather than by the market. The state sector
dominated nonagricultural activity, accounting for 80 percent of the total urbandominated nonagricultural activity, accounting for 80 percent of the total urban
employment and more than three-quarters of industrial output. The nonstate sectoremployment and more than three-quarters of industrial output. The nonstate sector
at that time mainly consisted of collective firms. Urban collectives were confinedat that time mainly consisted of collective firms. Urban collectives were confined
to producing a small number of consumer goods and providing neighborhoodto producing a small number of consumer goods and providing neighborhood
services. Rural collectives were only allowed to manufacture producer goods for theservices. Rural collectives were only allowed to manufacture producer goods for the
agricultural sector.agricultural sector.
1978–1988: Rise of the Nonstate Sector
In the early 1980s, encouraged by the success of the rural reforms, the ChineseIn the early 1980s, encouraged by the success of the rural reforms, the Chinese
government started two market reforms in the nonagricultural sector. First, agovernment started two market reforms in the nonagricultural sector. First, a
dual-track system was introduced. State-owned enterprises were still given quotasdual-track system was introduced. State-owned enterprises were still given quotas
Understanding China’s Growth: Past, Present, and Future 115
on both production inputs and output that transacted at official prices, but theyon both production inputs and output that transacted at official prices, but they
were also allowed to buy inputs and sell output beyond quotas at market prices.were also allowed to buy inputs and sell output beyond quotas at market prices.
Moreover, the non-state-owned enterprises, including collectives (as we discussedMoreover, the non-state-owned enterprises, including collectives (as we discussed
earlier), small-scale individual businesses, and foreign-invested firms in the specialearlier), small-scale individual businesses, and foreign-invested firms in the special
economic zones, were allowed to enter previously forbidden industries, buying andeconomic zones, were allowed to enter previously forbidden industries, buying and
selling their inputs and outputs at market prices. Second, the central governmentselling their inputs and outputs at market prices. Second, the central government
also devolved economic decision-making powers to lower-level governments andalso devolved economic decision-making powers to lower-level governments and
provided them with fiscal incentives. Starting in 1980, a “fiscal contracting system”provided them with fiscal incentives. Starting in 1980, a “fiscal contracting system”
was implemented that effectively made local governments the “residual claimants”was implemented that effectively made local governments the “residual claimants”
of the enterprises under their control (Qian 1999). As a result, provincial-, city-,of the enterprises under their control (Qian 1999). As a result, provincial-, city-,
and county-level governments controlled most of the state-owned enterprises whileand county-level governments controlled most of the state-owned enterprises while
the township- and village-level governments controlled the group of rural collectivethe township- and village-level governments controlled the group of rural collective
enterprises that became known as the “township and village enterprises.”enterprises that became known as the “township and village enterprises.”
Under these reforms, the township and village enterprises based on the old ruralUnder these reforms, the township and village enterprises based on the old rural
collectives flourished and led the way to an expansion of the nonstate sector, whilecollectives flourished and led the way to an expansion of the nonstate sector, while
the state-owned enterprises did not. The number of township and village enterprisesthe state-owned enterprises did not. The number of township and village enterprises
increased from 1,520,000 in 1978 to 18,880,000 in 1988 (National Bureau of Statisticsincreased from 1,520,000 in 1978 to 18,880,000 in 1988 (National Bureau of Statistics
of China 1999). The success of the agricultural reforms made available to these enter-of China 1999). The success of the agricultural reforms made available to these enter-
prises a large number of local workers, and the dual-track system allowed them to gainprises a large number of local workers, and the dual-track system allowed them to gain
access to capital and raw materials from the markets. Between 1978 and 1988, the shareaccess to capital and raw materials from the markets. Between 1978 and 1988, the share
of total employment in nonstate enterprises increased from 15 percent to 39 percent.of total employment in nonstate enterprises increased from 15 percent to 39 percent.
The expansion of employment in the nonstate sector was also accompanied by totalThe expansion of employment in the nonstate sector was also accompanied by total
factor productivity growth averaging 5.87 percent a year during this period.factor productivity growth averaging 5.87 percent a year during this period.
The reforms did less for state-owned enterprises. Local governments at countyThe reforms did less for state-owned enterprises. Local governments at county
level and above sought to improve the economic performance of the state-ownedlevel and above sought to improve the economic performance of the state-owned
enterprises under their control by implementing a “managerial responsibilityenterprises under their control by implementing a “managerial responsibility
system” that linked managers and workers’ income to financial outcomes of thesystem” that linked managers and workers’ income to financial outcomes of the
enterprises. The reforms did have some positive effect on productivity. Using aenterprises. The reforms did have some positive effect on productivity. Using a
panel data set of 272 industrial state-owned enterprises collected by the Chinesepanel data set of 272 industrial state-owned enterprises collected by the Chinese
Academy of Social Sciences, Li (1997) estimates that their total factor productivityAcademy of Social Sciences, Li (1997) estimates that their total factor productivity
on average grew at 4.68 percent per year between 1980 and 1989, and that most ofon average grew at 4.68 percent per year between 1980 and 1989, and that most of
the productivity growth could be attributed to stronger incentives, increased marketthe productivity growth could be attributed to stronger incentives, increased market
competition, and better allocation of production inputs. Using the same data set,competition, and better allocation of production inputs. Using the same data set,
Groves, Naughton, Hong, and McMillan (1994) also report positive incentive effectsGroves, Naughton, Hong, and McMillan (1994) also report positive incentive effects
of the managerial responsibility system on productivity.of the managerial responsibility system on productivity.
While enterprise reforms made industrial state-owned enterprises more effi-While enterprise reforms made industrial state-owned enterprises more effi-
cient, their productivity growth was slower than that of the nonstate enterprisescient, their productivity growth was slower than that of the nonstate enterprises
and not fast enough to offset the rising real cost of material inputs. Using moreand not fast enough to offset the rising real cost of material inputs. Using more
aggregate data on industrial enterprises reported by China’s National Statisticalaggregate data on industrial enterprises reported by China’s National Statistical
Bureau, Jefferson, Rawski, and Zheng (1996) estimate that between 1980 and 1988,Bureau, Jefferson, Rawski, and Zheng (1996) estimate that between 1980 and 1988,
the average annual growth rate of total factor productivity was 2.96 percent forthe average annual growth rate of total factor productivity was 2.96 percent for
state-owned enterprises and 3.66 percent for the nonstate collective enterprises.state-owned enterprises and 3.66 percent for the nonstate collective enterprises.
However, these estimated rates of productivity growth are based on a productionHowever, these estimated rates of productivity growth are based on a production
function that uses gross output rather than value-added. If the costs of real materialfunction that uses gross output rather than value-added. If the costs of real material
116 Journal of Economic Perspectives
inputs are rising, using gross output rather than value-added may be misleading.inputs are rising, using gross output rather than value-added may be misleading.66
In the pre-reform period, prices of material inputs were kept artificially low, andIn the pre-reform period, prices of material inputs were kept artificially low, and
so during the reform period, market prices of material inputs rose significantlyso during the reform period, market prices of material inputs rose significantly
faster than output prices. Using the information reported in Jefferson, Rawski, andfaster than output prices. Using the information reported in Jefferson, Rawski, and
Zheng, I calculated the growth of total factor productivity for the state and collectiveZheng, I calculated the growth of total factor productivity for the state and collective
industrial enterprises between 1980 and 1988 using value-added, rather than grossindustrial enterprises between 1980 and 1988 using value-added, rather than gross
output. By this metric, the state-owned firms had annual productivity growth ofoutput. By this metric, the state-owned firms had annual productivity growth of
–1.33 percent, while the nonstate collective enterprises had a growth rate of positive–1.33 percent, while the nonstate collective enterprises had a growth rate of positive
3.11 percent per year. (There has been no comparable study for the specific state3.11 percent per year. (There has been no comparable study for the specific state
and nonstate enterprises in services because data for such a study are not available.)and nonstate enterprises in services because data for such a study are not available.)
In short, the basic lesson is that productivity growth of the nonagriculturalIn short, the basic lesson is that productivity growth of the nonagricultural
sector during this period was mainly due to the rise of the nonstate sector. As Table 2sector during this period was mainly due to the rise of the nonstate sector. As Table 2
showed earlier for the 1978–1988 period, the state sector had an average annualshowed earlier for the 1978–1988 period, the state sector had an average annual
growth rate of total factor productivity during this time of –0.36 percent, while thegrowth rate of total factor productivity during this time of –0.36 percent, while the
nonstate sectors had annual productivity growth of 5.87 percent.nonstate sectors had annual productivity growth of 5.87 percent.
1988–1998: From Reform without Losers to Inevitable Tradeoffs
The drastic difference in economic performances between the township andThe drastic difference in economic performances between the township and
village enterprises and the state-owned enterprises may seem implausible; after all,village enterprises and the state-owned enterprises may seem implausible; after all,
both are enterprises under the control of local governments, albeit at different levels.both are enterprises under the control of local governments, albeit at different levels.
One reason for the difference is that state-owned enterprises remained under theOne reason for the difference is that state-owned enterprises remained under the
constraints of government planning for a longer time, unable to sell their productsconstraints of government planning for a longer time, unable to sell their products
at market prices, although these restrictions diminished over time (Naughton 1995).at market prices, although these restrictions diminished over time (Naughton 1995).
But the more important difference is the commitment made by the centralBut the more important difference is the commitment made by the central
government to support employment in the state sector. Remember that employmentgovernment to support employment in the state sector. Remember that employment
in the state-owned sector remained essentially constant at about 16 percent of thein the state-owned sector remained essentially constant at about 16 percent of the
workforce from 1978 up through 1997. This stability reflected the central govern-workforce from 1978 up through 1997. This stability reflected the central govern-
ment strategy of letting the nonstate sector grow without downsizing the state sector.ment strategy of letting the nonstate sector grow without downsizing the state sector.
The strategy had the political benefit of minimizing social instability and reducingThe strategy had the political benefit of minimizing social instability and reducing
resistance to reform. Lau, Qian, and Roland (2000) call it “reform without losers.”resistance to reform. Lau, Qian, and Roland (2000) call it “reform without losers.”
To avoid laying off workers or shutting down factories, the government usually askedTo avoid laying off workers or shutting down factories, the government usually asked
the state-owned banks to bail out loss-making state-owned enterprises. The possibilitythe state-owned banks to bail out loss-making state-owned enterprises. The possibility
of bailout created a “soft budget constraint,” to use a term common in the literatureof bailout created a “soft budget constraint,” to use a term common in the literature
on centrally planned economies, that further reduced the economic incentives ofon centrally planned economies, that further reduced the economic incentives of
the state-owned enterprises (Kornai 1980; Qian and Roland 1998; Brandt and Zhuthe state-owned enterprises (Kornai 1980; Qian and Roland 1998; Brandt and Zhu
2001). The lack of exit also eliminated market selection as an important mecha-2001). The lack of exit also eliminated market selection as an important mecha-
nism for improving aggregate productivity in the state sector. In contrast, the centralnism for improving aggregate productivity in the state sector. In contrast, the central
government had no commitment to support employment in the township and villagegovernment had no commitment to support employment in the township and village
enterprises. While the local governments that ran the township and village enter-enterprises. While the local governments that ran the township and village enter-
prises did have political incentives to minimize unemployment and maintain socialprises did have political incentives to minimize unemployment and maintain social
stability in their communities, these local governments had only weak influence onstability in their communities, these local governments had only weak influence on
6
Specifically, let sm be the share of material inputs in gross output, then Δln(TFPvalue-added)
= [Δln(TFPgross output) – sm Δln(real material input cost)]/(1 – sm).
Xiaodong Zhu 117
banks. For example, millions of township and village enterprises went bankrupt whenbanks. For example, millions of township and village enterprises went bankrupt when
there was a general tightening of credit in 1989 (Qian and Xu 1993). Thus, townshipthere was a general tightening of credit in 1989 (Qian and Xu 1993). Thus, township
and village enterprises faced a much tighter budget constraint and stronger marketand village enterprises faced a much tighter budget constraint and stronger market
discipline than did the state-owned enterprises.discipline than did the state-owned enterprises.
Unsurprisingly, at least to economists, a “reform without losers” strategy stillUnsurprisingly, at least to economists, a “reform without losers” strategy still
poses tradeoffs. In the absence of hard budget constraints and market discipline,poses tradeoffs. In the absence of hard budget constraints and market discipline,
the state-owned enterprises continued to be outperformed by the nonstate sector.the state-owned enterprises continued to be outperformed by the nonstate sector.
Between 1988 and 1998, the average annual growth rate of total factor productivityBetween 1988 and 1998, the average annual growth rate of total factor productivity
in the state sector was only 0.27 percent, while the comparable growth rate of thein the state sector was only 0.27 percent, while the comparable growth rate of the
nonstate sector was 2.17 percent (as shown earlier in Table 2). Faced with increasingnonstate sector was 2.17 percent (as shown earlier in Table 2). Faced with increasing
competition from the more efficient nonstate firms and without significant produc-competition from the more efficient nonstate firms and without significant produc-
tivity growth, the financial condition of the state-owned firms deteriorated. Thetivity growth, the financial condition of the state-owned firms deteriorated. The
resources needed to support the state-owned enterprises increased steadily betweenresources needed to support the state-owned enterprises increased steadily between
1986 and 1993. Nonperforming loans in the state banking system increased rapidly,1986 and 1993. Nonperforming loans in the state banking system increased rapidly,
and the creation of money to make these loans was leading to chronic high inflationand the creation of money to make these loans was leading to chronic high inflation
(Brandt and Zhu 2000).(Brandt and Zhu 2000).
By 1994, it had become clear that the strategy of “reform without losers” couldBy 1994, it had become clear that the strategy of “reform without losers” could
no longer be sustained. In 1995, the Chinese government reduced its commitment tono longer be sustained. In 1995, the Chinese government reduced its commitment to
stable employment in the state sector. Many small-scale state-owned enterprises werestable employment in the state sector. Many small-scale state-owned enterprises were
allowed to go bankrupt or be privatized through management buyouts. Betweenallowed to go bankrupt or be privatized through management buyouts. Between
1995 and 2001, the state sector’s share of total employment declined from 17 percent1995 and 2001, the state sector’s share of total employment declined from 17 percent
to 12 percent.to 12 percent.77
More diversified ownership forms were also introduced within theMore diversified ownership forms were also introduced within the
state sector. Some of the large-scale state-owned enterprises were converted intostate sector. Some of the large-scale state-owned enterprises were converted into
shareholding companies, with a majority of shares controlled by the state.shareholding companies, with a majority of shares controlled by the state.
1998–2007: Privatization and Trade Liberalization
The 15th Congress of the Chinese Communist Party held in 1997 was a mile-The 15th Congress of the Chinese Communist Party held in 1997 was a mile-
stone in China’s economic policies. The Congress formally sanctioned ownershipstone in China’s economic policies. The Congress formally sanctioned ownership
reforms of the state-owned firms and also legalized the development of privatereforms of the state-owned firms and also legalized the development of private
enterprises. With the reduction of legal barriers, private enterprises grew rapidly.enterprises. With the reduction of legal barriers, private enterprises grew rapidly.
Collective enterprises such as township and village enterprises lost their edge, someCollective enterprises such as township and village enterprises lost their edge, some
were closed and many of them were privatized, also in the form of managementwere closed and many of them were privatized, also in the form of management
buyouts. As part of the lead-up to China’s joining the World Trade Organization inbuyouts. As part of the lead-up to China’s joining the World Trade Organization in
2001, China’s government also started to cut tariffs, broadened trade rights, and2001, China’s government also started to cut tariffs, broadened trade rights, and
liberalized its regime for foreign direct investment (Branstetter and Lardy 2008).liberalized its regime for foreign direct investment (Branstetter and Lardy 2008).
Between 1998 and 2007, the share of total urban employment in domestic privateBetween 1998 and 2007, the share of total urban employment in domestic private
enterprises and foreign-invested enterprises increased from 8 to 24 percent. Theenterprises and foreign-invested enterprises increased from 8 to 24 percent. The
increase in the manufacturing sector was even more pronounced. By 2007, domesticincrease in the manufacturing sector was even more pronounced. By 2007, domestic
private enterprises alone accounted for 51 percent of total urban employment inprivate enterprises alone accounted for 51 percent of total urban employment in
the manufacturing sector (National Bureau of Statistics of China, 2008, tables 4–2,the manufacturing sector (National Bureau of Statistics of China, 2008, tables 4–2,
7
China’s official employment statistics did not record a reduction in the employment of state-owned
enterprises until 1998. The state-owned sector actually started to downsize and lay off workers a few years
earlier in 1995.
118 Journal of Economic Perspectives
4–6, 4–13). Song, Storesletten, and Ziliboti (2011) present a model that describes4–6, 4–13). Song, Storesletten, and Ziliboti (2011) present a model that describes
the transformation during this period.the transformation during this period.
The combination of privatization and trade liberalization had strong effects onThe combination of privatization and trade liberalization had strong effects on
productivity growth in both the state and nonstate sectors. Between 1998 and 2007,productivity growth in both the state and nonstate sectors. Between 1998 and 2007,
the average annual total factor productivity growth rates of the state and nonstatethe average annual total factor productivity growth rates of the state and nonstate
sectors were 5.50 percent and 3.67 percent, respectively (as shown in Table 2).sectors were 5.50 percent and 3.67 percent, respectively (as shown in Table 2).
After stagnating for much of the first two decades of reform, the state sector finallyAfter stagnating for much of the first two decades of reform, the state sector finally
experienced productivity growth in the last decade.experienced productivity growth in the last decade.
In the manufacturing sector, productivity growth during this period isIn the manufacturing sector, productivity growth during this period is
even higher. Using data of the China Annual Survey of Industries,even higher. Using data of the China Annual Survey of Industries,88
Brandt, VanBrandt, Van
Biesebroeck, and Zhang (2012) estimate that, for the manufacturing sector, theBiesebroeck, and Zhang (2012) estimate that, for the manufacturing sector, the
total factor productivity growth rate is 13.4 percent a year. Because even state-ownedtotal factor productivity growth rate is 13.4 percent a year. Because even state-owned
enterprises were allowed to go bankrupt and exit during this period, reallocationenterprises were allowed to go bankrupt and exit during this period, reallocation
through the process of entry and exit contributed significantly to productivitythrough the process of entry and exit contributed significantly to productivity
growth, accounting for 72 percent of the aggregate growth of total factor produc-growth, accounting for 72 percent of the aggregate growth of total factor produc-
tivity in the manufacturing sector. Jefferson, Rawski, and Zhang (2008) report similartivity in the manufacturing sector. Jefferson, Rawski, and Zhang (2008) report similar
results. Using the same data, Hsieh and Klenow (2009) examine the contributionresults. Using the same data, Hsieh and Klenow (2009) examine the contribution
of capital and labor reallocation among existing firms to the aggregate total factorof capital and labor reallocation among existing firms to the aggregate total factor
productivity growth in the manufacturing sector. They find that between 1998 andproductivity growth in the manufacturing sector. They find that between 1998 and
2005, a more efficient allocation within four-digit-level manufacturing industries2005, a more efficient allocation within four-digit-level manufacturing industries
contributed 2 percentage points per year to aggregate total factor productivitycontributed 2 percentage points per year to aggregate total factor productivity
growth in the manufacturing sector, with a significant portion of it coming fromgrowth in the manufacturing sector, with a significant portion of it coming from
the reallocation from state-owned to nonstate enterprises. In short, privatizationthe reallocation from state-owned to nonstate enterprises. In short, privatization
and trade liberalization reduced barriers to entry and exit, and increased competi-and trade liberalization reduced barriers to entry and exit, and increased competi-
tion, which in turn led to rapid productivity growth in the manufacturing sector bytion, which in turn led to rapid productivity growth in the manufacturing sector by
raising within-firm productivity and through reallocation along both the extensiveraising within-firm productivity and through reallocation along both the extensive
and intensive margins.and intensive margins.
However, China’s nontradable sectors—primarily construction and services—However, China’s nontradable sectors—primarily construction and services—
have faced much less international competition. There have also been significanthave faced much less international competition. There have also been significant
barriers to entry of private and foreign-invested firms into service industries, andbarriers to entry of private and foreign-invested firms into service industries, and
significant barriers to exit of state-owned enterprises in services. In 2007, the statesignificant barriers to exit of state-owned enterprises in services. In 2007, the state
sector still accounted for 77 percent of total urban employment in services, insector still accounted for 77 percent of total urban employment in services, in
contrast to 15 percent in manufacturing. It is perhaps not surprising, then, thatcontrast to 15 percent in manufacturing. It is perhaps not surprising, then, that
researchers have found that productivity growth in the nontradable sector laggedresearchers have found that productivity growth in the nontradable sector lagged
behind growth in the tradable sector (for example, He, Zhang, Han, and Wu 2012).behind growth in the tradable sector (for example, He, Zhang, Han, and Wu 2012).
Sources of Aggregate Productivity Growth in China: A Summary
From 1978 to 2007, China’s annual growth rate of total factor productivity wasFrom 1978 to 2007, China’s annual growth rate of total factor productivity was
3.61percentperyear.Wecansummarizethesourcesofaggregateproductivitygrowth3.61percentperyear.Wecansummarizethesourcesofaggregateproductivitygrowth
in China during the reform period as follows. In the agricultural sector, productivityin China during the reform period as follows. In the agricultural sector, productivity
8
This firm-level survey has been conducted annually by China’s National Bureau of Statistics. It covers
all Chinese industrial firms (manufacturing, mining, and construction) with sales over 5 million
renminbi yuan.
Understanding China’s Growth: Past, Present, and Future 119
growth contributed 1.5 percentage points a year to aggregate productivity growthgrowth contributed 1.5 percentage points a year to aggregate productivity growth
over the 1978–2007 period, both directly and indirectly through structural transfor-over the 1978–2007 period, both directly and indirectly through structural transfor-
mation. However, this source of growth diminished over time as agriculture’s sharemation. However, this source of growth diminished over time as agriculture’s share
of GDP diminished, and its contribution to China’s future growth will be small. Inof GDP diminished, and its contribution to China’s future growth will be small. In
the nonstate sector, productivity growth contributed 2.27 percentage points per yearthe nonstate sector, productivity growth contributed 2.27 percentage points per year
to aggregate productivity growth over the 1978–2007 period.to aggregate productivity growth over the 1978–2007 period.99
This source of growthThis source of growth
will continue to drive China’s future growth as the nonstate sector’s share of totalwill continue to drive China’s future growth as the nonstate sector’s share of total
nonagricultural employment has risen from 48 percent in 1978 to 84 percent innonagricultural employment has risen from 48 percent in 1978 to 84 percent in
2007 (more than 60 percent of total employment). Productivity stagnated in the2007 (more than 60 percent of total employment). Productivity stagnated in the
state sector until the late 1990s, and for the 1978–2007 period as a whole thisstate sector until the late 1990s, and for the 1978–2007 period as a whole this
sector contributed essentially zero to aggregate growth in total factor productivity.sector contributed essentially zero to aggregate growth in total factor productivity.
However, since 1998, the state sector also experienced rapid productivity growth asHowever, since 1998, the state sector also experienced rapid productivity growth as
a result of restructuring.a result of restructuring.
The proximate sources of productivity growth have shifted over time. ForThe proximate sources of productivity growth have shifted over time. For
example, productivity growth in agriculture under the dual-track system led the wayexample, productivity growth in agriculture under the dual-track system led the way
from 1978 up to about 1984; starting in the mid-1980s, the nonstate sector in thefrom 1978 up to about 1984; starting in the mid-1980s, the nonstate sector in the
form of township and village enterprises under its own dual-track system led the wayform of township and village enterprises under its own dual-track system led the way
through much of the 1980s and 1990s; and from the late 1990s and into the 2000s,through much of the 1980s and 1990s; and from the late 1990s and into the 2000s,
the nonstate sector in the form of privately-owned firms and a restructured state-the nonstate sector in the form of privately-owned firms and a restructured state-
owned sector led the way in an economic climate much friendlier to the privateowned sector led the way in an economic climate much friendlier to the private
sector and with lots of entry, exit, and competitive pressures. Whenever the effectsector and with lots of entry, exit, and competitive pressures. Whenever the effect
of one set of reforms on productivity seemed to be exhausted, the Chinese govern-of one set of reforms on productivity seemed to be exhausted, the Chinese govern-
ment found a way to initiate new reforms that reignite growth.ment found a way to initiate new reforms that reignite growth.
The Future of China’s Economic Growth
Experiences from other economies, especially the East Asian economies such asExperiences from other economies, especially the East Asian economies such as
Japan, Korea, and Taiwan, suggest that periods of extremely rapid growth eventuallyJapan, Korea, and Taiwan, suggest that periods of extremely rapid growth eventually
slow down and China’s more than 8 percent a year per capita GDP growth rate will notslow down and China’s more than 8 percent a year per capita GDP growth rate will not
last. China’s per capita GDP is now around 20 percent of the U.S. level. Will China’slast. China’s per capita GDP is now around 20 percent of the U.S. level. Will China’s
per capita GDP level out at 40 percent of the U.S. level, or 80 percent, or 120 percent?per capita GDP level out at 40 percent of the U.S. level, or 80 percent, or 120 percent?
Of course, any answer to this question will contain a large dose of speculation. ButOf course, any answer to this question will contain a large dose of speculation. But
I will attempt to address this question by discussing what would be the key sourcesI will attempt to address this question by discussing what would be the key sources
of China’s growth in the future based on what we know about the sources of China’sof China’s growth in the future based on what we know about the sources of China’s
growth in the last three decades.growth in the last three decades.
Following the earlier decomposition of the sources of economic growth, weFollowing the earlier decomposition of the sources of economic growth, we
can decompose China’s GDP per capita relative to that of the United States intocan decompose China’s GDP per capita relative to that of the United States into
9
In Brandt and Zhu (2010), we estimate that, if there were no total factor productivity growth in the
nonstate sector, the producutvitiy growth rate for the nonagricultural sector would have been close to
zero for the entire period between 1978 and 2007 and during each of the three sub-periods. I should also
note that productivity growth in different sectors may interact so that one cannot infer the contribution
of productivity growth in the state sector by simply substracting the contributions of agriculture and
nonstate sector from the aggregate productivity growth.
120 Journal of Economic Perspectives
four ingredients: relative labor participation rate, relative average human capital,four ingredients: relative labor participation rate, relative average human capital,
relative capital/output ratio, and relative total factor productivity.relative capital/output ratio, and relative total factor productivity.1010
Figure 3 plotsFigure 3 plots
these ratios for the period between 1978 and 2007. China’s labor force participa-these ratios for the period between 1978 and 2007. China’s labor force participa-
tion and capital/output ratios are above U.S. levels, while China’s relative leveltion and capital/output ratios are above U.S. levels, while China’s relative level
of human capital has risen somewhat over time (notice that Figure 3 is on a logof human capital has risen somewhat over time (notice that Figure 3 is on a log
scale). But clearly, the growth of China’s relative GDP per capita is mainly drivenscale). But clearly, the growth of China’s relative GDP per capita is mainly driven
by the growth of China’s relative total factor productivity. To answer the questionby the growth of China’s relative total factor productivity. To answer the question
about China’s future growth, then, one has to assess the future of China’s relativeabout China’s future growth, then, one has to assess the future of China’s relative
productivity growth.productivity growth.
Although economic reforms have been crucial in generating productivityAlthough economic reforms have been crucial in generating productivity
growth in China over the last three decades, many other economies in Easterngrowth in China over the last three decades, many other economies in Eastern
Europe and Latin America also had economic reforms, but their growth perfor-Europe and Latin America also had economic reforms, but their growth perfor-
mances are nowhere near the performance achieved by China. What is specialmances are nowhere near the performance achieved by China. What is special
about China? One potential explanation is simply China’s backwardness at the startabout China? One potential explanation is simply China’s backwardness at the start
of economic reform in 1978, which increased China’s potential for catch-up growth.of economic reform in 1978, which increased China’s potential for catch-up growth.
10
To be precise, the last two ratios should be the relative capital/output ratio raised to the power of
α/(1 – α), and relative total factor productivity raised to the power of 1/(1 – α). For simplicity, however,
I will simply refer them as “relative capital/output ratio” and “relative total factor productivity.”
Figure 3
China Relative to the Uniteed States
0.010
0.100
1.000
10.000
2007
1986
2004
1988
2002
1990
2000
1992
1998
1994
2006
1978
1984
1980
1982
1996
Labor force participation rate
Capital/Output ratio
Average human capital
TFP
GDP per capita
Note: “TFP” is total factor productivity.
Growth story of china

More Related Content

What's hot

Emergence of china as a global power
Emergence of china as a global powerEmergence of china as a global power
Emergence of china as a global powermaryamjamil
 
China- the next super power
China- the next super powerChina- the next super power
China- the next super powerMohammedEmad1987
 
Why Indian rupee is falling - August 2013
Why Indian rupee is falling - August 2013Why Indian rupee is falling - August 2013
Why Indian rupee is falling - August 2013ranjitg
 
Economic challenges face by Pakistan"s economy and their solutions (1)
Economic challenges face by Pakistan"s economy and their solutions (1)Economic challenges face by Pakistan"s economy and their solutions (1)
Economic challenges face by Pakistan"s economy and their solutions (1)Muhammad Zubair
 
Aaron_Caté_wk13_Industrial Evolution
Aaron_Caté_wk13_Industrial EvolutionAaron_Caté_wk13_Industrial Evolution
Aaron_Caté_wk13_Industrial EvolutionAaron Cate
 
Economic development in the contemporary china
Economic development in the contemporary chinaEconomic development in the contemporary china
Economic development in the contemporary chinaRoddy Sunguro
 
The Chinese Economy
The Chinese EconomyThe Chinese Economy
The Chinese EconomySagar M
 
China’s Economic Miracle Under A Macro Economic View
China’s Economic Miracle Under A Macro Economic ViewChina’s Economic Miracle Under A Macro Economic View
China’s Economic Miracle Under A Macro Economic Viewhong_nona
 
Economy of china
Economy of chinaEconomy of china
Economy of china1vimal1
 
china's economic development
china's economic developmentchina's economic development
china's economic developmentFaisal Hassan
 
Economic history of Pakistan.
Economic history of Pakistan.Economic history of Pakistan.
Economic history of Pakistan.diaryinc
 
Comparing China with the Rest of the World
Comparing China with the Rest of the WorldComparing China with the Rest of the World
Comparing China with the Rest of the Worldguest4d585e
 
ECONOMIC HISTORY OF PAKISTAN 1950's
ECONOMIC HISTORY OF PAKISTAN 1950'sECONOMIC HISTORY OF PAKISTAN 1950's
ECONOMIC HISTORY OF PAKISTAN 1950'sSheikh Hasnain
 
Macro economic -Chinese economic - Unemployment rate
Macro economic -Chinese economic - Unemployment rateMacro economic -Chinese economic - Unemployment rate
Macro economic -Chinese economic - Unemployment rateThanh Phương Tống Trần
 

What's hot (20)

Emergence of china as a global power
Emergence of china as a global powerEmergence of china as a global power
Emergence of china as a global power
 
China- the next super power
China- the next super powerChina- the next super power
China- the next super power
 
Why Indian rupee is falling - August 2013
Why Indian rupee is falling - August 2013Why Indian rupee is falling - August 2013
Why Indian rupee is falling - August 2013
 
Economic challenges face by Pakistan"s economy and their solutions (1)
Economic challenges face by Pakistan"s economy and their solutions (1)Economic challenges face by Pakistan"s economy and their solutions (1)
Economic challenges face by Pakistan"s economy and their solutions (1)
 
Other Publishers: Real Estate Risk and Opportunities in China
Other Publishers: Real Estate Risk and Opportunities in ChinaOther Publishers: Real Estate Risk and Opportunities in China
Other Publishers: Real Estate Risk and Opportunities in China
 
China
ChinaChina
China
 
Aaron_Caté_wk13_Industrial Evolution
Aaron_Caté_wk13_Industrial EvolutionAaron_Caté_wk13_Industrial Evolution
Aaron_Caté_wk13_Industrial Evolution
 
Economic development in the contemporary china
Economic development in the contemporary chinaEconomic development in the contemporary china
Economic development in the contemporary china
 
Economic issues of pakistan
Economic issues of pakistanEconomic issues of pakistan
Economic issues of pakistan
 
The Chinese Economy
The Chinese EconomyThe Chinese Economy
The Chinese Economy
 
China’s Economic Miracle Under A Macro Economic View
China’s Economic Miracle Under A Macro Economic ViewChina’s Economic Miracle Under A Macro Economic View
China’s Economic Miracle Under A Macro Economic View
 
Ayub khan economic regime
Ayub khan economic regimeAyub khan economic regime
Ayub khan economic regime
 
Economy of china
Economy of chinaEconomy of china
Economy of china
 
china's economic development
china's economic developmentchina's economic development
china's economic development
 
Economic history of Pakistan.
Economic history of Pakistan.Economic history of Pakistan.
Economic history of Pakistan.
 
Red Star over Asia
Red Star over AsiaRed Star over Asia
Red Star over Asia
 
Agriculture
AgricultureAgriculture
Agriculture
 
Comparing China with the Rest of the World
Comparing China with the Rest of the WorldComparing China with the Rest of the World
Comparing China with the Rest of the World
 
ECONOMIC HISTORY OF PAKISTAN 1950's
ECONOMIC HISTORY OF PAKISTAN 1950'sECONOMIC HISTORY OF PAKISTAN 1950's
ECONOMIC HISTORY OF PAKISTAN 1950's
 
Macro economic -Chinese economic - Unemployment rate
Macro economic -Chinese economic - Unemployment rateMacro economic -Chinese economic - Unemployment rate
Macro economic -Chinese economic - Unemployment rate
 

Similar to Growth story of china

Similar to Growth story of china (20)

Macroeconomic
MacroeconomicMacroeconomic
Macroeconomic
 
Aging Problem of China : Impact and Solution
Aging Problem of China : Impact and SolutionAging Problem of China : Impact and Solution
Aging Problem of China : Impact and Solution
 
Essay About Economy
Essay About EconomyEssay About Economy
Essay About Economy
 
Essay About Economy
Essay About EconomyEssay About Economy
Essay About Economy
 
China Economy Presentation
China Economy PresentationChina Economy Presentation
China Economy Presentation
 
Risk and Opportunities in China
Risk and Opportunities in ChinaRisk and Opportunities in China
Risk and Opportunities in China
 
China economy..docx
China economy..docxChina economy..docx
China economy..docx
 
China's economic
China's economic China's economic
China's economic
 
China economy
China economyChina economy
China economy
 
Four phases of economic change 2
Four phases of economic change 2Four phases of economic change 2
Four phases of economic change 2
 
China economic growth.pptx
China economic growth.pptxChina economic growth.pptx
China economic growth.pptx
 
NCYM 2017 report by VSTPS
NCYM 2017 report by VSTPSNCYM 2017 report by VSTPS
NCYM 2017 report by VSTPS
 
All aboard the prosperity train, but who's driving
All aboard the prosperity train, but who's drivingAll aboard the prosperity train, but who's driving
All aboard the prosperity train, but who's driving
 
20 whychinais indina--212-218
20 whychinais indina--212-21820 whychinais indina--212-218
20 whychinais indina--212-218
 
Economic Super Powers Assignment Sample
Economic Super Powers Assignment SampleEconomic Super Powers Assignment Sample
Economic Super Powers Assignment Sample
 
Hyre Weekly Commentary
Hyre Weekly CommentaryHyre Weekly Commentary
Hyre Weekly Commentary
 
Econ presentation
Econ presentationEcon presentation
Econ presentation
 
Urban Poverty In China
Urban Poverty In ChinaUrban Poverty In China
Urban Poverty In China
 
Globalisation essay
Globalisation essayGlobalisation essay
Globalisation essay
 
The demographic dividend
The demographic dividendThe demographic dividend
The demographic dividend
 

Recently uploaded

VIP Kolkata Call Girl Serampore 👉 8250192130 Available With Room
VIP Kolkata Call Girl Serampore 👉 8250192130  Available With RoomVIP Kolkata Call Girl Serampore 👉 8250192130  Available With Room
VIP Kolkata Call Girl Serampore 👉 8250192130 Available With Roomdivyansh0kumar0
 
Russian Call Girls In Gtb Nagar (Delhi) 9711199012 💋✔💕😘 Naughty Call Girls Se...
Russian Call Girls In Gtb Nagar (Delhi) 9711199012 💋✔💕😘 Naughty Call Girls Se...Russian Call Girls In Gtb Nagar (Delhi) 9711199012 💋✔💕😘 Naughty Call Girls Se...
Russian Call Girls In Gtb Nagar (Delhi) 9711199012 💋✔💕😘 Naughty Call Girls Se...shivangimorya083
 
Attachment Of Assets......................
Attachment Of Assets......................Attachment Of Assets......................
Attachment Of Assets......................AmanBajaj36
 
Instant Issue Debit Cards - High School Spirit
Instant Issue Debit Cards - High School SpiritInstant Issue Debit Cards - High School Spirit
Instant Issue Debit Cards - High School Spiritegoetzinger
 
VIP Kolkata Call Girl Jodhpur Park 👉 8250192130 Available With Room
VIP Kolkata Call Girl Jodhpur Park 👉 8250192130  Available With RoomVIP Kolkata Call Girl Jodhpur Park 👉 8250192130  Available With Room
VIP Kolkata Call Girl Jodhpur Park 👉 8250192130 Available With Roomdivyansh0kumar0
 
VIP Call Girls Service Begumpet Hyderabad Call +91-8250192130
VIP Call Girls Service Begumpet Hyderabad Call +91-8250192130VIP Call Girls Service Begumpet Hyderabad Call +91-8250192130
VIP Call Girls Service Begumpet Hyderabad Call +91-8250192130Suhani Kapoor
 
High Class Call Girls Nagpur Grishma Call 7001035870 Meet With Nagpur Escorts
High Class Call Girls Nagpur Grishma Call 7001035870 Meet With Nagpur EscortsHigh Class Call Girls Nagpur Grishma Call 7001035870 Meet With Nagpur Escorts
High Class Call Girls Nagpur Grishma Call 7001035870 Meet With Nagpur Escortsranjana rawat
 
Log your LOA pain with Pension Lab's brilliant campaign
Log your LOA pain with Pension Lab's brilliant campaignLog your LOA pain with Pension Lab's brilliant campaign
Log your LOA pain with Pension Lab's brilliant campaignHenry Tapper
 
Q3 2024 Earnings Conference Call and Webcast Slides
Q3 2024 Earnings Conference Call and Webcast SlidesQ3 2024 Earnings Conference Call and Webcast Slides
Q3 2024 Earnings Conference Call and Webcast SlidesMarketing847413
 
Classical Theory of Macroeconomics by Adam Smith
Classical Theory of Macroeconomics by Adam SmithClassical Theory of Macroeconomics by Adam Smith
Classical Theory of Macroeconomics by Adam SmithAdamYassin2
 
government_intervention_in_business_ownership[1].pdf
government_intervention_in_business_ownership[1].pdfgovernment_intervention_in_business_ownership[1].pdf
government_intervention_in_business_ownership[1].pdfshaunmashale756
 
Call Girls Service Nagpur Maya Call 7001035870 Meet With Nagpur Escorts
Call Girls Service Nagpur Maya Call 7001035870 Meet With Nagpur EscortsCall Girls Service Nagpur Maya Call 7001035870 Meet With Nagpur Escorts
Call Girls Service Nagpur Maya Call 7001035870 Meet With Nagpur Escortsranjana rawat
 
Stock Market Brief Deck for 4/24/24 .pdf
Stock Market Brief Deck for 4/24/24 .pdfStock Market Brief Deck for 4/24/24 .pdf
Stock Market Brief Deck for 4/24/24 .pdfMichael Silva
 
VIP Call Girls Service Dilsukhnagar Hyderabad Call +91-8250192130
VIP Call Girls Service Dilsukhnagar Hyderabad Call +91-8250192130VIP Call Girls Service Dilsukhnagar Hyderabad Call +91-8250192130
VIP Call Girls Service Dilsukhnagar Hyderabad Call +91-8250192130Suhani Kapoor
 
OAT_RI_Ep19 WeighingTheRisks_Apr24_TheYellowMetal.pptx
OAT_RI_Ep19 WeighingTheRisks_Apr24_TheYellowMetal.pptxOAT_RI_Ep19 WeighingTheRisks_Apr24_TheYellowMetal.pptx
OAT_RI_Ep19 WeighingTheRisks_Apr24_TheYellowMetal.pptxhiddenlevers
 
Financial institutions facilitate financing, economic transactions, issue fun...
Financial institutions facilitate financing, economic transactions, issue fun...Financial institutions facilitate financing, economic transactions, issue fun...
Financial institutions facilitate financing, economic transactions, issue fun...Avanish Goel
 
Chapter 2.ppt of macroeconomics by mankiw 9th edition
Chapter 2.ppt of macroeconomics by mankiw 9th editionChapter 2.ppt of macroeconomics by mankiw 9th edition
Chapter 2.ppt of macroeconomics by mankiw 9th editionMuhammadHusnain82237
 
Monthly Market Risk Update: April 2024 [SlideShare]
Monthly Market Risk Update: April 2024 [SlideShare]Monthly Market Risk Update: April 2024 [SlideShare]
Monthly Market Risk Update: April 2024 [SlideShare]Commonwealth
 
fca-bsps-decision-letter-redacted (1).pdf
fca-bsps-decision-letter-redacted (1).pdffca-bsps-decision-letter-redacted (1).pdf
fca-bsps-decision-letter-redacted (1).pdfHenry Tapper
 
Instant Issue Debit Cards - School Designs
Instant Issue Debit Cards - School DesignsInstant Issue Debit Cards - School Designs
Instant Issue Debit Cards - School Designsegoetzinger
 

Recently uploaded (20)

VIP Kolkata Call Girl Serampore 👉 8250192130 Available With Room
VIP Kolkata Call Girl Serampore 👉 8250192130  Available With RoomVIP Kolkata Call Girl Serampore 👉 8250192130  Available With Room
VIP Kolkata Call Girl Serampore 👉 8250192130 Available With Room
 
Russian Call Girls In Gtb Nagar (Delhi) 9711199012 💋✔💕😘 Naughty Call Girls Se...
Russian Call Girls In Gtb Nagar (Delhi) 9711199012 💋✔💕😘 Naughty Call Girls Se...Russian Call Girls In Gtb Nagar (Delhi) 9711199012 💋✔💕😘 Naughty Call Girls Se...
Russian Call Girls In Gtb Nagar (Delhi) 9711199012 💋✔💕😘 Naughty Call Girls Se...
 
Attachment Of Assets......................
Attachment Of Assets......................Attachment Of Assets......................
Attachment Of Assets......................
 
Instant Issue Debit Cards - High School Spirit
Instant Issue Debit Cards - High School SpiritInstant Issue Debit Cards - High School Spirit
Instant Issue Debit Cards - High School Spirit
 
VIP Kolkata Call Girl Jodhpur Park 👉 8250192130 Available With Room
VIP Kolkata Call Girl Jodhpur Park 👉 8250192130  Available With RoomVIP Kolkata Call Girl Jodhpur Park 👉 8250192130  Available With Room
VIP Kolkata Call Girl Jodhpur Park 👉 8250192130 Available With Room
 
VIP Call Girls Service Begumpet Hyderabad Call +91-8250192130
VIP Call Girls Service Begumpet Hyderabad Call +91-8250192130VIP Call Girls Service Begumpet Hyderabad Call +91-8250192130
VIP Call Girls Service Begumpet Hyderabad Call +91-8250192130
 
High Class Call Girls Nagpur Grishma Call 7001035870 Meet With Nagpur Escorts
High Class Call Girls Nagpur Grishma Call 7001035870 Meet With Nagpur EscortsHigh Class Call Girls Nagpur Grishma Call 7001035870 Meet With Nagpur Escorts
High Class Call Girls Nagpur Grishma Call 7001035870 Meet With Nagpur Escorts
 
Log your LOA pain with Pension Lab's brilliant campaign
Log your LOA pain with Pension Lab's brilliant campaignLog your LOA pain with Pension Lab's brilliant campaign
Log your LOA pain with Pension Lab's brilliant campaign
 
Q3 2024 Earnings Conference Call and Webcast Slides
Q3 2024 Earnings Conference Call and Webcast SlidesQ3 2024 Earnings Conference Call and Webcast Slides
Q3 2024 Earnings Conference Call and Webcast Slides
 
Classical Theory of Macroeconomics by Adam Smith
Classical Theory of Macroeconomics by Adam SmithClassical Theory of Macroeconomics by Adam Smith
Classical Theory of Macroeconomics by Adam Smith
 
government_intervention_in_business_ownership[1].pdf
government_intervention_in_business_ownership[1].pdfgovernment_intervention_in_business_ownership[1].pdf
government_intervention_in_business_ownership[1].pdf
 
Call Girls Service Nagpur Maya Call 7001035870 Meet With Nagpur Escorts
Call Girls Service Nagpur Maya Call 7001035870 Meet With Nagpur EscortsCall Girls Service Nagpur Maya Call 7001035870 Meet With Nagpur Escorts
Call Girls Service Nagpur Maya Call 7001035870 Meet With Nagpur Escorts
 
Stock Market Brief Deck for 4/24/24 .pdf
Stock Market Brief Deck for 4/24/24 .pdfStock Market Brief Deck for 4/24/24 .pdf
Stock Market Brief Deck for 4/24/24 .pdf
 
VIP Call Girls Service Dilsukhnagar Hyderabad Call +91-8250192130
VIP Call Girls Service Dilsukhnagar Hyderabad Call +91-8250192130VIP Call Girls Service Dilsukhnagar Hyderabad Call +91-8250192130
VIP Call Girls Service Dilsukhnagar Hyderabad Call +91-8250192130
 
OAT_RI_Ep19 WeighingTheRisks_Apr24_TheYellowMetal.pptx
OAT_RI_Ep19 WeighingTheRisks_Apr24_TheYellowMetal.pptxOAT_RI_Ep19 WeighingTheRisks_Apr24_TheYellowMetal.pptx
OAT_RI_Ep19 WeighingTheRisks_Apr24_TheYellowMetal.pptx
 
Financial institutions facilitate financing, economic transactions, issue fun...
Financial institutions facilitate financing, economic transactions, issue fun...Financial institutions facilitate financing, economic transactions, issue fun...
Financial institutions facilitate financing, economic transactions, issue fun...
 
Chapter 2.ppt of macroeconomics by mankiw 9th edition
Chapter 2.ppt of macroeconomics by mankiw 9th editionChapter 2.ppt of macroeconomics by mankiw 9th edition
Chapter 2.ppt of macroeconomics by mankiw 9th edition
 
Monthly Market Risk Update: April 2024 [SlideShare]
Monthly Market Risk Update: April 2024 [SlideShare]Monthly Market Risk Update: April 2024 [SlideShare]
Monthly Market Risk Update: April 2024 [SlideShare]
 
fca-bsps-decision-letter-redacted (1).pdf
fca-bsps-decision-letter-redacted (1).pdffca-bsps-decision-letter-redacted (1).pdf
fca-bsps-decision-letter-redacted (1).pdf
 
Instant Issue Debit Cards - School Designs
Instant Issue Debit Cards - School DesignsInstant Issue Debit Cards - School Designs
Instant Issue Debit Cards - School Designs
 

Growth story of china

  • 1. Journal of Economic Perspectives—Volume 26, Number 4—Fall 2012—Pages 103–124 TT he pace and scale of China’s economic transformation have no historicalhe pace and scale of China’s economic transformation have no historical precedent. In 1978, China was one of the poorest countries in the world.precedent. In 1978, China was one of the poorest countries in the world. The real per capita GDP in China was only one-fortieth of the U.S. levelThe real per capita GDP in China was only one-fortieth of the U.S. level and one-tenth the Brazilian level. Since then, China’s real per capita GDP hasand one-tenth the Brazilian level. Since then, China’s real per capita GDP has grown at an average rate exceeding 8 percent per year. As a result, China’s real pergrown at an average rate exceeding 8 percent per year. As a result, China’s real per capita GDP is now almost one-fifth the U.S. level and at the same level as Brazil.capita GDP is now almost one-fifth the U.S. level and at the same level as Brazil. This rapid and sustained improvement in average living standard has occurred in aThis rapid and sustained improvement in average living standard has occurred in a country with more than 20 percent of the world’s population so that China is nowcountry with more than 20 percent of the world’s population so that China is now the second-largest economy in the world.the second-largest economy in the world. To set the stage in this paper, I will begin by discussing briefly China’s historicalTo set the stage in this paper, I will begin by discussing briefly China’s historical growth performance: that is, how China went from the world’s leading economicgrowth performance: that is, how China went from the world’s leading economic power about 900 years ago to a situation in which it essentially missed the Indus-power about 900 years ago to a situation in which it essentially missed the Indus- trial Revolution and had close-to-zero growth in per capita GDP from 1800 to 1950.trial Revolution and had close-to-zero growth in per capita GDP from 1800 to 1950. I then present growth accounting results for the period from 1952 to 1978 and theI then present growth accounting results for the period from 1952 to 1978 and the period since 1978, using as my starting point a standard growth accounting exerciseperiod since 1978, using as my starting point a standard growth accounting exercise that decomposes the sources of growth into capital deepening, labor deepening,that decomposes the sources of growth into capital deepening, labor deepening, and productivity growth. For the period from 1952 to 1978, China’s per capita GDPand productivity growth. For the period from 1952 to 1978, China’s per capita GDP did rise by about 3 percent per year, but all of the growth was due to forced increasesdid rise by about 3 percent per year, but all of the growth was due to forced increases in government investment as well as a rise in education levels. Productivity actu-in government investment as well as a rise in education levels. Productivity actu- ally regressed during this period, as China’s economy went through the enormousally regressed during this period, as China’s economy went through the enormous disruptions of the famine in the late 1950s and the Cultural Revolution startingdisruptions of the famine in the late 1950s and the Cultural Revolution starting in the late 1960s. But the main focus of this paper will be to examine the sourcesin the late 1960s. But the main focus of this paper will be to examine the sources of growth since 1978, the year when China started economic reform. Perhapsof growth since 1978, the year when China started economic reform. Perhaps Understanding China’s Growth: Past, Present, and Future ■■ Xiaodong Zhu is Professor of Economics, University of Toronto, Toronto, Ontario, Canada. His email address is xzhu@chass.utoronto.ca. http://dx.doi.org/10.1257/jep.26.4.103. doi=10.1257/jep.26.4.103 Xiaodong Zhu
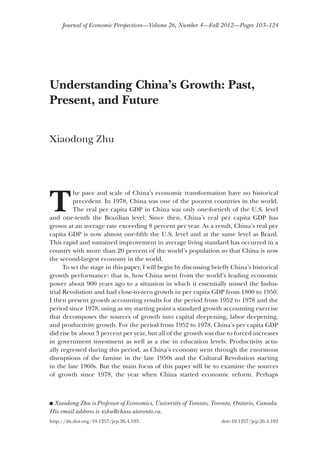
  • 2. 104 Journal of Economic Perspectives surprisingly, given China’s well-documented sky-high rates of saving and investment,surprisingly, given China’s well-documented sky-high rates of saving and investment, I will argue that China’s rapid growth over the last three decades has been drivenI will argue that China’s rapid growth over the last three decades has been driven by productivity growth rather than by capital investment. The growth contributionsby productivity growth rather than by capital investment. The growth contributions made by human capital accumulation and an increase in labor participation aremade by human capital accumulation and an increase in labor participation are positive but modest. I will also examine the contributions of sector-level productivitypositive but modest. I will also examine the contributions of sector-level productivity growth, and of resource reallocation across sectors and across firms within a sector,growth, and of resource reallocation across sectors and across firms within a sector, to aggregate productivity growth. Overall, gradual and persistent institutionalto aggregate productivity growth. Overall, gradual and persistent institutional change and policy reforms that have reduced distortions and improved economicchange and policy reforms that have reduced distortions and improved economic incentives are the main reasons for the productivity growth.incentives are the main reasons for the productivity growth. Despite the rapid growth of the last three decades, China’s productivity is stillDespite the rapid growth of the last three decades, China’s productivity is still only 13 percent of the U.S. level, which suggests that China still has plenty of roomonly 13 percent of the U.S. level, which suggests that China still has plenty of room for productivity growth through further economic reforms. Even if China can repli-for productivity growth through further economic reforms. Even if China can repli- cate its extraordinary growth performance for another two decades, its productivitycate its extraordinary growth performance for another two decades, its productivity would still be only around 40 percent of the frontier productivity level.would still be only around 40 percent of the frontier productivity level. Before delving into the analysis, let me first mention the three main data sourcesBefore delving into the analysis, let me first mention the three main data sources that I use for this paper. For examining China’s historical performance, I use the datathat I use for this paper. For examining China’s historical performance, I use the data constructed by Madison (2007); for comparing China with other countries, I use theconstructed by Madison (2007); for comparing China with other countries, I use the purchasing power parity data from Penn World Table (PWT7.0); and for detailedpurchasing power parity data from Penn World Table (PWT7.0); and for detailed growth accounting exercises, I mainly use the data series my coauthor and I constructedgrowth accounting exercises, I mainly use the data series my coauthor and I constructed for Brandt and Zhu (2010), in which we made adjustments to China’s official statisticsfor Brandt and Zhu (2010), in which we made adjustments to China’s official statistics by using alternative deflators and information from household surveys.by using alternative deflators and information from household surveys. China’s Historical Economic Performance China was a world economic and technological leader in the “premodern” era.China was a world economic and technological leader in the “premodern” era. Many historians think that China’s premodern economic performance reached aMany historians think that China’s premodern economic performance reached a peak in the Song Dynasty (circa 1200) when China is though to have had the mostpeak in the Song Dynasty (circa 1200) when China is though to have had the most advancedtechnologies(NeedhamandRonan1978),thehighestironoutput(Hartwelladvancedtechnologies(NeedhamandRonan1978),thehighestironoutput(Hartwell 1962), the highest urbanization rate (Chao 1986), and the largest national economy1962), the highest urbanization rate (Chao 1986), and the largest national economy (Madison 2007) in the world. However, sometime between 1500 and 1800, China lost(Madison 2007) in the world. However, sometime between 1500 and 1800, China lost its leadership position to Western Europe. Figure 1 plots Angus Madison’s estimatesits leadership position to Western Europe. Figure 1 plots Angus Madison’s estimates of per capita GDP for China and Western Europe. According to his estimates, China’sof per capita GDP for China and Western Europe. According to his estimates, China’s per capita GDP stagnated between 1500 and 1800 while Western Europe’s per capitaper capita GDP stagnated between 1500 and 1800 while Western Europe’s per capita GDP increased steadily during the same period. These estimates suggest that, by theGDP increased steadily during the same period. These estimates suggest that, by the end of the fifteenth century, China had already started to fall behind Western Europe,end of the fifteenth century, China had already started to fall behind Western Europe, wellwell before the Industrial Revolution occurred in England. Some historians and econo-the Industrial Revolution occurred in England. Some historians and econo- mists attribute China’s falling behind during this period to the more centralized andmists attribute China’s falling behind during this period to the more centralized and inward-looking political systems of the Ming (1368–1644) and Qing (1644–1911)inward-looking political systems of the Ming (1368–1644) and Qing (1644–1911) dynasties that stifled innovation and commercial activities in China.dynasties that stifled innovation and commercial activities in China. Not all economic historians agree with this explanation. Kenneth PomeranzNot all economic historians agree with this explanation. Kenneth Pomeranz (2000) argues in(2000) argues in The Great Divergence that in the eighteenth century, living stan-that in the eighteenth century, living stan- dards and the degree of commercialization in China’s Lower Yangzi region weredards and the degree of commercialization in China’s Lower Yangzi region were comparable to those in the richest parts of Europe and that China only startedcomparable to those in the richest parts of Europe and that China only started
  • 3. Xiaodong Zhu 105 to fall behind Western Europeto fall behind Western Europe after the Industrial Revolution in England. Shiuethe Industrial Revolution in England. Shiue and Keller (2007) provide evidence that in the late eighteenth century, the degreeand Keller (2007) provide evidence that in the late eighteenth century, the degree of market integration was higher in the Lower Yangzi region than in continentalof market integration was higher in the Lower Yangzi region than in continental Europe and only slightly lower than that in England. Instead of asking what wentEurope and only slightly lower than that in England. Instead of asking what went wrong in China, Pomeranz attributes the success of the Industrial Revolution towrong in China, Pomeranz attributes the success of the Industrial Revolution to two lucky breaks for England: accesses to coal and colonies.two lucky breaks for England: accesses to coal and colonies. The questions of why China was not able to maintain its technological lead and theThe questions of why China was not able to maintain its technological lead and the exact time when China started to fall behind Western Europe remain unresolved. Thereexact time when China started to fall behind Western Europe remain unresolved. There is no doubt, however, about the great divergence in economic performance betweenis no doubt, however, about the great divergence in economic performance between China and Western Europe in the nineteenth century and the first half of the twentiethChina and Western Europe in the nineteenth century and the first half of the twentieth century. Brandt, Ma, and Rawski (2012) review the debates over possible causes and thecentury. Brandt, Ma, and Rawski (2012) review the debates over possible causes and the related literature. They argue that China’s economic failure during this time periodrelated literature. They argue that China’s economic failure during this time period was due to an imperial political-institutional system that protected vested interests ofwas due to an imperial political-institutional system that protected vested interests of elite groups—like imperial households, members of bureaucracy, and local gentry—elite groups—like imperial households, members of bureaucracy, and local gentry— who in turn were resistant to adoptions of new technologies. This imperial system waswho in turn were resistant to adoptions of new technologies. This imperial system was significantly weakened and eventually collapsed after two Opium Wars between Chinasignificantly weakened and eventually collapsed after two Opium Wars between China and Great Britain in the 1840s and 1850s and the Sino-Japanese War of 1894–95. Theand Great Britain in the 1840s and 1850s and the Sino-Japanese War of 1894–95. The series of Chinese defeats was in effect a forced opening of China’s borders, and it ledseries of Chinese defeats was in effect a forced opening of China’s borders, and it led to territories and treaty ports being conceded to the West and to Japan. These changesto territories and treaty ports being conceded to the West and to Japan. These changes brought to China industrial technologies and factories, but continuous civil wars andbrought to China industrial technologies and factories, but continuous civil wars and World War II prevented the industrialization process from gaining much momentumWorld War II prevented the industrialization process from gaining much momentum in China until the 1950s. Indeed, industrialization had so little effect during this timein China until the 1950s. Indeed, industrialization had so little effect during this time that China’s per capita GDPthat China’s per capita GDP declined between 1800 and 1950.between 1800 and 1950. Figure 1 Per capita GDP of China and Western Europe Source: Madison (2007). 100 1,000 10,000 100,000 1500 1550 1600 1650 1700 1750 1800 1850 1900 1950 2000 Western Europe China 1990internationaldollars(logarithmicscale)
  • 4. 106 Journal of Economic Perspectives A Growth Accounting Decomposition for Modern China After the establishment of the People’s Republic in October 1949, China finallyAfter the establishment of the People’s Republic in October 1949, China finally started its industrialization process in the early 1950s. However, growth perfor-started its industrialization process in the early 1950s. However, growth perfor- mance before and after 1978 differs significantly. Prior to 1978, the average growthmance before and after 1978 differs significantly. Prior to 1978, the average growth rate of real per capita GDP was a modest 3 percent a year, not much different fromrate of real per capita GDP was a modest 3 percent a year, not much different from the growth rate in the United States though starting from a much lower base.the growth rate in the United States though starting from a much lower base. Since 1978, China’s growth in per capita GDP has accelerated to a rate in excess ofSince 1978, China’s growth in per capita GDP has accelerated to a rate in excess of 8 percent per year, and Figure 2 shows (on a log scale) how China’s per capita GDP8 percent per year, and Figure 2 shows (on a log scale) how China’s per capita GDP has begun to close the gap with U.S. per capita GDP.has begun to close the gap with U.S. per capita GDP. Why did China’s growth performance differ so much before and after 1978? ToWhy did China’s growth performance differ so much before and after 1978? To answer this question, I begin in this section by using the standard growth accountinganswer this question, I begin in this section by using the standard growth accounting method to take a look at the sources of China’s growth in both periods, which showsmethod to take a look at the sources of China’s growth in both periods, which shows that capital accumulation was the main source of economic growth in the 1952–1978that capital accumulation was the main source of economic growth in the 1952–1978 period while productivity growth has been the main source of growth since then.period while productivity growth has been the main source of growth since then. In the next two sections, I offer more details on these two periods, including whyIn the next two sections, I offer more details on these two periods, including why the capital-investment-led growth of the 1952–1978 period was unsustainable andthe capital-investment-led growth of the 1952–1978 period was unsustainable and came at such a high cost to the country, and what has been underlying the rapidcame at such a high cost to the country, and what has been underlying the rapid productivity growth since 1978.productivity growth since 1978. Let the relationship between production inputs (physical capital, humanLet the relationship between production inputs (physical capital, human capital, and labor) and GDP be represented by a standard Cobb–Douglas produc-capital, and labor) and GDP be represented by a standard Cobb–Douglas produc- tion function:tion function: Y = AKα (hL)1–α . Figure 2 GDP per capita of China and US: 1952–2009 100 1,000 10,000 100,000 1952 2005internationaldollar(logarithmicscale) Pre-reform period Reform period 2009 1957 1962 1967 1972 1977 1982 1987 1992 1997 2002 2007 United States China
  • 5. Understanding China’s Growth: Past, Present, and Future 107 Here Y is GDP, K is physical capital stock, L is labor (number of workers), h is the average level of human capital, A is total factor productivity (TFP), and α is the output elasticity of physical capital, which is usually measured by capital’s share of national income. Hall and Jones (1999) show how to use this framework to calculate per capita GDP,1 while Kehoe and Prescott (2002) note that in this framework the growth rate of per capita GDP can be decomposed as the sum of four terms: Growth rate of per capita GDP = growth rate of labor participation rate + α/(1 – α) growth rate of the capital/output ratio + growth rate of average human capital + 1/(1 – α) growth rate of total factor productivity. Note that in this decomposition the contribution of total factor productivity growth is weighted by 1/(1 – α), taking into account both the direct contribution of total factor productivity and the indirect contribution through its impact on capital accumulation. For Table 1, I will set the value ofFor Table 1, I will set the value of α to 1to 1//2 (as in Brandt, Hsieh, and Zhu 2008)2 (as in Brandt, Hsieh, and Zhu 2008) to match China’s average capital income share as reported in China’s nationalto match China’s average capital income share as reported in China’s national accounts. With this assumption in place, Table 1 presents a decomposition of China’saccounts. With this assumption in place, Table 1 presents a decomposition of China’s per capita GDP growth into contributions from growth of the labor participationper capita GDP growth into contributions from growth of the labor participation rate, the capital/output ratio, average human capital, and total factor productivity.rate, the capital/output ratio, average human capital, and total factor productivity.22 This decomposition reveals very different patterns of growth in the two periods.This decomposition reveals very different patterns of growth in the two periods. In the pre-1978 period, growth was mainly coming from increases in both physicalIn the pre-1978 period, growth was mainly coming from increases in both physical and human capital rather than increases in productive efficiency. Total factorand human capital rather than increases in productive efficiency. Total factor productivity actually deteriorated during this period, declining by 1.07 percent perproductivity actually deteriorated during this period, declining by 1.07 percent per year. Due to the increases in average schooling years, average human capital grewyear. Due to the increases in average schooling years, average human capital grew at 1.55 percent a year, partially offseting the reduction in total factor productivity.at 1.55 percent a year, partially offseting the reduction in total factor productivity. 1 Specifically, Hall and Jones (1999) show that in this Cobb–Douglas framework one can express the GDP per capita in the following way: Y_ Pop = L_ Pop (K_ Y ) α_ 1–α hA 1_ 1–α . In this formulation, Pop is the population. GDP per capita can thus be calculated as the product of four terms: the labor participation rate, the capital/output ratio raised to the power of α/(1 – α), the average level of human capital, and total factor productivity raised to the power of 1/(1 – α) . The other variables are defined in the text. 2 The data on GDP per capita, GDP per worker, and labor participation rate are taken from the Penn World Table (PWT7.0). The Penn World Table contains two versions of data for China. I use version 1 because it is more consistent with the series we constructed for Brandt and Zhu (2010) using China’s national accounts data, with adjustments made to deflators in a way that is similar to what Alwyn Young (2003) did for the data over a shorter period of time. The physical capital stock data are constructed using the real investment data from the PWT7.0 and the perpetual inventory method with a depreciation rate of 0.06. The initial capital stock in 1952 was set to I52/(0.06 + ln(I57/I52)/5), where It is the real investment in year t. The average level of human capital is constructed using the average schooling years reported in the Barro and Lee (2010) dataset and the method of Hall and Jones (1999).
  • 6. 108 Journal of Economic Perspectives The labor participation rate increased slightly, growing at 0.11 percent a year. TheThe labor participation rate increased slightly, growing at 0.11 percent a year. The most important source of growth was increases in the physical capital/output ratio,most important source of growth was increases in the physical capital/output ratio, which on average grew 3.45 percentage points a year and accounted for 116 percentwhich on average grew 3.45 percentage points a year and accounted for 116 percent of the per capita GDP growth.of the per capita GDP growth. After 1978, capital accumulation and total factor productivity growth reversedAfter 1978, capital accumulation and total factor productivity growth reversed their roles. Between 1978 and 2007, the physical capital/output ratio remainedtheir roles. Between 1978 and 2007, the physical capital/output ratio remained roughly constant and the average human capital growth rate was lower than theroughly constant and the average human capital growth rate was lower than the growth rate in the pre-1978 period. The two sources combined contributed togrowth rate in the pre-1978 period. The two sources combined contributed to around 15 percent of the growth in per capita GDP. Demographic factors played aaround 15 percent of the growth in per capita GDP. Demographic factors played a very limited role. Partly due to the one child policy, the labor participation rate grewvery limited role. Partly due to the one child policy, the labor participation rate grew at 0.57 percent a year during this period, faster than in the pre-1978 period. But theat 0.57 percent a year during this period, faster than in the pre-1978 period. But the contribution of the increases in labor participation rate was still modest, accountingcontribution of the increases in labor participation rate was still modest, accounting for only about 7 percent of the growth. In contrast, total factor productivity grewfor only about 7 percent of the growth. In contrast, total factor productivity grew rapidly at 3.16 percent a year. (Bosworth and Collins, 2008, in this journal, andrapidly at 3.16 percent a year. (Bosworth and Collins, 2008, in this journal, and Perkins and Rawski, 2008, report similar results in their growth accounting exer-Perkins and Rawski, 2008, report similar results in their growth accounting exer- cises.) Since the contribution of total factor productivity growth is weighted bycises.) Since the contribution of total factor productivity growth is weighted by 1/(1 –1/(1 – αα) and) and αα is 0.5, the growth contribution of total factor productivity growth isis 0.5, the growth contribution of total factor productivity growth is 22 ×× 3.163.16 == 6.32 percentage points, or 78 percent of the growth in GDP per capita.6.32 percentage points, or 78 percent of the growth in GDP per capita. The finding that aggregate productivity growth has been the most importantThe finding that aggregate productivity growth has been the most important source of China’s growth since 1978 may seem surprising because it runs in thesource of China’s growth since 1978 may seem surprising because it runs in the face of a popular view that China has followed anface of a popular view that China has followed an investment-driven growth modelgrowth model that relied heavily on capital-deepening for growth over the last three decades (forthat relied heavily on capital-deepening for growth over the last three decades (for Table 1 Decomposing China’s Growth: 1952–2007 Average annual growth rates (%) Period GDP per capita Labor partication rate Capital/output ratio Average human capital TFP 1952–1978 2.97 0.11 3.45 1.55 –1.07 1978–2007 8.12 0.57 0.04 1.18 3.16 Contributions to per capita GDP growth Period GDP per capita Labor partication rate Capital/output ratio Average human capital TFP 1952–1978 100 3.63 116.15 52.25 –72.03 1978–2007 100 7.05 0.51 14.55 77.89 Source: Authors calculations. The data on GDP per capita, GDP per worker, and labor participation rate are taken from the Penn World Table (PWT7.0). The average level of human capital is constructed using the average schooling years reported in the Barro and Lee (2010) dataset. See footnote 2 for details. Notes: Table 1 presents a decomposition of China’s per capita GDP growth into contributions from growth of labor participation rate, capital/output ratio, average human capital, and total factor productivity. “TFP” is total factor productivity. See text for details.
  • 7. Xiaodong Zhu 109 example, Wolf 2011). But, although the share of annual GDP that flows to real fixedexample, Wolf 2011). But, although the share of annual GDP that flows to real fixed capital investment in China increased from 33 percent to 39 percent between 1978capital investment in China increased from 33 percent to 39 percent between 1978 and 2007, China’s capital-to-output ratio barely increased during this time. China’sand 2007, China’s capital-to-output ratio barely increased during this time. China’s capital investment since 1978 has been keeping up with its rapid rate of outputcapital investment since 1978 has been keeping up with its rapid rate of output growth but not leading it. Examining the data between 1978 and 1998, Younggrowth but not leading it. Examining the data between 1978 and 1998, Young (2003) also comes to the conclusion that capital deepening was(2003) also comes to the conclusion that capital deepening was not the source ofthe source of China’s growth. As Solow (1956) taught us: persistent economic growth can onlyChina’s growth. As Solow (1956) taught us: persistent economic growth can only come from growth in total factor productivity. More than three decades of rapidcome from growth in total factor productivity. More than three decades of rapid economic growth in China would not have been possible without significant growtheconomic growth in China would not have been possible without significant growth in aggregate total factor productivity.in aggregate total factor productivity. Government-led Industrialization between 1952 and 1978 AfterthePeople’sRepublicofChinawasestablishedin1949,theChineseCommu-AfterthePeople’sRepublicofChinawasestablishedin1949,theChineseCommu- nist Party government, like governments of many other countries at the time, thoughtnist Party government, like governments of many other countries at the time, thought the most effective way to speed up the industrialization process was by increasingthe most effective way to speed up the industrialization process was by increasing investment in heavy industries such as steel, concrete, and heavy machinery. China’sinvestment in heavy industries such as steel, concrete, and heavy machinery. China’s government mobilized the resources for investment by limiting household consump-government mobilized the resources for investment by limiting household consump- tion and setting low prices for agricultural goods so that forced savings and surplusestion and setting low prices for agricultural goods so that forced savings and surpluses extracted from the agricultural sector could be used for investment in such industries.extracted from the agricultural sector could be used for investment in such industries. This strategy of extensive growth based so heavily on capital accumulation wasThis strategy of extensive growth based so heavily on capital accumulation was not sustainable and had grave welfare consequences. The big push towards industri-not sustainable and had grave welfare consequences. The big push towards industri- alization during the Great Leap Forward years (1958–1960) not only failed to raisealization during the Great Leap Forward years (1958–1960) not only failed to raise the GDP growth rate, it also had such disruptive effects on agricultural productionthe GDP growth rate, it also had such disruptive effects on agricultural production that a severe famine occurred when China was hit by adverse weather shocks inthat a severe famine occurred when China was hit by adverse weather shocks in 1959 (Li and Yang 2005). The Great Leap Forward became the Great Leap Famine1959 (Li and Yang 2005). The Great Leap Forward became the Great Leap Famine of 1959–1961, when the official statistics admit to 15 million deaths and unofficialof 1959–1961, when the official statistics admit to 15 million deaths and unofficial estimates suggest double that number or more.estimates suggest double that number or more. Despite these disastrous results, the Chinese government continued its unbal-Despite these disastrous results, the Chinese government continued its unbal- anced growth strategy with only minor adjustments after the famine. Unfavorableanced growth strategy with only minor adjustments after the famine. Unfavorable terms of trade were set on farm products, which effectively imposed heavy taxesterms of trade were set on farm products, which effectively imposed heavy taxes on farmers. Theon farmers. The hukou or household registration system was implemented to keepor household registration system was implemented to keep heavily taxed farmers from leaving rural areas. Furthermore, farmers were prohibitedheavily taxed farmers from leaving rural areas. Furthermore, farmers were prohibited from engaging in any nonfarm activities. These policies initially helped to ensure thatfrom engaging in any nonfarm activities. These policies initially helped to ensure that the government could extract surpluses from the agricultural sector to support thethe government could extract surpluses from the agricultural sector to support the capital accumulation in the industrial sector. However, they also created incentivecapital accumulation in the industrial sector. However, they also created incentive problems that significantly reduced the productivity of farmers. As a result, agricul-problems that significantly reduced the productivity of farmers. As a result, agricul- tural output grew slowly. In the late 1970s, the agricultural sector included more thantural output grew slowly. In the late 1970s, the agricultural sector included more than 70 percent of China’s labor force but was not even able to provide China’s population70 percent of China’s labor force but was not even able to provide China’s population with 2,300 calories per capita per day (near the UN-established minimum). Emer-with 2,300 calories per capita per day (near the UN-established minimum). Emer- gency grain imports were frequently needed to meet food deficits (Huang, Otsuka,gency grain imports were frequently needed to meet food deficits (Huang, Otsuka, and Rozelle 2008). China’s nonagricultural sector was little better. It was dominatedand Rozelle 2008). China’s nonagricultural sector was little better. It was dominated by the state-owned enterprises in which resource allocation and production activitiesby the state-owned enterprises in which resource allocation and production activities
  • 8. 110 Journal of Economic Perspectives were carried out according to government plan rather than market signals. Most ofwere carried out according to government plan rather than market signals. Most of the state-owned enterprises at that time were inefficient, overflowing with redundantthe state-owned enterprises at that time were inefficient, overflowing with redundant workers, and often producing output for which there was no market demand. At theworkers, and often producing output for which there was no market demand. At the same time, there were very few firms in the light industries like home appliances,same time, there were very few firms in the light industries like home appliances, furniture, and clothing, and there were constant shortages of consumer products.furniture, and clothing, and there were constant shortages of consumer products. Given this background, it may seem paradoxical that China’s economyGiven this background, it may seem paradoxical that China’s economy managed an average per capita GDP growth rate of even 3 percent from 1952 tomanaged an average per capita GDP growth rate of even 3 percent from 1952 to 1978. The main reason for such a gain, as earlier emphasized earlier in Table 1, was1978. The main reason for such a gain, as earlier emphasized earlier in Table 1, was the increases in physical and human capital, both of which were at very low levelsthe increases in physical and human capital, both of which were at very low levels in 1952. The capital/output ratio rose by about 140 percent during this time, fromin 1952. The capital/output ratio rose by about 140 percent during this time, from 0.91 in 1952 to 2.22 in 1978. In addition, average years of education rose from 0.740.91 in 1952 to 2.22 in 1978. In addition, average years of education rose from 0.74 in 1952 to 3.75 in 1978. Even with the substantial decline in aggregate productivity,in 1952 to 3.75 in 1978. Even with the substantial decline in aggregate productivity, these factors were sufficient to increase China’s per capita GDP over this time.these factors were sufficient to increase China’s per capita GDP over this time. In summary, the industrialization policies pursued by the Chinese governmentIn summary, the industrialization policies pursued by the Chinese government during this period from 1952 to 1978 created adverse incentives and gross misal-during this period from 1952 to 1978 created adverse incentives and gross misal- location of resources that resulted in declining aggregate productivity, recurringlocation of resources that resulted in declining aggregate productivity, recurring food crises, and relatively little improvement in living standards.food crises, and relatively little improvement in living standards. Sectoral Shifts and Productivity Growth Since 1978 When the Cultural Revolution ended after the death of the Communist PartyWhen the Cultural Revolution ended after the death of the Communist Party chairman Mao Zedong in 1976, the Chinese government under the leadership ofchairman Mao Zedong in 1976, the Chinese government under the leadership of Deng Xiaoping sought to increase its legitimacy by improving aggregate economicDeng Xiaoping sought to increase its legitimacy by improving aggregate economic performance and raising living standards. In December 1978, the governmentperformance and raising living standards. In December 1978, the government decided on a general policy ofdecided on a general policy of Gaige Kaifang or “reform and opening up.” Xu (2011)or “reform and opening up.” Xu (2011) reviews the institutional changes during the reform period in China. There was noreviews the institutional changes during the reform period in China. There was no grand design of systematic reform policies; instead, economic reforms have takengrand design of systematic reform policies; instead, economic reforms have taken place in a gradual, experimental, and decentralized fashion. How did the reformsplace in a gradual, experimental, and decentralized fashion. How did the reforms generate such impressive growth? Is the growth sustainable? As a starting point togenerate such impressive growth? Is the growth sustainable? As a starting point to answering this question, in this section, I look at productivity growth in differentanswering this question, in this section, I look at productivity growth in different sectors and the reallocation of labor across sectors. In the following two sections,sectors and the reallocation of labor across sectors. In the following two sections, I then discuss the key economic reforms and institutional changes that were behindI then discuss the key economic reforms and institutional changes that were behind the sector-level productivity growth in agriculture and in the nonstate sector.the sector-level productivity growth in agriculture and in the nonstate sector. Table 2 presents total factor productivity growth rates of the aggregateTable 2 presents total factor productivity growth rates of the aggregate economy, the agricultural sector, and the nonagricultural sector. Because of theeconomy, the agricultural sector, and the nonagricultural sector. Because of the importance of the state sector in the Chinese economy, the nonagricultural sectorimportance of the state sector in the Chinese economy, the nonagricultural sector is divided into the state and the nonstate sectors. The “state sector” includesis divided into the state and the nonstate sectors. The “state sector” includes both state-owned enterprises and shareholding companies; and the “nonstateboth state-owned enterprises and shareholding companies; and the “nonstate sector” includes domestic private firms, foreign-invested firms,sector” includes domestic private firms, foreign-invested firms,33 and collectiveand collective 3 In China, “foreign-invested” firm is a term used for any one of a number of legal entities with foreign stakeholders, including equity joint ventures, cooperative joint ventures, wholly-owned foreign enter- prises, and foreign-invested companies limited by shares.
  • 9. Understanding China’s Growth: Past, Present, and Future 111 firms in the nonagricultural sector. We include the shareholding companies infirms in the nonagricultural sector. We include the shareholding companies in the state sector because many of them are former state-owned enterprises thatthe state sector because many of them are former state-owned enterprises that were restructured into shareholding companies after the mid-1990s but are stillwere restructured into shareholding companies after the mid-1990s but are still controlled by the state. They continue to receive favorable treatment by thecontrolled by the state. They continue to receive favorable treatment by the state, have easy access to bank credit, and are concentrated in protected indus-state, have easy access to bank credit, and are concentrated in protected indus- tries such as energy and telecommunication. In contrast, the collective firms,tries such as energy and telecommunication. In contrast, the collective firms, including those that are controlled by lower-level governments, receive littleincluding those that are controlled by lower-level governments, receive little support from the state and, like domestic private firms, have difficulties gettingsupport from the state and, like domestic private firms, have difficulties getting bank credit and entering into protected industries. Thus, we include them in thebank credit and entering into protected industries. Thus, we include them in the nonstate sector.nonstate sector. The growth rates are reported for the entire period of 1978–2007 and threeThe growth rates are reported for the entire period of 1978–2007 and three subperiods. The productivity growth rates are calculated using China’s officialsubperiods. The productivity growth rates are calculated using China’s official national accounts data on nominal output and fixed investment, the revised GDPnational accounts data on nominal output and fixed investment, the revised GDP and fixed investment deflators, the revised employment series that is consistent withand fixed investment deflators, the revised employment series that is consistent with Table 2 Employment Share, GDP Share, and Total Factor Productivity Growth by Sector Average annual total factor productivity growth (%) Nonagricultural sector Period Agriculture Nonstate State Aggregate 1978–2007 4.01 3.91 1.68 3.61 1978–1988 2.79 5.87 –0.36 3.83 1988–1998 5.10 2.17 0.27 2.45 1998–2007 4.13 3.67 5.50 4.68 Year Employment share (%) 1978 69 15 16 100 2007 26 62 12 100 Year GDP share (%) 1978 28 27 45 100 2007 10 70 20 100 Source: Brandt and Zhu (2010). Notes: Table 2 presents total factor productivity (TFP) growth rates of the aggregate economy, the agricultural sector, and the nonagricultural sector, with the nonagricultural sector divided into state and the nonstate sectors. See text for details on the categorization of firms and enterprises into sectors. Because the TFP growth rates reported in this table are based on China’s national accounts data that use domestic prices, they are different from the TFP growth rates reported in Table 1, which are calculated from the Penn World Table data that use international prices.
  • 10. 112 Journal of Economic Perspectives China’s census data, and the schooling year data of Barro and Lee (2010). In BrandtChina’s census data, and the schooling year data of Barro and Lee (2010). In Brandt and Zhu (2010), we offer details on the construction of the data series.and Zhu (2010), we offer details on the construction of the data series.44 Total factor productivity grew rapidly in both the agricultural and the nonstateTotal factor productivity grew rapidly in both the agricultural and the nonstate sectors. For the overall period from 1978 to 2007, the average annual growth ratessectors. For the overall period from 1978 to 2007, the average annual growth rates of total factor productivity in these two sectors is 4.01 and 3.91 percent, respectively.of total factor productivity in these two sectors is 4.01 and 3.91 percent, respectively. In contrast, the average growth rate of total factor productivity in the state sector isIn contrast, the average growth rate of total factor productivity in the state sector is only 1.68 percent per year. Prior to 1998, in particular, the state sector had very lowonly 1.68 percent per year. Prior to 1998, in particular, the state sector had very low productivity growth rates. After 1998, though, total factor productivity in the stateproductivity growth rates. After 1998, though, total factor productivity in the state sector grew rapidly, averaging 5.5 percent annually.sector grew rapidly, averaging 5.5 percent annually. The similarity of productivity growth rates in agriculture and in the nonstateThe similarity of productivity growth rates in agriculture and in the nonstate sector are associated with very different movements of these two sectors’ employ-sector are associated with very different movements of these two sectors’ employ- ment shares. As reported in Table 2, agriculture’s share of total employmentment shares. As reported in Table 2, agriculture’s share of total employment declined from 69 percent in 1978 to 26 percent in 2007. The high rate of produc-declined from 69 percent in 1978 to 26 percent in 2007. The high rate of produc- tivity growth in agriculture helped to push workers away from jobs in agriculture.tivity growth in agriculture helped to push workers away from jobs in agriculture. Conversely, the nonstate sector’s share of employment increased from 15 percent inConversely, the nonstate sector’s share of employment increased from 15 percent in 1978 to 62 percent by 2007. The extraordinary increase in the number of workers1978 to 62 percent by 2007. The extraordinary increase in the number of workers in this sector was not sufficient to drive down their productivity. Instead, the growthin this sector was not sufficient to drive down their productivity. Instead, the growth of the nonstate secotor represents the productivity benefits of a sectoral shift awayof the nonstate secotor represents the productivity benefits of a sectoral shift away from the agricultural sector to a sector of the economy that could absorb this laborfrom the agricultural sector to a sector of the economy that could absorb this labor and still generate rapid productivity growth.and still generate rapid productivity growth. The state sector’s share of total employment remained remarkably constant atThe state sector’s share of total employment remained remarkably constant at around 16–17 percent of the total labor force from 1978 until 1997. The restruc-around 16–17 percent of the total labor force from 1978 until 1997. The restruc- turing of state enterprises circa 1998 led both to a rise in the rate of productivityturing of state enterprises circa 1998 led both to a rise in the rate of productivity growth for this sector and also to a decline in its share of China’s labor to 12 percentgrowth for this sector and also to a decline in its share of China’s labor to 12 percent in 2001—a level where it has remained since.in 2001—a level where it has remained since. In the next section, I’ll discuss the transformation in agriculture in more depth.In the next section, I’ll discuss the transformation in agriculture in more depth. In the following section, I’ll delve more deeply into productivity growth for theIn the following section, I’ll delve more deeply into productivity growth for the nonstate and state producers in the nonagricultural sector.nonstate and state producers in the nonagricultural sector. Productivity Growth in Agriculture and Structural Transformation Since China had experienced recurring food crises before 1978, it is notSince China had experienced recurring food crises before 1978, it is not surprising that its economic reform started in the agricultural sector. Theresurprising that its economic reform started in the agricultural sector. There were two important reforms. First, the government increased prices for agricul-were two important reforms. First, the government increased prices for agricul- tural goods. Second, the previous “collective farming system” was shifted to thetural goods. Second, the previous “collective farming system” was shifted to the “household-responsibility system.” Under the new system, each farm household was“household-responsibility system.” Under the new system, each farm household was assigned a fixed quota of grains that the household had to sell to the government atassigned a fixed quota of grains that the household had to sell to the government at 4 Because the national accounts use domestic prices rather than international prices, these growth rates are not the same as the growth rates calculated from the Penn World Tables. However, the differences are small. For the entire period of 1978–2007, the annual growth rates of GDP per worker and total factor productivity calculated using the Penn World Tables are 7.55 and 3.16 percent, respectively. The corresponding growth rates calculated using China’s national accounts data are 7.58 and 3.61 percent.
  • 11. Xiaodong Zhu 113 official prices. However, any extra grain the household produced could be sold atofficial prices. However, any extra grain the household produced could be sold at market prices. The reforms were implemented gradually and completed in 1984.market prices. The reforms were implemented gradually and completed in 1984. Between 1978 and 1984, total factor productivity in the agricultural sector grewBetween 1978 and 1984, total factor productivity in the agricultural sector grew 5.62 percent per year. Several studies argue that most of the productivity growth5.62 percent per year. Several studies argue that most of the productivity growth during this period can be attributed to the price and institutional reforms thatduring this period can be attributed to the price and institutional reforms that generated strong positive incentive effects on farmers’ efforts and input choicesgenerated strong positive incentive effects on farmers’ efforts and input choices (for example, McMillan, Walley, and Zhu 1989; Lin 1992).(for example, McMillan, Walley, and Zhu 1989; Lin 1992). As a result of the productivity growth, China’s agricultural output increased byAs a result of the productivity growth, China’s agricultural output increased by 47 percent during this period. The increase in food availability alleviated China’s47 percent during this period. The increase in food availability alleviated China’s subsistence food constraint and started a structural transformation that reallocated asubsistence food constraint and started a structural transformation that reallocated a large amount of labor from agriculture to industry. From 1978 to 1984, agriculture’slarge amount of labor from agriculture to industry. From 1978 to 1984, agriculture’s share of total employment fell from 69 percent to 50 percent: that is, in just six years,share of total employment fell from 69 percent to 50 percent: that is, in just six years, 19 percent of China’s labor force—more than 49 million workers—reallocated out19 percent of China’s labor force—more than 49 million workers—reallocated out of the agricultural sector. Most of the 49 million reallocated workers did not moveof the agricultural sector. Most of the 49 million reallocated workers did not move to urban centers. Instead, they went to work in the rural industrial enterprises setto urban centers. Instead, they went to work in the rural industrial enterprises set up by township and village-level governments that are called “township and villageup by township and village-level governments that are called “township and village enterprises” (TVEs).enterprises” (TVEs). For the first few years, the price and institutional reforms increased agriculturalFor the first few years, the price and institutional reforms increased agricultural output mainly by improving incentives without much change in the production tech-output mainly by improving incentives without much change in the production tech- nologies being used. However, by about 1984 these static efficiency gains, from workersnologies being used. However, by about 1984 these static efficiency gains, from workers using the same technology with a much more rewarding set of incentives, were largelyusing the same technology with a much more rewarding set of incentives, were largely exhausted. Both agricultural productivity and structural transformation stagnated inexhausted. Both agricultural productivity and structural transformation stagnated in the second half of the 1980s. Starting around 1990, markets for agricultural inputs andthe second half of the 1980s. Starting around 1990, markets for agricultural inputs and outputs were gradually liberalized and government interventions were significantlyoutputs were gradually liberalized and government interventions were significantly reduced. Huang, Otsuka, and Rozelle (2008) document extensive market liberaliza-reduced. Huang, Otsuka, and Rozelle (2008) document extensive market liberaliza- tion in China’s agricultural sector and state: “aside from restrictions on land ownership,tion in China’s agricultural sector and state: “aside from restrictions on land ownership, China today may have one of the least distorted domestic agricultural economies in theChina today may have one of the least distorted domestic agricultural economies in the World.” As this market liberalization provided farmers with strong incentives to adoptWorld.” As this market liberalization provided farmers with strong incentives to adopt new technologies, the average annual growth rate of total factor productivity in agri-new technologies, the average annual growth rate of total factor productivity in agri- culture reached 5.10 percent between 1988 and 1998, and remained at 4.13 percentculture reached 5.10 percent between 1988 and 1998, and remained at 4.13 percent between 1998 and 2007. Most of agriculture’s growth in total factor productivity afterbetween 1998 and 2007. Most of agriculture’s growth in total factor productivity after 1990 came from technological progress ( Jin, Ma, Huang, Hu, and Rozelle 2010).1990 came from technological progress ( Jin, Ma, Huang, Hu, and Rozelle 2010). Structural transformation also resumed after 1990. By 2007, agriculture’s share of totalStructural transformation also resumed after 1990. By 2007, agriculture’s share of total employment had been reduced from 46 percent in 1991 to 26 percent in 2007.employment had been reduced from 46 percent in 1991 to 26 percent in 2007. How did productivity growth in agriculture contribute to the overall economicHow did productivity growth in agriculture contribute to the overall economic growth in China? Since T. W. Schultz (1953)’s pioneering work, economists havegrowth in China? Since T. W. Schultz (1953)’s pioneering work, economists have long emphasized the role of agriculture in economic development.long emphasized the role of agriculture in economic development.55 The standardThe standard argument is that productivity growth in agriculture not only contributes to aggregateargument is that productivity growth in agriculture not only contributes to aggregate productivity growth directly, but also indirectly through structural transformation.productivity growth directly, but also indirectly through structural transformation. When agricultural productivity increases, food demand can be met with a smallerWhen agricultural productivity increases, food demand can be met with a smaller 5 See, for example, Johnston and Mellor (1961), Jorgenson (1961), Schultz (1964), and Timmer (1988). See also Gollin, Parente, and Rogerson (2002), Restuccia, Yang, and Zhu (2008), and Yang and Zhu (2010) for some recent analyses.
  • 12. 114 Journal of Economic Perspectives number of workers in the agricultural sector than before. As a result, some workersnumber of workers in the agricultural sector than before. As a result, some workers can be reallocated to the nonagricultural sector. Because average labor productivity iscan be reallocated to the nonagricultural sector. Because average labor productivity is generally higher in the nonagricultural sector than in the agricultural sector, the real-generally higher in the nonagricultural sector than in the agricultural sector, the real- location of workers from agriculture contributes positively to aggregate productivitylocation of workers from agriculture contributes positively to aggregate productivity growth. Indeed, in 1978, the average labor productivity in China’s nonagriculturalgrowth. Indeed, in 1978, the average labor productivity in China’s nonagricultural sector was six times as high as in the agricultural sector, and therefore one wouldsector was six times as high as in the agricultural sector, and therefore one would expect a significant contribution from the labor reallocation. For this reason, Youngexpect a significant contribution from the labor reallocation. For this reason, Young (2003) suggests that the reforms in the agricultural sector may have been the most(2003) suggests that the reforms in the agricultural sector may have been the most important source of China’s growth during the first two decades of economic reform.important source of China’s growth during the first two decades of economic reform. In Brandt and Zhu (2010), my coauthor and I use a multisector model toIn Brandt and Zhu (2010), my coauthor and I use a multisector model to quantify this contribution during the period of 1978–2007. We find that, out ofquantify this contribution during the period of 1978–2007. We find that, out of the 43 percentage points of the reduction in agriculture’s share of employmentthe 43 percentage points of the reduction in agriculture’s share of employment between 1978 and 2007, total factor productivity growth in agriculture accountsbetween 1978 and 2007, total factor productivity growth in agriculture accounts for 39 percentage points or 91 percent of the total reduction. Taking both thefor 39 percentage points or 91 percent of the total reduction. Taking both the direct and indirect effects into account, we find that the contribution of total factordirect and indirect effects into account, we find that the contribution of total factor productivity growth in agriculture to aggregate productivity growth is 1.5 percentageproductivity growth in agriculture to aggregate productivity growth is 1.5 percentage points a year for the entire period of 1978 and 2007. However, we also find that thepoints a year for the entire period of 1978 and 2007. However, we also find that the role of agriculture’s productivity growth diminishes over time, from a contributionrole of agriculture’s productivity growth diminishes over time, from a contribution of 2.1 percentage points per year between 1978 and 1988, to a contribution of onlyof 2.1 percentage points per year between 1978 and 1988, to a contribution of only 0.6 percentage points per year for the period between 1998 and 2007. There are0.6 percentage points per year for the period between 1998 and 2007. There are two reasons for the decline. First, as the economy grew, agriculture’s share of value-two reasons for the decline. First, as the economy grew, agriculture’s share of value- added decreased, and therefore its direct contribution also diminished. Second, theadded decreased, and therefore its direct contribution also diminished. Second, the marginal contribution of reallocation is a decreasing function of the agriculturalmarginal contribution of reallocation is a decreasing function of the agricultural productivity level. After 20 years of productivity growth, the gain from reallocationproductivity level. After 20 years of productivity growth, the gain from reallocation naturally declined in the later years. As agriculture’s share of employment and value-naturally declined in the later years. As agriculture’s share of employment and value- added continue to decline, the contribution of productivity growth in agriculture toadded continue to decline, the contribution of productivity growth in agriculture to aggregate productivity growth will be even smaller in the future.aggregate productivity growth will be even smaller in the future. Growth outside Agriculture: A Tale of Two Sectors Before economic reform started in 1978, resource allocation was centrallyBefore economic reform started in 1978, resource allocation was centrally determined by the government’s plan rather than by the market. The state sectordetermined by the government’s plan rather than by the market. The state sector dominated nonagricultural activity, accounting for 80 percent of the total urbandominated nonagricultural activity, accounting for 80 percent of the total urban employment and more than three-quarters of industrial output. The nonstate sectoremployment and more than three-quarters of industrial output. The nonstate sector at that time mainly consisted of collective firms. Urban collectives were confinedat that time mainly consisted of collective firms. Urban collectives were confined to producing a small number of consumer goods and providing neighborhoodto producing a small number of consumer goods and providing neighborhood services. Rural collectives were only allowed to manufacture producer goods for theservices. Rural collectives were only allowed to manufacture producer goods for the agricultural sector.agricultural sector. 1978–1988: Rise of the Nonstate Sector In the early 1980s, encouraged by the success of the rural reforms, the ChineseIn the early 1980s, encouraged by the success of the rural reforms, the Chinese government started two market reforms in the nonagricultural sector. First, agovernment started two market reforms in the nonagricultural sector. First, a dual-track system was introduced. State-owned enterprises were still given quotasdual-track system was introduced. State-owned enterprises were still given quotas
  • 13. Understanding China’s Growth: Past, Present, and Future 115 on both production inputs and output that transacted at official prices, but theyon both production inputs and output that transacted at official prices, but they were also allowed to buy inputs and sell output beyond quotas at market prices.were also allowed to buy inputs and sell output beyond quotas at market prices. Moreover, the non-state-owned enterprises, including collectives (as we discussedMoreover, the non-state-owned enterprises, including collectives (as we discussed earlier), small-scale individual businesses, and foreign-invested firms in the specialearlier), small-scale individual businesses, and foreign-invested firms in the special economic zones, were allowed to enter previously forbidden industries, buying andeconomic zones, were allowed to enter previously forbidden industries, buying and selling their inputs and outputs at market prices. Second, the central governmentselling their inputs and outputs at market prices. Second, the central government also devolved economic decision-making powers to lower-level governments andalso devolved economic decision-making powers to lower-level governments and provided them with fiscal incentives. Starting in 1980, a “fiscal contracting system”provided them with fiscal incentives. Starting in 1980, a “fiscal contracting system” was implemented that effectively made local governments the “residual claimants”was implemented that effectively made local governments the “residual claimants” of the enterprises under their control (Qian 1999). As a result, provincial-, city-,of the enterprises under their control (Qian 1999). As a result, provincial-, city-, and county-level governments controlled most of the state-owned enterprises whileand county-level governments controlled most of the state-owned enterprises while the township- and village-level governments controlled the group of rural collectivethe township- and village-level governments controlled the group of rural collective enterprises that became known as the “township and village enterprises.”enterprises that became known as the “township and village enterprises.” Under these reforms, the township and village enterprises based on the old ruralUnder these reforms, the township and village enterprises based on the old rural collectives flourished and led the way to an expansion of the nonstate sector, whilecollectives flourished and led the way to an expansion of the nonstate sector, while the state-owned enterprises did not. The number of township and village enterprisesthe state-owned enterprises did not. The number of township and village enterprises increased from 1,520,000 in 1978 to 18,880,000 in 1988 (National Bureau of Statisticsincreased from 1,520,000 in 1978 to 18,880,000 in 1988 (National Bureau of Statistics of China 1999). The success of the agricultural reforms made available to these enter-of China 1999). The success of the agricultural reforms made available to these enter- prises a large number of local workers, and the dual-track system allowed them to gainprises a large number of local workers, and the dual-track system allowed them to gain access to capital and raw materials from the markets. Between 1978 and 1988, the shareaccess to capital and raw materials from the markets. Between 1978 and 1988, the share of total employment in nonstate enterprises increased from 15 percent to 39 percent.of total employment in nonstate enterprises increased from 15 percent to 39 percent. The expansion of employment in the nonstate sector was also accompanied by totalThe expansion of employment in the nonstate sector was also accompanied by total factor productivity growth averaging 5.87 percent a year during this period.factor productivity growth averaging 5.87 percent a year during this period. The reforms did less for state-owned enterprises. Local governments at countyThe reforms did less for state-owned enterprises. Local governments at county level and above sought to improve the economic performance of the state-ownedlevel and above sought to improve the economic performance of the state-owned enterprises under their control by implementing a “managerial responsibilityenterprises under their control by implementing a “managerial responsibility system” that linked managers and workers’ income to financial outcomes of thesystem” that linked managers and workers’ income to financial outcomes of the enterprises. The reforms did have some positive effect on productivity. Using aenterprises. The reforms did have some positive effect on productivity. Using a panel data set of 272 industrial state-owned enterprises collected by the Chinesepanel data set of 272 industrial state-owned enterprises collected by the Chinese Academy of Social Sciences, Li (1997) estimates that their total factor productivityAcademy of Social Sciences, Li (1997) estimates that their total factor productivity on average grew at 4.68 percent per year between 1980 and 1989, and that most ofon average grew at 4.68 percent per year between 1980 and 1989, and that most of the productivity growth could be attributed to stronger incentives, increased marketthe productivity growth could be attributed to stronger incentives, increased market competition, and better allocation of production inputs. Using the same data set,competition, and better allocation of production inputs. Using the same data set, Groves, Naughton, Hong, and McMillan (1994) also report positive incentive effectsGroves, Naughton, Hong, and McMillan (1994) also report positive incentive effects of the managerial responsibility system on productivity.of the managerial responsibility system on productivity. While enterprise reforms made industrial state-owned enterprises more effi-While enterprise reforms made industrial state-owned enterprises more effi- cient, their productivity growth was slower than that of the nonstate enterprisescient, their productivity growth was slower than that of the nonstate enterprises and not fast enough to offset the rising real cost of material inputs. Using moreand not fast enough to offset the rising real cost of material inputs. Using more aggregate data on industrial enterprises reported by China’s National Statisticalaggregate data on industrial enterprises reported by China’s National Statistical Bureau, Jefferson, Rawski, and Zheng (1996) estimate that between 1980 and 1988,Bureau, Jefferson, Rawski, and Zheng (1996) estimate that between 1980 and 1988, the average annual growth rate of total factor productivity was 2.96 percent forthe average annual growth rate of total factor productivity was 2.96 percent for state-owned enterprises and 3.66 percent for the nonstate collective enterprises.state-owned enterprises and 3.66 percent for the nonstate collective enterprises. However, these estimated rates of productivity growth are based on a productionHowever, these estimated rates of productivity growth are based on a production function that uses gross output rather than value-added. If the costs of real materialfunction that uses gross output rather than value-added. If the costs of real material
  • 14. 116 Journal of Economic Perspectives inputs are rising, using gross output rather than value-added may be misleading.inputs are rising, using gross output rather than value-added may be misleading.66 In the pre-reform period, prices of material inputs were kept artificially low, andIn the pre-reform period, prices of material inputs were kept artificially low, and so during the reform period, market prices of material inputs rose significantlyso during the reform period, market prices of material inputs rose significantly faster than output prices. Using the information reported in Jefferson, Rawski, andfaster than output prices. Using the information reported in Jefferson, Rawski, and Zheng, I calculated the growth of total factor productivity for the state and collectiveZheng, I calculated the growth of total factor productivity for the state and collective industrial enterprises between 1980 and 1988 using value-added, rather than grossindustrial enterprises between 1980 and 1988 using value-added, rather than gross output. By this metric, the state-owned firms had annual productivity growth ofoutput. By this metric, the state-owned firms had annual productivity growth of –1.33 percent, while the nonstate collective enterprises had a growth rate of positive–1.33 percent, while the nonstate collective enterprises had a growth rate of positive 3.11 percent per year. (There has been no comparable study for the specific state3.11 percent per year. (There has been no comparable study for the specific state and nonstate enterprises in services because data for such a study are not available.)and nonstate enterprises in services because data for such a study are not available.) In short, the basic lesson is that productivity growth of the nonagriculturalIn short, the basic lesson is that productivity growth of the nonagricultural sector during this period was mainly due to the rise of the nonstate sector. As Table 2sector during this period was mainly due to the rise of the nonstate sector. As Table 2 showed earlier for the 1978–1988 period, the state sector had an average annualshowed earlier for the 1978–1988 period, the state sector had an average annual growth rate of total factor productivity during this time of –0.36 percent, while thegrowth rate of total factor productivity during this time of –0.36 percent, while the nonstate sectors had annual productivity growth of 5.87 percent.nonstate sectors had annual productivity growth of 5.87 percent. 1988–1998: From Reform without Losers to Inevitable Tradeoffs The drastic difference in economic performances between the township andThe drastic difference in economic performances between the township and village enterprises and the state-owned enterprises may seem implausible; after all,village enterprises and the state-owned enterprises may seem implausible; after all, both are enterprises under the control of local governments, albeit at different levels.both are enterprises under the control of local governments, albeit at different levels. One reason for the difference is that state-owned enterprises remained under theOne reason for the difference is that state-owned enterprises remained under the constraints of government planning for a longer time, unable to sell their productsconstraints of government planning for a longer time, unable to sell their products at market prices, although these restrictions diminished over time (Naughton 1995).at market prices, although these restrictions diminished over time (Naughton 1995). But the more important difference is the commitment made by the centralBut the more important difference is the commitment made by the central government to support employment in the state sector. Remember that employmentgovernment to support employment in the state sector. Remember that employment in the state-owned sector remained essentially constant at about 16 percent of thein the state-owned sector remained essentially constant at about 16 percent of the workforce from 1978 up through 1997. This stability reflected the central govern-workforce from 1978 up through 1997. This stability reflected the central govern- ment strategy of letting the nonstate sector grow without downsizing the state sector.ment strategy of letting the nonstate sector grow without downsizing the state sector. The strategy had the political benefit of minimizing social instability and reducingThe strategy had the political benefit of minimizing social instability and reducing resistance to reform. Lau, Qian, and Roland (2000) call it “reform without losers.”resistance to reform. Lau, Qian, and Roland (2000) call it “reform without losers.” To avoid laying off workers or shutting down factories, the government usually askedTo avoid laying off workers or shutting down factories, the government usually asked the state-owned banks to bail out loss-making state-owned enterprises. The possibilitythe state-owned banks to bail out loss-making state-owned enterprises. The possibility of bailout created a “soft budget constraint,” to use a term common in the literatureof bailout created a “soft budget constraint,” to use a term common in the literature on centrally planned economies, that further reduced the economic incentives ofon centrally planned economies, that further reduced the economic incentives of the state-owned enterprises (Kornai 1980; Qian and Roland 1998; Brandt and Zhuthe state-owned enterprises (Kornai 1980; Qian and Roland 1998; Brandt and Zhu 2001). The lack of exit also eliminated market selection as an important mecha-2001). The lack of exit also eliminated market selection as an important mecha- nism for improving aggregate productivity in the state sector. In contrast, the centralnism for improving aggregate productivity in the state sector. In contrast, the central government had no commitment to support employment in the township and villagegovernment had no commitment to support employment in the township and village enterprises. While the local governments that ran the township and village enter-enterprises. While the local governments that ran the township and village enter- prises did have political incentives to minimize unemployment and maintain socialprises did have political incentives to minimize unemployment and maintain social stability in their communities, these local governments had only weak influence onstability in their communities, these local governments had only weak influence on 6 Specifically, let sm be the share of material inputs in gross output, then Δln(TFPvalue-added) = [Δln(TFPgross output) – sm Δln(real material input cost)]/(1 – sm).
  • 15. Xiaodong Zhu 117 banks. For example, millions of township and village enterprises went bankrupt whenbanks. For example, millions of township and village enterprises went bankrupt when there was a general tightening of credit in 1989 (Qian and Xu 1993). Thus, townshipthere was a general tightening of credit in 1989 (Qian and Xu 1993). Thus, township and village enterprises faced a much tighter budget constraint and stronger marketand village enterprises faced a much tighter budget constraint and stronger market discipline than did the state-owned enterprises.discipline than did the state-owned enterprises. Unsurprisingly, at least to economists, a “reform without losers” strategy stillUnsurprisingly, at least to economists, a “reform without losers” strategy still poses tradeoffs. In the absence of hard budget constraints and market discipline,poses tradeoffs. In the absence of hard budget constraints and market discipline, the state-owned enterprises continued to be outperformed by the nonstate sector.the state-owned enterprises continued to be outperformed by the nonstate sector. Between 1988 and 1998, the average annual growth rate of total factor productivityBetween 1988 and 1998, the average annual growth rate of total factor productivity in the state sector was only 0.27 percent, while the comparable growth rate of thein the state sector was only 0.27 percent, while the comparable growth rate of the nonstate sector was 2.17 percent (as shown earlier in Table 2). Faced with increasingnonstate sector was 2.17 percent (as shown earlier in Table 2). Faced with increasing competition from the more efficient nonstate firms and without significant produc-competition from the more efficient nonstate firms and without significant produc- tivity growth, the financial condition of the state-owned firms deteriorated. Thetivity growth, the financial condition of the state-owned firms deteriorated. The resources needed to support the state-owned enterprises increased steadily betweenresources needed to support the state-owned enterprises increased steadily between 1986 and 1993. Nonperforming loans in the state banking system increased rapidly,1986 and 1993. Nonperforming loans in the state banking system increased rapidly, and the creation of money to make these loans was leading to chronic high inflationand the creation of money to make these loans was leading to chronic high inflation (Brandt and Zhu 2000).(Brandt and Zhu 2000). By 1994, it had become clear that the strategy of “reform without losers” couldBy 1994, it had become clear that the strategy of “reform without losers” could no longer be sustained. In 1995, the Chinese government reduced its commitment tono longer be sustained. In 1995, the Chinese government reduced its commitment to stable employment in the state sector. Many small-scale state-owned enterprises werestable employment in the state sector. Many small-scale state-owned enterprises were allowed to go bankrupt or be privatized through management buyouts. Betweenallowed to go bankrupt or be privatized through management buyouts. Between 1995 and 2001, the state sector’s share of total employment declined from 17 percent1995 and 2001, the state sector’s share of total employment declined from 17 percent to 12 percent.to 12 percent.77 More diversified ownership forms were also introduced within theMore diversified ownership forms were also introduced within the state sector. Some of the large-scale state-owned enterprises were converted intostate sector. Some of the large-scale state-owned enterprises were converted into shareholding companies, with a majority of shares controlled by the state.shareholding companies, with a majority of shares controlled by the state. 1998–2007: Privatization and Trade Liberalization The 15th Congress of the Chinese Communist Party held in 1997 was a mile-The 15th Congress of the Chinese Communist Party held in 1997 was a mile- stone in China’s economic policies. The Congress formally sanctioned ownershipstone in China’s economic policies. The Congress formally sanctioned ownership reforms of the state-owned firms and also legalized the development of privatereforms of the state-owned firms and also legalized the development of private enterprises. With the reduction of legal barriers, private enterprises grew rapidly.enterprises. With the reduction of legal barriers, private enterprises grew rapidly. Collective enterprises such as township and village enterprises lost their edge, someCollective enterprises such as township and village enterprises lost their edge, some were closed and many of them were privatized, also in the form of managementwere closed and many of them were privatized, also in the form of management buyouts. As part of the lead-up to China’s joining the World Trade Organization inbuyouts. As part of the lead-up to China’s joining the World Trade Organization in 2001, China’s government also started to cut tariffs, broadened trade rights, and2001, China’s government also started to cut tariffs, broadened trade rights, and liberalized its regime for foreign direct investment (Branstetter and Lardy 2008).liberalized its regime for foreign direct investment (Branstetter and Lardy 2008). Between 1998 and 2007, the share of total urban employment in domestic privateBetween 1998 and 2007, the share of total urban employment in domestic private enterprises and foreign-invested enterprises increased from 8 to 24 percent. Theenterprises and foreign-invested enterprises increased from 8 to 24 percent. The increase in the manufacturing sector was even more pronounced. By 2007, domesticincrease in the manufacturing sector was even more pronounced. By 2007, domestic private enterprises alone accounted for 51 percent of total urban employment inprivate enterprises alone accounted for 51 percent of total urban employment in the manufacturing sector (National Bureau of Statistics of China, 2008, tables 4–2,the manufacturing sector (National Bureau of Statistics of China, 2008, tables 4–2, 7 China’s official employment statistics did not record a reduction in the employment of state-owned enterprises until 1998. The state-owned sector actually started to downsize and lay off workers a few years earlier in 1995.
  • 16. 118 Journal of Economic Perspectives 4–6, 4–13). Song, Storesletten, and Ziliboti (2011) present a model that describes4–6, 4–13). Song, Storesletten, and Ziliboti (2011) present a model that describes the transformation during this period.the transformation during this period. The combination of privatization and trade liberalization had strong effects onThe combination of privatization and trade liberalization had strong effects on productivity growth in both the state and nonstate sectors. Between 1998 and 2007,productivity growth in both the state and nonstate sectors. Between 1998 and 2007, the average annual total factor productivity growth rates of the state and nonstatethe average annual total factor productivity growth rates of the state and nonstate sectors were 5.50 percent and 3.67 percent, respectively (as shown in Table 2).sectors were 5.50 percent and 3.67 percent, respectively (as shown in Table 2). After stagnating for much of the first two decades of reform, the state sector finallyAfter stagnating for much of the first two decades of reform, the state sector finally experienced productivity growth in the last decade.experienced productivity growth in the last decade. In the manufacturing sector, productivity growth during this period isIn the manufacturing sector, productivity growth during this period is even higher. Using data of the China Annual Survey of Industries,even higher. Using data of the China Annual Survey of Industries,88 Brandt, VanBrandt, Van Biesebroeck, and Zhang (2012) estimate that, for the manufacturing sector, theBiesebroeck, and Zhang (2012) estimate that, for the manufacturing sector, the total factor productivity growth rate is 13.4 percent a year. Because even state-ownedtotal factor productivity growth rate is 13.4 percent a year. Because even state-owned enterprises were allowed to go bankrupt and exit during this period, reallocationenterprises were allowed to go bankrupt and exit during this period, reallocation through the process of entry and exit contributed significantly to productivitythrough the process of entry and exit contributed significantly to productivity growth, accounting for 72 percent of the aggregate growth of total factor produc-growth, accounting for 72 percent of the aggregate growth of total factor produc- tivity in the manufacturing sector. Jefferson, Rawski, and Zhang (2008) report similartivity in the manufacturing sector. Jefferson, Rawski, and Zhang (2008) report similar results. Using the same data, Hsieh and Klenow (2009) examine the contributionresults. Using the same data, Hsieh and Klenow (2009) examine the contribution of capital and labor reallocation among existing firms to the aggregate total factorof capital and labor reallocation among existing firms to the aggregate total factor productivity growth in the manufacturing sector. They find that between 1998 andproductivity growth in the manufacturing sector. They find that between 1998 and 2005, a more efficient allocation within four-digit-level manufacturing industries2005, a more efficient allocation within four-digit-level manufacturing industries contributed 2 percentage points per year to aggregate total factor productivitycontributed 2 percentage points per year to aggregate total factor productivity growth in the manufacturing sector, with a significant portion of it coming fromgrowth in the manufacturing sector, with a significant portion of it coming from the reallocation from state-owned to nonstate enterprises. In short, privatizationthe reallocation from state-owned to nonstate enterprises. In short, privatization and trade liberalization reduced barriers to entry and exit, and increased competi-and trade liberalization reduced barriers to entry and exit, and increased competi- tion, which in turn led to rapid productivity growth in the manufacturing sector bytion, which in turn led to rapid productivity growth in the manufacturing sector by raising within-firm productivity and through reallocation along both the extensiveraising within-firm productivity and through reallocation along both the extensive and intensive margins.and intensive margins. However, China’s nontradable sectors—primarily construction and services—However, China’s nontradable sectors—primarily construction and services— have faced much less international competition. There have also been significanthave faced much less international competition. There have also been significant barriers to entry of private and foreign-invested firms into service industries, andbarriers to entry of private and foreign-invested firms into service industries, and significant barriers to exit of state-owned enterprises in services. In 2007, the statesignificant barriers to exit of state-owned enterprises in services. In 2007, the state sector still accounted for 77 percent of total urban employment in services, insector still accounted for 77 percent of total urban employment in services, in contrast to 15 percent in manufacturing. It is perhaps not surprising, then, thatcontrast to 15 percent in manufacturing. It is perhaps not surprising, then, that researchers have found that productivity growth in the nontradable sector laggedresearchers have found that productivity growth in the nontradable sector lagged behind growth in the tradable sector (for example, He, Zhang, Han, and Wu 2012).behind growth in the tradable sector (for example, He, Zhang, Han, and Wu 2012). Sources of Aggregate Productivity Growth in China: A Summary From 1978 to 2007, China’s annual growth rate of total factor productivity wasFrom 1978 to 2007, China’s annual growth rate of total factor productivity was 3.61percentperyear.Wecansummarizethesourcesofaggregateproductivitygrowth3.61percentperyear.Wecansummarizethesourcesofaggregateproductivitygrowth in China during the reform period as follows. In the agricultural sector, productivityin China during the reform period as follows. In the agricultural sector, productivity 8 This firm-level survey has been conducted annually by China’s National Bureau of Statistics. It covers all Chinese industrial firms (manufacturing, mining, and construction) with sales over 5 million renminbi yuan.
  • 17. Understanding China’s Growth: Past, Present, and Future 119 growth contributed 1.5 percentage points a year to aggregate productivity growthgrowth contributed 1.5 percentage points a year to aggregate productivity growth over the 1978–2007 period, both directly and indirectly through structural transfor-over the 1978–2007 period, both directly and indirectly through structural transfor- mation. However, this source of growth diminished over time as agriculture’s sharemation. However, this source of growth diminished over time as agriculture’s share of GDP diminished, and its contribution to China’s future growth will be small. Inof GDP diminished, and its contribution to China’s future growth will be small. In the nonstate sector, productivity growth contributed 2.27 percentage points per yearthe nonstate sector, productivity growth contributed 2.27 percentage points per year to aggregate productivity growth over the 1978–2007 period.to aggregate productivity growth over the 1978–2007 period.99 This source of growthThis source of growth will continue to drive China’s future growth as the nonstate sector’s share of totalwill continue to drive China’s future growth as the nonstate sector’s share of total nonagricultural employment has risen from 48 percent in 1978 to 84 percent innonagricultural employment has risen from 48 percent in 1978 to 84 percent in 2007 (more than 60 percent of total employment). Productivity stagnated in the2007 (more than 60 percent of total employment). Productivity stagnated in the state sector until the late 1990s, and for the 1978–2007 period as a whole thisstate sector until the late 1990s, and for the 1978–2007 period as a whole this sector contributed essentially zero to aggregate growth in total factor productivity.sector contributed essentially zero to aggregate growth in total factor productivity. However, since 1998, the state sector also experienced rapid productivity growth asHowever, since 1998, the state sector also experienced rapid productivity growth as a result of restructuring.a result of restructuring. The proximate sources of productivity growth have shifted over time. ForThe proximate sources of productivity growth have shifted over time. For example, productivity growth in agriculture under the dual-track system led the wayexample, productivity growth in agriculture under the dual-track system led the way from 1978 up to about 1984; starting in the mid-1980s, the nonstate sector in thefrom 1978 up to about 1984; starting in the mid-1980s, the nonstate sector in the form of township and village enterprises under its own dual-track system led the wayform of township and village enterprises under its own dual-track system led the way through much of the 1980s and 1990s; and from the late 1990s and into the 2000s,through much of the 1980s and 1990s; and from the late 1990s and into the 2000s, the nonstate sector in the form of privately-owned firms and a restructured state-the nonstate sector in the form of privately-owned firms and a restructured state- owned sector led the way in an economic climate much friendlier to the privateowned sector led the way in an economic climate much friendlier to the private sector and with lots of entry, exit, and competitive pressures. Whenever the effectsector and with lots of entry, exit, and competitive pressures. Whenever the effect of one set of reforms on productivity seemed to be exhausted, the Chinese govern-of one set of reforms on productivity seemed to be exhausted, the Chinese govern- ment found a way to initiate new reforms that reignite growth.ment found a way to initiate new reforms that reignite growth. The Future of China’s Economic Growth Experiences from other economies, especially the East Asian economies such asExperiences from other economies, especially the East Asian economies such as Japan, Korea, and Taiwan, suggest that periods of extremely rapid growth eventuallyJapan, Korea, and Taiwan, suggest that periods of extremely rapid growth eventually slow down and China’s more than 8 percent a year per capita GDP growth rate will notslow down and China’s more than 8 percent a year per capita GDP growth rate will not last. China’s per capita GDP is now around 20 percent of the U.S. level. Will China’slast. China’s per capita GDP is now around 20 percent of the U.S. level. Will China’s per capita GDP level out at 40 percent of the U.S. level, or 80 percent, or 120 percent?per capita GDP level out at 40 percent of the U.S. level, or 80 percent, or 120 percent? Of course, any answer to this question will contain a large dose of speculation. ButOf course, any answer to this question will contain a large dose of speculation. But I will attempt to address this question by discussing what would be the key sourcesI will attempt to address this question by discussing what would be the key sources of China’s growth in the future based on what we know about the sources of China’sof China’s growth in the future based on what we know about the sources of China’s growth in the last three decades.growth in the last three decades. Following the earlier decomposition of the sources of economic growth, weFollowing the earlier decomposition of the sources of economic growth, we can decompose China’s GDP per capita relative to that of the United States intocan decompose China’s GDP per capita relative to that of the United States into 9 In Brandt and Zhu (2010), we estimate that, if there were no total factor productivity growth in the nonstate sector, the producutvitiy growth rate for the nonagricultural sector would have been close to zero for the entire period between 1978 and 2007 and during each of the three sub-periods. I should also note that productivity growth in different sectors may interact so that one cannot infer the contribution of productivity growth in the state sector by simply substracting the contributions of agriculture and nonstate sector from the aggregate productivity growth.
  • 18. 120 Journal of Economic Perspectives four ingredients: relative labor participation rate, relative average human capital,four ingredients: relative labor participation rate, relative average human capital, relative capital/output ratio, and relative total factor productivity.relative capital/output ratio, and relative total factor productivity.1010 Figure 3 plotsFigure 3 plots these ratios for the period between 1978 and 2007. China’s labor force participa-these ratios for the period between 1978 and 2007. China’s labor force participa- tion and capital/output ratios are above U.S. levels, while China’s relative leveltion and capital/output ratios are above U.S. levels, while China’s relative level of human capital has risen somewhat over time (notice that Figure 3 is on a logof human capital has risen somewhat over time (notice that Figure 3 is on a log scale). But clearly, the growth of China’s relative GDP per capita is mainly drivenscale). But clearly, the growth of China’s relative GDP per capita is mainly driven by the growth of China’s relative total factor productivity. To answer the questionby the growth of China’s relative total factor productivity. To answer the question about China’s future growth, then, one has to assess the future of China’s relativeabout China’s future growth, then, one has to assess the future of China’s relative productivity growth.productivity growth. Although economic reforms have been crucial in generating productivityAlthough economic reforms have been crucial in generating productivity growth in China over the last three decades, many other economies in Easterngrowth in China over the last three decades, many other economies in Eastern Europe and Latin America also had economic reforms, but their growth perfor-Europe and Latin America also had economic reforms, but their growth perfor- mances are nowhere near the performance achieved by China. What is specialmances are nowhere near the performance achieved by China. What is special about China? One potential explanation is simply China’s backwardness at the startabout China? One potential explanation is simply China’s backwardness at the start of economic reform in 1978, which increased China’s potential for catch-up growth.of economic reform in 1978, which increased China’s potential for catch-up growth. 10 To be precise, the last two ratios should be the relative capital/output ratio raised to the power of α/(1 – α), and relative total factor productivity raised to the power of 1/(1 – α). For simplicity, however, I will simply refer them as “relative capital/output ratio” and “relative total factor productivity.” Figure 3 China Relative to the Uniteed States 0.010 0.100 1.000 10.000 2007 1986 2004 1988 2002 1990 2000 1992 1998 1994 2006 1978 1984 1980 1982 1996 Labor force participation rate Capital/Output ratio Average human capital TFP GDP per capita Note: “TFP” is total factor productivity.