State of Win Loss 2017 Infographic
•
1 like•929 views

Primary Intelligence published key findings from our annual State of Win Loss report, including Win Loss program benefits, Win Loss data collection tools, annual spending on Win Loss initiatives, and comparisons with 2015 Win Loss findings. The following infographic highlights some of the most compelling findings from our 2017 State of Win Loss research. https://www.primary-intel.com/industry-insights/state-win-loss-2017-report/
Recommended

Recommended
More Related Content
Recently uploaded
Recently uploaded (20)
Featured
Featured (20)
State of Win Loss 2017 Infographic
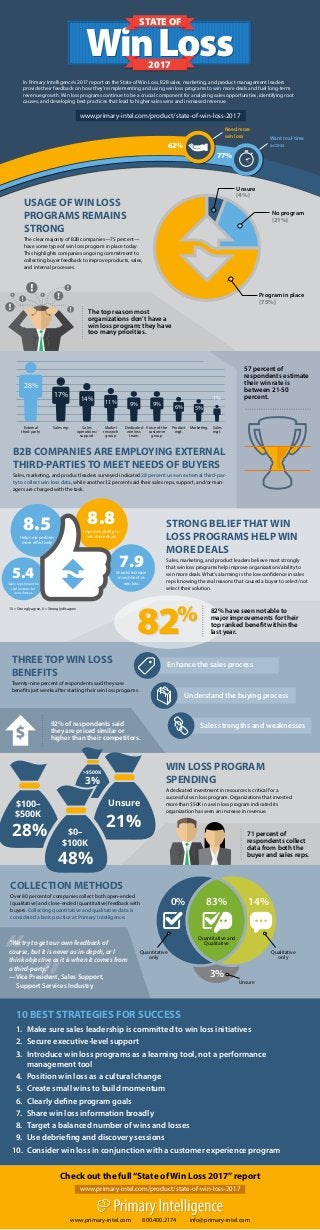
- 1. 1. Make sure sales leadership is committed to win loss initiatives 2. Secure executive-level support 3. Introduce win loss programs as a learning tool, not a performance management tool 4. Position win loss as a cultural change 5. Create small wins to build momentum 6. Clearly define program goals 7. Share win loss information broadly 8. Target a balanced number of wins and losses 9. Use debriefing and discovery sessions 10. Consider win loss in conjunction with a customer experience program www.primary-intel.com 800.400.2174 info@primary-intel.com In Primary Intelligence’s 2017 report on the State of Win Loss, B2B sales, marketing, and product management leaders provide their feedback on how they’re implementing and using win loss programs to win more deals and fuel long-term revenue growth. Win loss programs continue to be a crucial component for analyzing sales opportunities, identifying root causes, and developing best practices that lead to higher sales wins and increased revenue. www.primary-intel.com/product/state-of-win-loss-2017 62% 77% Need more win loss Want real-time access WinLossWinLoss STATE OF 2017 Check out the full“State of Win Loss 2017”report www.primary-intel.com/product/state-of-win-loss-2017 USAGE OF WIN LOSS PROGRAMS REMAINS STRONG The clear majority of B2B companies—75 percent— have some type of win loss program in place today. This highlights companies ongoing commitment to collecting buyer feedback to improve products, sales, and internal processes. Program in place (75%) Unsure (4%) No program (21%) The top reason most organizations don’t have a win loss program: they have too many priorities. 57 percent of respondents estimate their win rate is between 21-50 percent. B2B COMPANIES ARE EMPLOYING EXTERNAL THIRD-PARTIES TO MEET NEEDS OF BUYERS Sales, marketing, and product leaders surveyed indicated 28 percent use an external third-par- ty to collect win loss data, while another 32 percent said their sales reps, support, and/or man- agers are charged with the task. 28% 17% 14% 11% 9% 9% 6% 5% 1% External third party Sales rep Sales operations/ support Market research group Dedicated win loss team Voice of the customer group Product mgt. Marketing Sales mgt. 8.8Improves ability to win more deals 8.5Helps me perform more effectively 5.4Sales reps know the real reasons for wins/losses 7.9Should increase investment in win loss STRONG BELIEF THAT WIN LOSS PROGRAMS HELP WIN MORE DEALS Sales, marketing, and product leaders believe most strongly that win loss programs help improve organizations’ability to win more deals. What’s alarming is the low confidence in sales reps knowing the real reasons that caused a buyer to select/not select their solution. 82% have seen notable to major improvements for their top ranked benefit within the last year. 10 = Strongly agree, 0 = Strongly disagree 82% 82% THREE TOP WIN LOSS BENEFITS Twenty-nine percent of respondents said they saw benefits just weeks after starting their win loss programs. Enhance the sales process Understand the buying process Sales strengths and weaknesses92% of respondents said they are priced similar or higher than their competitors. >$500K 3% $100– $500K 28% $0– $100K 48% WIN LOSS PROGRAM SPENDING A dedicated investment in resources is critical for a successful win loss program. Organizations that invested more than $50K in a win loss program indicated its organization has seen an increase in revenue. Unsure 21% 71 percent of respondents collect data from both the buyer and sales reps. “ ” COLLECTION METHODS Over 80 percent of companies collect both open-ended (qualitative) and close-ended (quantitative) feedback with buyers. Collecting quantitative and qualitative data is considered a best practice at Primary Intelligence. “We try to get our own feedback of course, but it is never as in-depth, or I think objective as it is when it comes from a third-party.” —Vice President, Sales Support, Support Services Industry 83%0% 3% 14% Qualitative only Quantitative only Unsure Quantitative and Qualitative 10 BEST STRATEGIES FOR SUCCESS