Share Buybacks
•
1 like•32 views

Stock repurchase programs analyzed over the last 21 quarters. Data included for as many US firms as possible. Result set is greater than the S&P500 or the Russell 1000.

Recommended
Recommended
More Related Content
What's hot
What's hot (19)
Similar to Share Buybacks
Similar to Share Buybacks (20)
Recently uploaded
Recently uploaded (20)
Share Buybacks
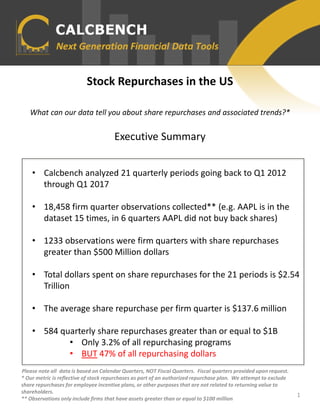
- 1. Stock Repurchases in the US What can our data tell you about share repurchases and associated trends?* Executive Summary Please note all data is based on Calendar Quarters, NOT Fiscal Quarters. Fiscal quarters provided upon request. * Our metric is reflective of stock repurchases as part of an authorized repurchase plan. We attempt to exclude share repurchases for employee incentive plans, or other purposes that are not related to returning value to shareholders. ** Observations only include firms that have assets greater than or equal to $100 million 1 • Calcbench analyzed 21 quarterly periods going back to Q1 2012 through Q1 2017 • 18,458 firm quarter observations collected** (e.g. AAPL is in the dataset 15 times, in 6 quarters AAPL did not buy back shares) • 1233 observations were firm quarters with share repurchases greater than $500 Million dollars • Total dollars spent on share repurchases for the 21 periods is $2.54 Trillion • The average share repurchase per firm quarter is $137.6 million • 584 quarterly share repurchases greater than or equal to $1B • Only 3.2% of all repurchasing programs • BUT 47% of all repurchasing dollars
- 2. Please note all data is based on Calendar Quarters, NOT Fiscal Quarters. Fiscal quarters provided upon request. **Our metric is reflective of stock repurchases as part of an authorized repurchase plan. We attempt to exclude share repurchases for employee incentive plans, or other purposes that are not related to returning value to shareholders. 2 Dollars Spent on Share Repurchases By Quarter (in USD Billions) 0 200 400 600 800 1000 1200 $- $40.00 $80.00 $120.00 $160.00 $200.00 FirmCount DollarsSpent($B) Dollars Spent on Share Repurchase ($ Billion) Firm Count
- 3. 3 Please note all data is based on Calendar Quarters, NOT Fiscal Quarters. Fiscal quarters provided upon request. **Our metric is reflective of stock repurchases as part of an authorized repurchase plan. We attempt to exclude share repurchases for employee incentive plans, or other purposes that are not related to returning value to shareholders. The table below represents the biggest buyers of their own stock over the last 21 quarters. Firm Level Share Repurchases *Avg. Daily Repurchase based on 63 day quarters 0.0% 5.0% 10.0% 15.0% 20.0% 25.0% 30.0% 35.0% 40.0% 45.0% 2012 Q1 2012 Q2 2012 Q3 2012 Q4 2013 Q1 2013 Q2 2013 Q3 2013 Q4 2014 Q1 2014 Q2 2014 Q3 2014 Q4 2015 Q1 2015 Q2 2015 Q3 2015 Q4 2016 Q1 2016 Q2 2016 Q3 2016 Q4 2017 Q1 Percent of Top 10 Firm Repurchases of Total Dollars Repurchased (Billions) Avg. Daily Repurchase (Millions) Apple Inc 141.98$ 107.31$ Exxon Mobil Corp 55.88$ 42.24$ International Business Machines Corp 48.82$ 36.90$ Microsoft Corp 47.54$ 35.93$ Oracle Corp 46.49$ 35.14$ Motorola Solutions, Inc. 46.29$ 34.99$ American International Group Inc 44.24$ 33.44$ Wells Fargo & Company/MN 37.68$ 28.48$ Walt Disney Co/ 29.92$ 22.62$ Wal Mart Stores Inc 29.88$ 22.58$ Jpmorgan Chase & Co 29.82$ 22.54$ At&T Inc. 29.24$ 22.10$ Goldman Sachs Group Inc 28.05$ 21.20$ Federal Home Loan Bank of Atlanta 25.79$ 19.49$ Merck & Co., Inc. 25.45$ 19.24$
- 4. 4 Please note all data is based on Calendar Quarters, NOT Fiscal Quarters. Fiscal quarters provided upon request. **Our metric is reflective of stock repurchases as part of an authorized repurchase plan. We attempt to exclude share repurchases for employee incentive plans, or other purposes that are not related to returning value to shareholders. Share Repurchase Yields Top 10 Firms by Quarter A share repurchase yield is the total dollars bought back divided by the market capitalization of the firm. 0 2 4 6 8 10 12 0% 5% 10% 15% 20% 25% 2016_Q1 2016_Q2 2016_Q3 2016_Q4 2017_Q1 Smallest in the top 10 (Still big though) Biggest Repurchases
- 5. 5 Share Repurchase Yields For Top 10 Firms 0% 5% 10% 15% 20% 25% 2016 First Quarter 0% 5% 10% 15% 20% 25% 2016 Second Quarter 0% 5% 10% 15% 20% 25% 2016 Third Quarter 0% 5% 10% 15% 20% 25% 2016 Fourth Quarter 0% 5% 10% 15% 20% 25% 2017 First Quarter * Windsorized at 20%
- 6. About the Author CALCBENCH PREMIUM SUITE 6 Please note all data is based on Calendar Quarters, NOT Fiscal Quarters. Fiscal quarters provided upon request. Pranav Ghai CEO & CO-FOUNDER Pranav is an analytics professional whose career has been based in financial services, with time spent at Morgan Stanley and ITG. He is also a new addition to the board of directors at XBRL-US. Pranav graduated with a BS from Bates College and an MS in Applied Mathematics from the Courant Institute at New York University. Danielle Cohen Intern Danielle is a student at Bates College, scheduled to graduate in 2019, and matriculated from the Ethical Culture Fieldston School in New York City. She works as the Economics department research assistant, is a manager of The Ronj coffee shop on campus and actively participates in the Investment Club. FullSizeRender.jpg 1 MB
- 7. Try Calcbench Today! ABOUT THIS REPORT: This report was created using data analyzed via Calcbench’s Premium Suite, an online interactive platform that helps finance leaders access and analyze financial data thoroughly and efficiently. Our accessible and intuitive platform can aid in better understanding competitor financials, identifying potential risk areas, analyzing trends across industry sectors, or conducting more effective due diligence. Sign up for a 2 week free trial at www.calcbench.com/trial or contact us at us@calcbench.com or via www.calcbench.com CALCBENCH PREMIUM SUITE 7