Cheminformatics and the Structure Elucidation of Natural Products
OscarResearchProject2015
1. Setup & Data acquisitionSetup & Data acquisition
A typical automated LIBS experimental setup is shown inA typical automated LIBS experimental setup is shown in
(Figure2).(Figure2). It consists of a CPA-Series Ti-Sapphire ultrashortIt consists of a CPA-Series Ti-Sapphire ultrashort
laser (Clark-MXR, Inc., Model: 2210) generating 140 fs longlaser (Clark-MXR, Inc., Model: 2210) generating 140 fs long
laser pulses with an energy of 1.5 mJ per pulse at 775 nm.laser pulses with an energy of 1.5 mJ per pulse at 775 nm.
The laser beam was focused onto the sample surface by a 50The laser beam was focused onto the sample surface by a 50
mm focal length fused silica Bi-Convex lens to create amm focal length fused silica Bi-Convex lens to create a
micro-plasma. For a full description of the Setup, see Y.micro-plasma. For a full description of the Setup, see Y.
MarkushinMarkushin et al.et al.
Experimentation on the use of PCA analysis for the detection of
pesticides has been carried out. Data reveals that the Unknown is
able to be identified using PCA analysis. Data also reveals that the
optimal technique for slide preparation is to wipe slides, rather
than wash or disinfect them, as residue from outside elements
may interfere with analysis. Further experimentation may involve
the identification of a single pesticide among multiple others. As
this may lead to the identification of specific, harmful pesticides
among groups of non-harmful ones.
We acknowledge the Optical Science Center for Applied Research (OSCAR),
the financial support of The National Science Foundation (NSF-CREST grant No
1242067 and of the National Aeronautics and Space Administration (NASA
URC 5 grant No
NNX09AU90A).
INTRODUCTION
CONCLUSION
ACKNOWLEDGEMENTS
RESULTS
MATERIALS & METHODS
The presence of pesticides within food sources have been shown toThe presence of pesticides within food sources have been shown to
negatively affect one’s health, according to Consumer Reports. Wenegatively affect one’s health, according to Consumer Reports. We
clean our vegetables before we eat them, but the pesticides may stillclean our vegetables before we eat them, but the pesticides may still
exist in trace amounts on the food product. Before one can decideexist in trace amounts on the food product. Before one can decide
to remove the pesticide, one must first identify whether it is there toto remove the pesticide, one must first identify whether it is there to
begin with. To determine this, we ablated 29 different samplesbegin with. To determine this, we ablated 29 different samples
including five samples each of 4,4-DDT, Dieldrin, Chlorpyrifos,including five samples each of 4,4-DDT, Dieldrin, Chlorpyrifos,
Tetrachlorvinfos, a mix of all of these chemicals, and one unknownTetrachlorvinfos, a mix of all of these chemicals, and one unknown
with 140fs Ti:Sapphire ultrashot laser pulses, and implementedwith 140fs Ti:Sapphire ultrashot laser pulses, and implemented
Principal Component Analysis (PCA) to find the optimal procedurePrincipal Component Analysis (PCA) to find the optimal procedure
for the identification of pesticides.for the identification of pesticides.
First, the data gathered from the plasma emissions were examined and sorted
through using Microsoft Powerpoint. After that, the PCA was done using the
software application Unscrambler X. Multiple plots were created using this
software as well.
The Utilization of Laser-Induced Breakdown Spectroscopy andThe Utilization of Laser-Induced Breakdown Spectroscopy and
Principal Component Analysis for the Detection of PesticidesPrincipal Component Analysis for the Detection of Pesticides
P.A. Cramer, M. Hamdane, Y. Markushin, N. MelikechiP.A. Cramer, M. Hamdane, Y. Markushin, N. Melikechi
Quinnipiac University, Hamden, CTQuinnipiac University, Hamden, CT
Delaware State University, Dover, DEDelaware State University, Dover, DE
Due to a grouping error with Unscrambler X, the data from the PCA analysis could not be identified withDue to a grouping error with Unscrambler X, the data from the PCA analysis could not be identified with
the samples we used originally. Because of this, a line graph and scatter graph were used. According tothe samples we used originally. Because of this, a line graph and scatter graph were used. According to
observations of the line graph, the Unknown sample (figure 5) closely resembles the signature of theobservations of the line graph, the Unknown sample (figure 5) closely resembles the signature of the
chemical Chlorpyrifos (figure 6). Between the scatter graphs of the group whose slides were wiped (groupchemical Chlorpyrifos (figure 6). Between the scatter graphs of the group whose slides were wiped (group
1), the group whose slides were washed and wiped (group 2), and the group whose slides were disinfected1), the group whose slides were washed and wiped (group 2), and the group whose slides were disinfected
with Hexane, washed, then wiped (group 3), the results have shown that the slides who’s surfaces werewith Hexane, washed, then wiped (group 3), the results have shown that the slides who’s surfaces were
simply wiped before the application of each sample yielded the best results. The results from the samplessimply wiped before the application of each sample yielded the best results. The results from the samples
whose slides were washed then wiped came out almost as clear as the results with the wiped slides, but thewhose slides were washed then wiped came out almost as clear as the results with the wiped slides, but the
results from the slides who were disinfected, washed, then wiped came out completely different from theresults from the slides who were disinfected, washed, then wiped came out completely different from the
others. With the first two groups a grouping of chemicals in a general, recognizable pattern occurred whereothers. With the first two groups a grouping of chemicals in a general, recognizable pattern occurred where
one is visually capable of observing the segregation between chemicals (Observe figures 7 & 8). However,one is visually capable of observing the segregation between chemicals (Observe figures 7 & 8). However,
with group 3, the segregation between chemicals was almost non-existent. Some chemicals seemed to havewith group 3, the segregation between chemicals was almost non-existent. Some chemicals seemed to have
some sort of trend to gather into a certain area on the scatter graph, but the majority of segregation withinsome sort of trend to gather into a certain area on the scatter graph, but the majority of segregation within
the graph were non-existent (observe figure 9).the graph were non-existent (observe figure 9).
(Figure 1) The picture above displays the use of pesticides on food
product, a common practice in the United States.
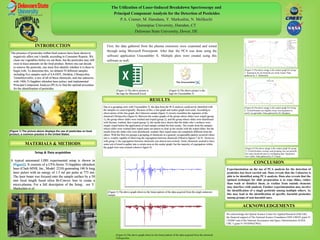
(Figure 5) The above graph observes the linear pattern of the data acquired from the single unknown(Figure 5) The above graph observes the linear pattern of the data acquired from the single unknown
sample.sample.fsfs-Ti:Sapphire Laser beam-Ti:Sapphire Laser beam
Andor MechelleAndor Mechelle
ME5000 SpectrometerME5000 Spectrometer
Sample holderSample holder
Pressure gaugePressure gauge
Optical FiberOptical Fiber
TEC coolerTEC cooler
Plasma Imaging CameraPlasma Imaging Camera
(Thorlabs)(Thorlabs)
(Figure 3) The above picture is(Figure 3) The above picture is
the logo for Microsoft Excel.the logo for Microsoft Excel.
(Figure 4) The above picture is the(Figure 4) The above picture is the
logo for Unscrambler X.logo for Unscrambler X.
(Figure 6) The above graph observes the linear pattern of the data acquired from the chemical
Chlorpyrifos.
(Figure 7) The above image is the scatter graph for Group
1. Separation for all elements are easily found. Data
gathered by Y. Markushin.
(Figure 8) The above image is the scatter graph for Group
2. Circled borders are slightly closer, but separation is
easily recognizable. Data gathered by M. Hamdane
(Figure 9) The above image is the scatter graph for group
3. Circled borders overlap, and grouping was not possible
for some chemicals due to overlapping data. Separation
not visible. Data gathered by P. Cramer.