Retail sushant nift kolkata Fashion Retail And Mall Management
ANF Stock Report
1. INVESTMENT MANAGEMENT CERTIFICATE PROGRAM May 4, 2015
Apparel Retail
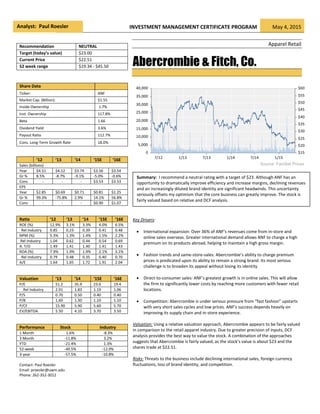
Abercrombie & Fitch, Co.
Key Drivers:
International expansion: Over 36% of ANF’s revenues come from in-store and
online sales overseas. Greater international demand allows ANF to charge a high
premium on its products abroad, helping to maintain a high gross margin.
Fashion trends and same-store-sales: Abercrombie’s ability to charge premium
prices is predicated upon its ability to remain a strong brand. Its most serious
challenge is to broaden its appeal without losing its identity.
Direct-to-consumer sales: ANF’s greatest growth is in online sales. This will allow
the firm to significantly lower costs by reaching more customers with fewer retail
locations.
Competition: Abercrombie is under serious pressure from “fast fashion” upstarts
with very short sales cycles and low prices. ANF’s success depends heavily on
improving its supply chain and in-store experience.
Valuation: Using a relative valuation approach, Abercrombie appears to be fairly valued
in comparison to the retail apparel industry. Due to greater precision of inputs, DCF
analysis provides the best way to value the stock. A combination of the approaches
suggests that Abercrombie is fairly valued, as the stock’s value is about $23 and the
shares trade at $22.51.
Risks: Threats to the business include declining international sales, foreign currency
fluctuations, loss of brand identity, and competition.
Recommendation NEUTRAL
Target (today’s value) $23.00
Current Price $22.51
52 week range $19.34 - $45.50
Share Data
Ticker: ANF
Market Cap. (Billion): $1.55
Inside Ownership 1.7%
Inst. Ownership 117.8%
Beta 1.66
Dividend Yield 3.6%
Payout Ratio 112.7%
Cons. Long-Term Growth Rate 18.0%
‘12 ‘13 ‘14 ‘15E ‘16E
Sales (billions)
Year $4.51 $4.12 $3.74 $3.56 $3.54
Gr % 8.5% -8.7% -9.1% -5.0% -0.6%
Cons - - - $3.53 $3.53
EPS
Year $2.85 $0.69 $0.71 $0.81 $1.25
Gr % 99.3% -75.8% 2.9% 14.1% 56.8%
Cons - - - $0.90 $1.07
Ratio ‘12 ‘13 ‘14 ‘15E ‘16E
ROE (%) 12.9% 3.1% 3.3% 4.0% 6.5%
Rel Industry 0.85 0.23 0.39 0.41 0.48
NPM (%) 5.3% 1.3% 1.4% 1.5% 2.2%
Rel Industry 1.04 0.62 0.44 0.54 0.69
A. T/O 1.49 1.41 1.40 1.41 1.43
ROA (%) 7.9% 1.9% 1.9% 2.1% 3.1%
Rel Industry 0.79 0.48 0.35 0.40 0.70
A/E 1.64 1.65 1.72 1.91 2.04
Valuation ‘13 ‘14 ‘15E ‘16E
P/E 51.2 35.9 23.6 19.4
Rel Industry 2.91 1.83 1.19 1.06
P/S 0.70 0.50 0.40 0.40
P/B 1.60 1.30 1.10 1.10
P/CF 15.90 5.90 5.60 5.70
EV/EBITDA 5.50 4.10 3.70 3.50
Performance Stock Industry
1 Month 1.6% -8.3%
3 Month -11.8% 3.2%
YTD -21.4% 1.3%
52-week -40.5% -12.0%
3-year -57.5% -10.8%
Contact: Paul Roesler
Email: proesler@uwm.edu
Phone: 262-352-3012
Analyst: Paul Roesler
Summary: I recommend a neutral rating with a target of $23. Although ANF has an
opportunity to dramatically improve efficiency and increase margins, declining revenues
and an increasingly diluted brand identity are significant headwinds. This uncertainty
seriously offsets my optimism that the core business can greatly improve. The stock is
fairly valued based on relative and DCF analysis.
2. INVESTMENT MANAGEMENT CERTIFICATE PROGRAM May 4, 2014
2
Company Overview
Abercrombie & Fitch (ANF) is a specialty retailer that sells casual sportswear apparel, including knit
tops and woven shirts, graphic t-shirts, fleece, jeans and woven pants, shorts, sweaters, outerwear,
personal care products, and accessories for men, women and children. ANF’s reputation for quality
and exclusivity has long allowed it to charge a premium over competitor’s prices. The firm’s portfolio
of brands targets consumers between the ages of seven and twenty-four years old. Abercrombie’s
stores are primarily located in shopping malls, but the company runs flagship stores in prime
locations in major urban centers worldwide. ANF operates stores in North America, Europe, Asia,
Australia and the Middle East; direct-to-consumer operations in North America, Europe and Asia
service its brands throughout the world. Abercrombie & Fitch is headquartered in New Albany, Ohio.
Abercrombie & Fitch generates 100% of its revenue from retail operations. ANF runs stores and
direct-to-consumer operations in four segments:
Abercrombie & Fitch: “Neo-preppy,” Ivy League and Adirondack region-inspired clothing
and accessories for high school and college-aged men and women.
abercrombie: The “kid’s store,” sells clothes similar to those of Abercrombie & Fitch
appropriate for children aged seven through fourteen.
Hollister: A more casual, Southern California-inspired brand targeting teenagers aged 14-18.
Hollister’s products are lower priced than comparable Abercrombie & Fitch merchandise.
Gilly Hicks: Sydney, Australia-inspired intimates brand selling underwear and sleepwear for
women aged 18+. All Gilly Hicks locations closed in 2014; its products are sold online and in
Hollister stores.
Source: Company reports
Figures 1 and 2: Revenue Sources for ANF, year-end 2014 (left) and Revenue history since 2010
3. INVESTMENT MANAGEMENT CERTIFICATE PROGRAM May 4, 2014
3
Business/Industry Drivers
Though several factors may contribute to Abercrombie’s future success, the following are the most
important business drivers:
1) Number of locations and international expansion
2) Fashion trends and same store sales
3) Direct-to-consumer and online presence
4) Competitor analysis
5) Macroeconomic trends
Number of Retail Locations
The number of ANF stores has been slowly but steadily declining over the last five years. Nearly 200
stores have closed in the United States; this has been partially offset by expansion overseas. ANF
plans to close approximately 60 US stores in 2015 and a similar number in each of the next few
years. Stores targeted for closure are typically underperforming, geographically redundant, or in
smaller markets. Most new store openings in the US will be outlet locations, which tend to have high
sales and reach an underserved clientele; same store sales for US outlets increased 20% in 2014.
ANF is continuing to expand internationally, and seeks to increase the amount of revenue earned
overseas to approximately 50% of total revenues by 2020. Having penetrated most major markets in
Europe, ANF’s planned expansions are primarily focused on Japan, China, and the Middle East.
Abercrombie & Fitch is relatively new outside of the United States, and has proven to be incredibly
popular; ANF’s cache is great enough that it is able to charge much higher prices for its products in
Europe and Asia than it can in the US. This has allowed ANF to maintain high gross margins even as it
has resorted to discounting in the US in order to maintain sales levels.
The success of this international expansion will depend on ANF maintaining high margins once its
novelty wears off. This strategy also opens ANF up to currency and geopolitical risks; the growing
strength of the dollar was responsible for nearly 25% of the decline in European revenue last year
and will continue to be a major headwind this year. The firm recently announced that they would
not be adjusting Eurozone prices upward in response to the Euro’s sharp decline relative to the
dollar. This will certainly have a negative impact on revenues, particularly in the first half of 2015.
ANF has been
closing
unprofitable US
stores since 2010
Source: Company reports
Figures 3 and 4: Number of ANF locations by brand, USA (left) and international
ANF’s
international
prices were often
50% - 80% higher
than US prices
4. INVESTMENT MANAGEMENT CERTIFICATE PROGRAM May 4, 2014
4
Fashion Trends and Same Store Sales
It is incredibly important for apparel retailers, particularly those targeting a younger clientele, to
adapt to the latest styles and trends. Traditional mall-based retailers have not been performing
particularly well in this regard, and ANF is no exception. Same store sales (SSS) is the best indicator
of how well consumers are receiving a retailer’s products. ANF’s SSS have not been positive since the
third quarter of 2012, and have lagged behind those of nearly every competitor. The trend of
declining SSS has been reversing since its nadir in early 2013; however, much of this is likely due to
the closure of the worst performing stores.
Figure 6: Same Store Sales vs Competitors
Source: FactSet
The poor performance of the Hollister brand has been a major factor in the declining revenues and
SSS at ANF over the past several years. The merchandise at Hollister and Abercrombie & Fitch is
stylistically comparable, but Abercrombie’s clothes are higher quality and command much higher
prices. I believe that once Abercrombie & Fitch began regularly discounting in mid-2013, many
habitual Hollister customers began to put off purchases until they could buy discounted
Abercrombie & Fitch merchandise at a comparable price.
Figures 4 and 5: 2013 revenue by region (left) and 3-YR CAGR
Source: Company reports
ANF’s same store
sales growth has
been among the
industry’s worst
since 2012
5. INVESTMENT MANAGEMENT CERTIFICATE PROGRAM May 4, 2014
5
Figure 7: Same Store Sales by Brand
ANF’s continued ability to charge a premium for its products far in excess of that of its competitors is
the prime factor in the firm’s ability to stay profitable in the face of declining revenues. Abercrombie
& Fitch’s materials and garment construction are generally considered to be at the very top of the
market segment, challenged only by The Gap’s Banana Republic brand.
Figure 8: Gross margin %, ANF vs. comps and subindustry
ANF is believed to be the victim of a shift in consumer preference away from conspicuously branded
apparel. Heavy branding had been very popular from the late 1970s until only very recently, and the
trend was exemplified by Abercrombie & Fitch and its two closest competitors, Aeropostale and
American Eagle, together referred to in the industry as, “the three A’s.” SSS at these three retailers
plummeted relative to their competitors in the summer of 2013 and have not yet recovered. ANF
began moving away from heavy logo-based apparel in the summer of 2014, and has now settled on a
blend of branded and unbranded merchandise.
Following the departure of long-serving CEO Mike Jeffries in December 2014, ANF has become more
inclusive and will begin selling merchandise in larger sizes. Stores will become more shopper-friendly
and manager priorities are being shifted towards customer service.
Source: Company reports
Abercrombie &
Fitch appears to
be, “reverse-
cannibalizing,” its
lower-cost
subsidiary.
In a controversial
2013 interview,
then-CEO Mike
Jeffries stated that
he did not want
overweight people
shopping at ANF.
Source: FactSet
6. INVESTMENT MANAGEMENT CERTIFICATE PROGRAM May 4, 2014
6
Figure 9: SSS Growth, “3 A’s” vs. comps
The latest trend in fashion is a move away from a “complete look,” approach to one stressing
individual items. The belief is that consumers now prefer to mix and match items to create their own
unique looks, rather than put together an ensemble to match a brand’s overall aesthetic. This is a
huge challenge for ANF, as it has exemplified the, “complete look,” approach to fashion for the past
20 years. “Fast fashion,” newcomers Zara, H & M, and Forever 21 produce inexpensive garments
modeled after the latest runway fashions, and product design and supply chain innovations allow
Zara and Forever 21 to come out with entirely new inventories as much as once per month. In
response, ANF is moving to diversify its offerings and speed up product turnover moving forward.
The firm is abandoning large seasonal “floorsets,” which led to inventory backlogs, in favor of a
rolling replacement of products.
Figure 10: Average days in Inventory, ANF vs comps
Assuming a 25% markdown after 60 days and a 50% markdown after 90 days, if days in inventory
had been a more typical 105 in 2014 ANF would have increased revenue by $326 million and
reduced ending inventory by $165 million. This additional revenue (taxed at 2014’s basic tax rate of
36.7%) would have added $2.87 per share to earnings – more than four times the 2014 EPS of $0.71.
This strongly suggests that ANF’s inability to quickly move merchandise, and the resultant
markdowns, is perhaps the firm’s biggest impediment to increasing profitability.
Source: FactSet
Logo-centric
brands have seen
sales suffer as a
result of changing
consumer
preferences.
Source: FactSet
ANF’s inventory
turnover was low
even at peak sales.
Average days in
inventory is
typically in the 95-
105 day range.
Privately held
Forever 21 and
Inditex subsidiary
Zara may turn over
inventory in as few
as 21 days.
7. INVESTMENT MANAGEMENT CERTIFICATE PROGRAM May 4, 2014
7
Direct to Consumer and Online Presence
ANF operates a total of 46 websites in both desktop and mobile versions; websites are available in
nine languages, accept seven currencies, and ship to over 120 countries. These websites are
designed to complement the in-store experience as part of ANF’s omnichannel efforts. Ship-from-
store is now available in 370 stores and order-in-store is available in 660 stores, all in the US. The
firm plans to launch omnichannel capabilities in Europe, localized direct-to-consumer capabilities in
Asia, and reserve-in-store and in-store-pickup in 2015.
ANF has always eschewed traditional advertising; however, the company has made a concerted
effort to market to consumers through online and social media channels. Fan growth in platforms
such as Facebook, Twitter and Instagram has increased by over 25% year-over-year, and total social
engagement has increased by 400%. This social engagement may not be translating into more
online sales; none of ANF’s brand websites were listed among consumers’ top 50 e-retailers in 2013
or 2014 (National Retail Federation.)
Direct-to-consumer sales have been steadily growing in the long term, but growth has decelerated in
recent months. The company has a goal of increasing direct-to-consumer penetration to 25% of net
sales or greater while maintaining operating margins above 30%, more than double that of its brick-
and-mortar business. Although ANF is close to meeting this goal, much of the percentage increase is
due more from contraction in ANF’s traditional business channels than from growth in direct-to-
consumer sales.
Figure 11: Direct-to-consumer revenues and % of total revenues
Competitor Analysis
Consumer apparel is a highly fragmented, incredibly competitive industry. There are very low
barriers to entry, as it is not capital intensive, does not rely on advanced technology, and requires
little fixed assets per employee. Consumers have a lot of power over apparel retailers because there
is no cost to switching if the clothing is viewed merely as a commodity; therefore, it is important for
these retailers to convince the consumer that there is something unique about their merchandise
that increases its utility. This can be achieved by providing superior quality and by forming an
emotional connection with the consumer. A strong brand identity can generate a sustainable
competitive advantage and create barriers to competition, including premium pricing, leverage over
distributors, and prime mall placement; however, a brand’s image must be carefully protected
because brand loyalty is much weaker today than in the past.
Abercrombie & Fitch and its competitors in young adult apparel retail are operating in an
increasingly competitive business environment. Advances in supply chains and product development
Source: Company Reports
Competitors
Express, H & M,
American Eagle,
and the three
major Gap brands
are all top-50 e-
retailers.
The, “fast
fashion,” business
model has many
apparel retailers
reevaluating their
strategy.
Order-in-store will
improve inventory
turnover, as
customers can
quickly order sold-
out products.
8. INVESTMENT MANAGEMENT CERTIFICATE PROGRAM May 4, 2014
8
have allowed “fast fashion,” retailers, such as Zara and Forever 21, to produce new product lines
incredibly quickly and at very low cost. Companies that have relied on teenagers for revenue are
especially at risk, as teens increasingly, “hang out,” online rather than at the mall, and spend a
greater portion of their income on technology. Many analysts view the recent bankruptcies of Delia’s
and Wet Seal as harbingers of greater disruption in the industry.
This subindustry segment of primarily mall-based clothing retailers is clearly dominated by The Gap
(GPS) which has brands tailored to all age groups and covering a wide range of prices. ANF’s closest
competitors in terms of style and target demographics are Aeropostale (ARO) and American Eagle
Outfitters (AEO). As noted earlier, these three retailers have underperformed their peers since mid-
2013.
Figures 12 and 13: Comparison of ANF comps by market cap (left) and retail sales
Macroeconomic Trends
The retail apparel industry is a cyclical business, and is positively correlated to consumer confidence.
ANF and its competitors in youth fashion are particularly sensitive to the teenage unemployment
rate.
.
Figures 14 and 15: Consumer confidence compared to ANF comps (left) and consumer confidence compared to ANF
comps relative to the S&P 500 index
Source: FactSet, IMCP
Source: Bloomberg, IMCP
9. INVESTMENT MANAGEMENT CERTIFICATE PROGRAM May 4, 2014
9
The year-over-year performance of ANF and its competitors closely tracked rises and falls in
consumer confidence until mid-2013, but only outperformed the S&P 500 in periods when consumer
confidence was rapidly increasing.
ANF and its competitors performed well both on an absolute basis and relative to the S&P 500
before a sustained period of high teen unemployment beginning in 2008. Mall-based apparel
retailers have not much benefited from the drop in teenage unemployment that began in 2013. I
believe that current trends favoring lower-priced retailers like Forever 21 are partially a function of
teens’ reduced spending power in the 2008-2013 period; however, the dramatic increase in teen
spending on electronics since the 2007 introduction of the iPhone must not be discounted.
Financial Analysis
I anticipate EPS to grow to $0.81 in FY 2015. Declining revenues in US and international stores should
decrease earnings by $0.55 and $0.49, respectively, offset by a $0.34 per share increase in direct-to-
consumer earnings. Store closures and more efficient store operations will more than offset
increased distribution expense to add a further $0.42 to EPS. A modestly higher gross margin,
courtesy of premium pricing in new Asian stores, should add $0.16. I anticipate that SG&A will fall
slightly, adding $0.07 to earnings. Finally, I forecast that an increase in interest expense will be offset
by a decrease in the tax rate and the repurchase of 6.8 million shares for a net EPS increase of $0.14.
Figure 18: Quantification of 2015 EPS drivers
Figures 16 and 17: Unemployment rate, age 16-19, compared to ANF comps (left) and Unemployment rate, age 16-19,
compared to ANF comps relative to the S&P 500 index
Source: Bloomberg, IMCP
Mall-based
apparel retailers
have not benefited
from the recent
drop in teenage
unemployment
Source: Company Reports, IMCP
10. INVESTMENT MANAGEMENT CERTIFICATE PROGRAM May 4, 2014
10
Q1 2015E Q2 2015E Q3 2015E Q4 2015E FY 2015E Q1 2016E Q2 2016E Q3 2016E Q4 2016E FY 2016E
Revenue - Estimate $718,007 $800,157 $910,045 $1,128,043 $3,556,252 $736,922 $816,215 $884,268 $1,098,111 $3,535,515
YoY Growth -13% -10% 0% 1% -5% 3% 2% -3% -3% -1%
EPS - Estimate ($0.37) ($0.06) $0.30 $0.94 $0.81 ($0.19) $0.08 $0.36 $1.02 $1.27
YoY Growth 16% -135% 20% 49% 14% 49% 233% 20% 9% 57%
EPS - Consensus ($0.33) ($0.04) $0.31 $0.97 $0.90 ($0.21) $0.06 $0.34 $0.99 $1.07
YoY Growth 3% -124% 24% 54% 27% -36% -250% 10% 2% 19%
I expect 2016 EPS to increase $0.44 to $1.25. Abercrombie will lose $0.66 of earnings from
decreased sales in US stores, but gain $0.12 and $0.44 from increased sales in international stores
and from direct-to-consumer. I anticipate a contraction in gross margin from US discounting will
reduce EPS by $0.14 and an increase in advertising expense will increase SG&A, leading to a further
$0.03 decrease. Additional closures of low-performing stores and increased efficiency in store
operations and the supply chain should add $0.68 to 2016 EPS, with the net effect of the buyback of
3.2 million shares and increased interest expense adding another $0.05.
Figure 19: Quantification of 2016 EPS drivers
I am slightly more pessimistic than consensus estimates for 2015, particularly in the first two
quarters. However, I anticipate stronger growth in 2016 driven primarily by ANF’s commitment to
improving efficiency, particularly at the store level.
Revenues
Abercrombie & Fitch’s revenue has declined steadily since peaking in 2012. While I expect that trend
to continue in 2015 and 2016, I expect the rate of decline to diminish significantly, driven by
expansion in Asia and increasing direct-to-consumer sales. The US Stores segment will continue to
suffer declining sales as more stores are closed; I anticipate that the number of stores in the United
States will be near 550 by 2020. Domestic same store sales should begin rising again in 2017, as the
bulk of the stores open by that time will be high performing stores, stores in prime locations, and
outlet stores; this will partially mitigate the effects of store closures.
International store revenue should begin growing again in 2016; the European economy should grow
after this year’s government stimulus, driving sales and strengthening the Euro against the dollar.
More flagship stores in China and the Middle Eastern gulf states will offset the closure of all
Source: Company Reports, IMCP
Figure 20: EPS and YoY growth estimates
Source: Factset, IMCP
11. INVESTMENT MANAGEMENT CERTIFICATE PROGRAM May 4, 2014
11
Australian stores, which sustained higher shipping costs and presented seasonality challenges
because of their location in the southern hemisphere.
Figure 20: Abercrombie & Fitch segment revenues, 2010 – 2016E
Direct-to-consumer revenue should continue to improve as omni-channel capabilities increase, and
direct-to-consumer web functionality and distribution improves in Asia. Online sales should surpass
international store sales in 2016, and could surpass US store sales by as early as 2019. In the long
term, direct-to-consumer will be the primary driver of revenue growth.
Figure 21: Revenue vs YoY revenue growth, 2012 – 2016E
Operating Income and Margins
Operating expenses are composed primarily of Selling, General and Administrative expense and
Stores and Distribution expense. Advertising expense is broken out of SG&A, and Shipping &
Handling expense is contained within Stores and Distribution expense. I expect most of the savings
from ANF’s profit maximizing initiatives to come out of Stores expense, as SG&A has remained
relatively stable as a percentage of sales and contains a baseline of overhead which cannot be
reduced.
Source: Company Reports, IMCP
Source: Company Reports
12. INVESTMENT MANAGEMENT CERTIFICATE PROGRAM May 4, 2014
12
2013 2014 2015E 2016E
Sales 4,116,897 3,744,030 3,556,252 3,535,515
Cost of goods sold 1,541,462 1,430,460 1,337,151 1,343,496
Gross income 2,575,435 2,313,570 2,219,102 2,192,019
Gross margin 62.56% 61.79% 62.40% 62.00%
Operating expenses
SG&A 481,784 458,820 430,307 431,333
Growth 1.7% -4.8% -6.2% 0.2%
Stores and distribution 1,907,687 1,703,051 1,642,989 1,573,304
Growth -3.7% -10.7% -3.5% -4.2%
Other operating expenses 105,141 38,180 40,000 40,000
Operating income 80823 113519 105,806 147,382
Operating margin 1.96% 3.03% 2.98% 4.17%
Abercrombie & Fitch will be closing between 50 and 60 stores per year for the next four years; the
costs of operating these stores will be coming out of Stores expense. Stores expense at existing
stores will be lowered as a result of profit maximizing initiatives. This includes labor reductions from
a decreased emphasis on store staging, streamlining of stockroom operations and general reductions
in work hours. Managerial efficiency will be promoted through newly enacted performance
incentives, and the recent relaxation of physical standards for employees will lead to a dramatic
reduction in time spent recruiting.
The large reductions in both SG&A and Stores and Distribution expense will have a strongly positive
impact on ANF’s operating margin going forward, and should allow for much greater margin
expansion when revenues begin to increase after 2016. As most of the direct-to-consumer
infrastructure will finally be in place after the completion of ANF’s dedicated online sales distribution
center in July 2015, distribution expense will become a smaller percentage of direct-to-consumer
sales going forward.
Figure 24: ANF Operating margins, 2013 – 2016E
Figures 22 & 23: Composition of 2014 operating expenses (left) and operating expenses vs YoY operating expense growth
Source: Company Reports
Managers who
were good
recruiters were
more likely to be
promoted than
ones who merely
delivered high
sales.
Former CEO Mike
Jeffries’ emphasis
on being “cool”
led to business
practices that
were far from
efficient. Most of
these policies can
be easily reversed.
Source: Company Reports
13. INVESTMENT MANAGEMENT CERTIFICATE PROGRAM May 4, 2014
13
Return on Equity
Abercrombie & Fitch has had an unusually low ROE in the past two years, but ROE should nearly
double to 6.4% within the next two years. DuPont analysis for ANF reveals that ROE is driven almost
exclusively by profit margins, as asset turnover has been remarkably constant since 2011; ANF’s
assets have recently been decreasing at almost the exact rate of sales.
Figure 25: ROE breakdown, 2011 – 2016E
I expect ROE growth in the next two years to be only modestly affected by leverage, as ANF is
expected to increase borrowing in order to fund its reorganization and prevent cash shortfalls. This
additional debt will not have a material impact on ANF’s solvency, as the debt/asset ratio will
increase only 6.2%, to 17.9%, and I project that the lowest interest coverage ratio in the next five
years will be a healthy 4.72.
Free Cash Flow
Figure 26: Free cash flows 2010 – 2016E
3-stage DuPont 2011 2012 2013 2014 2015E 2016E
Net income (cont) / sales 3.4% 5.3% 1.3% 1.4% 1.5% 2.2%
Sales / avg assets 1.39 1.49 1.41 1.40 1.41 1.43
ROA 4.8% 7.9% 1.9% 1.9% 2.1% 3.1%
Avg assets / avg equity 1.60 1.64 1.65 1.72 1.91 2.04
ROE 7.6% 12.9% 3.1% 3.3% 4.0% 6.4%
Free Cash Flow
2010 2011 2012 2013 2014 2015E 2016E
NOPAT $152,493 $145,489 $241,718 $60,254 $59,329 $66,975 $93,293
Growth -4.6% 66.1% -75.1% -1.5% 12.9% 39.3%
NWC* 48,064 115,277 (26,482) 167,228 160,410 135,138 127,279
Net fixed assets 1,414,100 1,544,520 1,679,577 1,530,431 1,340,195 1,383,756 1,219,143
Total net operating capital* $1,462,164 $1,659,797 $1,653,095 $1,697,659 $1,500,605 $1,518,893 $1,346,422
Growth 13.5% -0.4% 2.7% -11.6% 1.2% -11.4%
- Change in NWC* 67,213 (141,759) 193,710 (6,818) (25,272) (7,859)
- Change in NFA 130,420 135,057 (149,146) (190,236) 43,561 (164,613)
FCFF* ($52,144) $248,420 $15,690 $256,383 $48,687 $265,765
Growth -576.4% -93.7% 1534.1% -81.0% 445.9%
- After-tax interest expense 2,210 2,351 4,707 5,626 7,508 14,182 16,461
FCFE** ($54,495) $243,713 $10,064 $248,875 $34,505 $249,304
Growth -547.2% -95.9% 2372.9% -86.1% 622.5%
FCFF per share* ($0.60) $3.03 $0.20 $3.57 $0.75 $4.33
Growth -604.9% -93.3% 1656.4% -79.0% 477.9%
FCFE per share** ($0.63) ($2.97) $0.13 $3.47 $0.53 $4.06
Growth 371.4% -104.4% 2569.2% -84.7% 666.0%
ANF’s term loan
facility provides
for up to $300
million in
borrowing at
LIBOR + 1.5%.
Source: Company Reports, IMCP
Source: Company Reports
14. INVESTMENT MANAGEMENT CERTIFICATE PROGRAM May 4, 2014
14
ANF’s free cash flow has been remarkably volatile over the last several years. The firm paid off $58
million in debt in 2012, only to borrow a total of nearly $300 million over the next 2 years while
reducing fixed assets. I forecast that NOPAT will grow at a much faster pace than net operating
capital over the next two years, and ANF’s term loan facility gives it the ability to meet any funding
shortfalls that may arise. The firm has repurchased 15 million shares in the past five years and has
the option to repurchase 10 million more; I fully expect them to do so in the next two years, as the
stock price is at a five year low.
I expect both FCFF and FCFE to decline over 80% in 2015 as the result of a 2.9% increase in net fixed
assets following a 12.4% decline in 2014. This should rebound significantly in 2016 as capital activity
is projected to decline once again.
Valuation
ANF was valued using multiples and a 3-stage discounting cash flow model. Based on earnings
multiples, the stock is expensive relative to other firms and is worth $15.80; however, due to the
volatility of ANF’s earnings the past few years, as well as the effect of recent nonrecurring expenses,
this metric may be unreliable. Relative valuation shows ANF to be slightly undervalued based on its
fundamentals versus those of its peers in the retail apparel industry. Price to book valuation yielded
a price of $19.12. A detailed DCF analysis values ANF slightly higher, at $24.96; I give this value a bit
more weight because it incorporates assumptions that reflect ANF’s ongoing structural changes.
Finally, a probability-weighted scenario analysis yields a price of $24.11. As a result of these
valuations, I value the stock at $23.00.
Trading History
ANF is currently trading near its five year high relative to the S&P 500. This is the result of recent
earnings depression and the fact that most analysts believe that earnings will grow in the future.
ANF’s current NTM P/E is at 22.5 compared to its five year average of 15.2. While I expect some
regression towards that number in the future, I do not think that is likely to be the case in the near
term.
Figure 27: ANF NTM P/E relative to S&P 500
Source: Factset
15. INVESTMENT MANAGEMENT CERTIFICATE PROGRAM May 4, 2014
15
Assuming the firm maintains a 22.5 NTM P/E at the end of 2015, it should trade at $18.23 by the end
of the year.
Price = P/E x EPS = 22.5 x $0.81 = $18.23
Discounting $18.23 back to today at a 15.33% cost of equity (explained in Discounted Cash Flow
section) yields a price of $15.80. Given ANF’s potential for earnings growth and continued
profitability, this seems to be an unusually low valuation. However, this makes sense because I am
less bullish about near-term earnings than consensus.
Relative Valuation
Abercrombie is currently trading at a P/E much higher than its peers, with a P/E TTM of 31.2
compared to an average of 17.9. Investors are willing to temporarily pay a premium for ANF because
it has the potential for greater growth than many of the other companies in its market segment, and
its value is not fully captured by last year’s earnings, which were heavily depressed by writedowns
associated with the restructuring of the Gilly Hicks brand. However, ANF’s P/B and P/S ratios are
significantly lower than those of its peers – both are roughly half the average for the group. This is a
reflection of ANF’s relatively poor ROE and net margin compared to its competitors.
A more thorough analysis of P/B and ROE is shown in figure 29. The calculated R-squared of the
regression indicates that over 96% of a sampled firm’s P/B is explained by its NTM ROE. Note that
that Quicksilver, Pac Sun and Aeropostale are excluded from this regression, because they have
negative price/book ratios or ROEs. ANF has the lowest P/B and ROE of this grouping, and according
to this measure is slightly undervalued. However, given the headwinds that the apparel industry is
dealing with, I believe that ROE will be more highly valued by investors in the coming months. I
steepened the slope of the regression line, yielding a new equation for finding P/B.
Estimated P/B = Estimated 2015 ROE (4%) x 13.146 + .6291 = 1.155
Target Price = Estimated P/B (1.155) x 2015E BVPS (19.10) = $22.06
Figure 28: ANF comparable companies
Source: Factset
2014 non-GAAP EPS,
which excluded
restructuring
charges, were $1.54.
P/E would be 14.6
using this measure.
ANF’s BVPS was
$20.04 last quarter,
by far the highest of
any of its
competitors.
16. INVESTMENT MANAGEMENT CERTIFICATE PROGRAM May 4, 2014
16
Discounting back to the present at a 15.33% cost of equity leads to a target price of $19.12 using
this metric.
Figure 29: P/B vs NTM ROE
For a final comparison, I created a composite ranking of several valuation and fundamental metrics.
An equal weighting of long term growth rate, 2014 and 2015E P/E, NTM ROE and NTM sales growth
was compared to an equal weight composite of P/S, P/E and P/B. After eliminating Buckle, an
extreme outlier, the regression line had an R-squared of .74.
Figure 30: Composite valuation, % of range
Source: Factset
Source: IMCP
17. INVESTMENT MANAGEMENT CERTIFICATE PROGRAM May 4, 2014
17
Figure 31: Composite relative valuation
Discounted Cash Flow Analysis
A three stage discounted cash flow model was also used to value ANF.
For the purpose of this analysis, the company’s cost of equity was calculated to be 15.33% using the
Capital Asset Pricing Model. The underlying assumptions used in calculating this rate are as follows:
The risk free rate, as represented by the ten year Treasury bond yield, is 1.92%.
A ten year adjusted beta of 1.66 was utilized since the company has higher risk than the market.
A long term market rate of return of 10% was assumed, since historically, the market has
generated an annual return of about 10%.
Given the above assumptions, the cost of equity is 15.33% (1.92 + 1.66 (10.0 – 1.92)).
Stage One - The model’s first stage simply discounts fiscal years 2015 and 2016 free cash flow to
equity (FCFE). These per share cash flows are forecasted to be $0.53 and $4.06, respectively.
Discounting these cash flows, using the cost of equity calculated above, results in a value of $3.51
per share. Thus, stage one of this discounted cash flow analysis contributes $3.51 to value.
Stage Two - Stage two of the model focuses on fiscal years 2017 to 2021. During this period, FCFE is
calculated based on revenue growth, NOPAT margin and capital growth assumptions. The resulting
cash flows are then discounted using the company’s 15.33% cost of equity. I assume 1.6% sales
growth in 2017, rising to 5% through 2021. The ratio of NWC to sales will remain at 2016 levels, but
NFA turnover will rise from 2.90 in 2016 to 3.47 in 2021 as a result of improvements in operations.
Also, the NOPAT margin is expected to rise to 4.0% in 2021 from 2.6% in 2016. Finally, after-tax
interest is expected to rise 2.5% per year as the result of modest increases in borrowing.
Figure 32: FCFE and discounted FCFE, 2015 – 2021
Added together, these discounted cash flows total $4.10.
2016 2016 2017 2018 2019 2020 2021
FCFE $0.53 $4.06 $2.19 $1.27 $1.30 $1.55 $1.89
Discounted FCFE $0.46 $3.05 $1.43 $0.72 $0.64 $0.66 $0.70
Source: IMCP
18. INVESTMENT MANAGEMENT CERTIFICATE PROGRAM May 4, 2014
18
Stage Three – Net income for the years 2017 – 2021 is calculated based upon the same margin and
growth assumptions used to determine FCFE in stage two. EPS is expected to grow from $0.81 in
2016 to $2.63 in 2021.
Figure 33: EPS estimates for 2015 – 2021
Stage three of the model requires an assumption regarding the company’s terminal price-to-
earnings ratio. For the purpose of this analysis, it is generally assumed that as a company grows
larger and matures, its P/E ratio will converge near to the historical average of the S&P 500.
Therefore, a P/E ratio of 18 is assumed at the end of ANF’s terminal year. While this may be a high
multiple at the end of 2021, one must consider what the market will price in today. A lower multiple
may be better to calculate a fair value, but the stock will likely trade above this value because the
market will be slow to price in ANF’s slowing growth.
Given the assumed terminal earnings per share of $2.63 and a price to earnings ratio of 18, a
terminal value of $46.88 per share is calculated. Using the 15.33% cost of equity, this number is
discounted back to a present value of $17.34.
Total Present Value – given the above assumptions and utilizing a three stage discounted cash flow
model, an intrinsic value of $24.96 is calculated (3.51 + 4.10 + 17.34). Given ANF’s current price of
$22.51, this model indicates that the stock is slightly undervalued.
Scenario Analysis
Abercrombie & Fitch is difficult to value with certainty because it is nearly impossible to predict with
certainty how consumers will react to an abrupt shift in a brand’s identity and target demographics.
Furthermore, the firm seems no closer to naming a new CEO at this point in time than it was six
months ago, raising questions as to how well the brand’s image will be managed and how effectively
new cost-control initiatives will be implemented. I valued ANF under twelve scenarios by changing
combinations of three key factors. More detailed numbers can be found in Appendix 8.
Sales Growth – Strong growth assumes that ANF’s new identity is able to draw in more customers
relatively quickly and reverse the declining sales trend by 2016, with sales returning to 2012 levels by
2019 and surpassing $5 billion in 2021; I give this outcome a 20% probability because of the
significant headwinds the apparel retail sector has been facing. Modest growth is the base
assumption used in the prior DCF analysis, and is given a 60% probability. Poor growth assumes that
many of ANF’s most loyal customers are turned off by the brand’s new approach, and the firm is
unable to attract enough new customers to grow revenues strongly. Under this scenario, revenue in
2021 is still below 2014 levels; I give this outcome a 20% probability because while ANF’s US stores
have suffered sales declines, there are still good opportunities for growth abroad and online.
Gross Margin – Scenario one, stable gross margin, assumes that ANF is able to keep charging a
premium for its products even as it distances its brand from its elitist image. In order to do this, the
brand will have to rely chiefly on the perception of its products as being of superior quality. Scenario
two, declining gross margin, assumes that ANF is forced to charge less for its products in order to
better compete with lower cost rivals. Because ANF’s brand identity is currently in transition, close
competitors have already seen margins contract, and poor sales will likely lead to discounting, I
assign a 50% probability of maintaining current margins even if sales growth is strong, a 30%
probability of maintaining margins if sales growth is modest, and a 20% probability of maintaining
margins if sales growth is weak.
2016 2016 2017 2018 2019 2020 2021
EPS $0.81 $1.25 $1.42 $1.75 $2.00 $2.26 $2.63
19. INVESTMENT MANAGEMENT CERTIFICATE PROGRAM May 4, 2014
19
Operating Efficiency – In recent years ANF’s operations have been so inefficient that any
management team focused on reducing costs should have a relatively easy time finding ways to
eliminate waste and streamline operations. Current management is clearly focused on cost
reduction and has already begun to succeed in this regard. Therefore, I assign an 80% probability for
significant reductions in both stores and distribution expense and SG&A expense as a percentage of
sales without regard to the other two scenarios.
Figure 34: Scenario analysis
A valuation of ANF stock was reached using the same discounted cash flow method outlined in the
previous section. Each scenario’s value was then multiplied by the scenario’s probability to yield a
probability-weighted value; the sum of these values is the likely price. This technique results in a
target price of $24.11.
One can see from this analysis that ANF is much more sensitive to changes in gross margin and
operating efficiency than it is to revenue growth. ANF has stayed profitable despite poor sales
because of its high gross margin, but still has a relatively poor profit margin because of high
operating costs. If gross margins are maintained and efficiency is improved, the stock should greatly
increase in value regardless of the rate of sales growth. If ANF is not able to both improve efficiency
and maintain its gross margin, however, the stock is at best fairly valued. Note that a declining gross
margin and modest cost reduction result in very low prices even if sales growth is strong.
I recommend paying close attention to ANF’s gross margin and operating costs as time progresses. If
gross margins stay above 60% and operating costs continue to fall as a percentage of sales, the stock
would be significantly undervalued regardless of revenue growth. However, if gross margins appear
to be falling I would approach this stock only with extreme caution; at gross margins below 55% it is
unlikely that the firm can maintain profitability as currently organized.
Sales Cost Savings Gross Margin DCF Value Probability Weighted Value
Stable (p=0.5) $44.80 8.0% $3.58
Declining (p=0.5) $25.48 8.0% $2.04
Stable (p=0.5) $26.07 2.0% $0.52
Declining (p=0.5) $6.65 2.0% $0.13
Stable (p=0.3) $39.64 14.4% $5.71
Declining (p=0.7) $22.20 33.6% $7.46
Stable (p=0.3) $22.66 3.6% $0.82
Declining (p=0.7) $5.30 8.4% $0.45
Stable (p=0.2) $30.71 3.2% $0.98
Declining (p=0.8) $17.06 12.8% $2.18
Stable (p=0.2) $16.96 0.8% $0.14
Declining (p=0.8) $3.14 3.2% $0.10
Total of Probability Weighted Values: $24.11
Strong
Growth
(p=0.2)
Modest
Growth
(p=0.6)
Weak
Growth
(p=0.2)
Significant
(p=0.8)
Modest
(p=0.2)
Significant
(p=0.8)
Modest
(p=0.2)
Significant
(p=0.8)
Modest
(p=0.2)
20. INVESTMENT MANAGEMENT CERTIFICATE PROGRAM May 4, 2014
20
Business Risks
Although I have many reasons to be optimistic about Abercrombie & Fitch, there are several good
reasons why I find the stock to be fairly priced only a few dollars above its 52-week low:
Exposure to currency fluctuations:
Nearly 40% of ANF’s revenues are denominated in currencies other than the dollar. Continued
strength of the dollar against the Euro, Yen and Yuan will seriously reduce gross margins.
Competitive marketplace:
Competition for customers is fierce both in malls and online. Lower priced competitors have stolen
market share in the past five years as young shoppers increasingly spend a larger portion of their
income on electronics.
Labor issues:
Abercrombie relies upon low-wage part time workers to staff its stores. Labor laws in Europe tend to
be less favorable than in the US, and can result in dramatic increases in store expense. Recent moves
to increase the minimum wage in several US states could hurt operating margins.
Inability to maintain gross margin:
Abercrombie relies on its industry high gross margin to stay profitable; a small decrease in gross
margin would seriously impact earnings. If customers are unwilling to pay extra for the Abercrombie
brand, ANF’s business model may no longer work.
Loss of brand identity:
The departure of CEO Mike Jeffries has allowed ANF to move past an image that most observers
believe was no longer a benefit to the firm. The risk is that after distancing itself from its former
elitist image, the company may fail to develop a new identity that resonates with consumers.
27. INVESTMENT MANAGEMENT CERTIFICATE PROGRAM May 4, 2014
Third Stage
Terminal value P/S
Sales $3,556,252 $3,535,515 $3,592,083 $3,771,687 $3,960,272 $4,197,888 $4,449,761
Growth -0.6% 1.6% 5.0% 5.0% 6.0% 6.0%
Net profit margin 1.5% 2.2% 2.4% 2.8% 3.1% 3.3% 3.6%
Terminal P/S 0.70
* Terminal SPS $72.51
Terminal value $50.76
* Discount factor 0.37
Discounted terminal value $18.70
Terminal value P/B
Book value $1,240,521 $1,178,259 $1,248,955 $1,323,892 $1,403,326 $1,487,525 $1,576,777
Growth -5.0% 6.0% 6.0% 6.0% 6.0% 6.0%
ROE (EOY book) 4.3% 6.5% 7.0% 8.1% 8.6% 9.2% 10.1%
Terminal P/B 1.80
* Terminal BPS $25.69
Terminal value $46.25
* Discount factor 0.37
Discounted terminal value $17.04
Terminal value P/E
Net income $52,793 $76,832 $87,380 $107,340 $121,141 $137,504 $159,816
% of sales 1.5% 2.2% 2.4% 2.8% 3.1% 3.3% 3.6%
EPS $0.81 $1.25 $1.42 $1.75 $1.97 $2.24 $2.60
Growth 54.1% 13.7% 22.8% 12.9% 13.5% 16.2%
Terminal P/E 18.00
* Terminal EPS $2.60
Terminal value $46.88
* Discount factor 0.37
Discounted terminal value $17.34
Terminal value constant growth
FCFE $0.53 $4.06 $2.19 $1.27 $1.28 $1.52 $1.86
Growth 664.9% -46.2% -42.1% 1.1% 19.0% 22.3%
Long-term growth 6.0%
Cost of equity 15.3%
Cost of equity - growth rate 9.3%
Terminal value (FCFE (1+g) / (r-g)) $21.17
* Discount factor 0.37
Discounted terminal value $7.80
Summary
First stage $3.51 Present value of first 2 year cash flow
Second stage $4.10 Present value of year 3-7 cash flow
Third stage $18.70 Present value of terminal value P/S
Third stage $17.04 Present value of terminal value P/B
Third stage $17.34 Present value of terminal value P/E
Third stage $7.80 Present value of terminal value constant growth
Value (P/S) $26.32 = value at beg of fiscal yr 2015
Value (P/B) $24.66 = value at beg of fiscal yr 2015
Value (P/E) $24.96 = value at beg of fiscal yr 2015
Value (CG) $15.42 = value at beg of fiscal yr 2015
28. INVESTMENT MANAGEMENT CERTIFICATE PROGRAM May 4, 2014
60 (90-60) (126-90) 60 (90-60) (105-90)
126 126 126 105 105 105
x
3,744,030
= 325,973
(1-0.25) + x( (1-0.25) + (1-0.5) )(1-0.5) ) ( + x-+ x
Avg D2 - Avg D
(
365
xCOGSx2Change in Ending Inventory =
Appendix 7: Inventory Turnover Equations
30. INVESTMENT MANAGEMENT CERTIFICATE PROGRAM May 4, 2014
Appendix 9: Porter’s 5 Forces
Threat of New Entrants – Relatively Low
While the barriers to entry into the apparel retail industry are not extensive, it would require significant real estate or
online presence to cause a major disruption in the industry. The most significant threat would be entry of an established
European brand, but European fashion has traditionally not translated well to the American mass market.
Threat of Substitutes - High
Abercrombie relies on its brand power to convince customers to pay more for products that have huge numbers of
potential lower-cost substitutes. There is no cost of switching to the consumer. This is always a major threat for a
retailer.
Supplier Power - Low
Textile manufacturers of non-luxury clothing items have little to no leverage over their customers, and modern
production techniques have made it very easy to switch suppliers with little cost in time, money or efficiency.
Buyer Power – Very High
Consumers of retail apparel goods have a great degree of power over retailers. There is no cost of switching between
brands and a large number of potential substitutes. There is little urgency for consumers to buy new apparel, so they are
able to wait to get a better price if they are unwilling to pay what is asked.
Intensity of Competition – Very High
There are numerous national and international clothing brands that all occupy retail space in the same shopping centers,
as well as online-only retailers. As foot traffic in malls has decreased, ANF’s traditional rivals are fighting even harder to
obtain market share. Aggressive discounting by one will usually cause others to follow suit, hurting profit margins for all
participants.
Appendix 9: SWOT Analysis
High gross margins Cannibalization of sales
High brand recognition Low inventory turnover
Prime store locations Overexpansion
International expansion Currency headwinds
Direct-to-consumer expansion Rising labor costs
Broaden consumer appeal Loss of brand identity
Strengths Weaknesses
Opportunities Threats