3. ii
To
the
Faculty
of
Washington
State
University:
The
members
of
the
Committee
appointed
to
examine
the
thesis
of
PAUL
FOSTER
GAMBLE
find
it
satisfactory
and
recommend
that
it
be
accepted.
________________________________________________________
Pius
Ndegwa,
Ph.D.,
Chair
________________________________________________________
Craig
Frear,
Ph.D.
________________________________________________________
Troy
Peters,
Ph.D.
4. iii
ACKNOWLEDGMENT
I’d
like
to
thank
my
committee
members
Dr.
Pius
Ndegwa,
Dr.
Craig
Frear,
and
Dr.
Troy
Peters.
Dr.
Ndegwa:
thank
you
for
the
effort
you
put
into
my
written
thesis
and
your
continued
patience
and
support
to
get
this
thesis
right.
Dr.
Frear:
thank
you
for
a
very
interesting
thesis
topic
and
finding
financial
support
for
the
time
I
had
it.
Dr.
Peters:
thank
you
for
your
flexibility
in
this
process.
Thank
you
Dr.
Stockle
and
administrative
staff
at
Biological
Systems
Engineering
for
your
hard
work
and
diligence
to
direct
me
through
the
thesis
process.
Thanks
Jonathan
Lomber
for
your
help
in
the
lab.
Thank
you
Andgar
Corporation
in
part
for
your
financial
support.
Thanks
to
my
friends
and
mentors
in
Pullman
who
listened
to
me
talk
about
my
process
through
my
thesis;
I
wouldn’t
have
made
it
without
you.
And
thank
you
to
my
family.
I
appreciate
your
encouragement
and
honest
candor.
I
love
and
appreciate
you
all!
5. iv
METHANE
PRODUCTION
ANALYSIS
OF
INHIBITED
POULTRY
DIGESTION
EFFLUENT
AFTER
DILUTION
AND
AMMONIA
VOLATILIZATION
Abstract
by
Paul
Foster
Gamble,
M.S.
Washington
State
University
August
2015
Chair:
Pius
M.
Ndegwa
This
study
was
conducted
using
manure
waste
from
a
concentrated
animal
feeding
operation
(CAFO)
that
consisted
of
1.5
million
chicken
egg-‐laying
at
facility
in
Ohio
in
the
Mid-‐West
of
the
United
States,
which
operated
a
mesophilic,
plug
flow
anaerobic
digester
(AD)
to
handle
its
poultry
litter
waste.
The
AD
had
become
sour
(inhibited),
most
probably
due
to
elevated
levels
of
ammonia,
and
its
gas
production
had
dropped
to
40%
of
its
initial
gas
levels.
Economic
efficiencies
in
CAFOs
are
realized
through
integration
of
scale,
mechanization,
and
technology
in
order
to
produce
affordable
animal
products
for
consumption.
However,
as
CAFOs
continue
to
increase
in
size
and
concentrate
geographically,
animal
feeds
no
longer
comes
from
only
the
surrounding
land
but
some
have
to
be
imported.
The
imported
feeds
have
led
to
CAFOs
being
net
nutrient
positive
(difference
between
imported
nutrients
and
nutrients
used
within
the
CAFOs
after
nutrients
are
applied
on
available
land
at
desired
agronomic
rates).
Such
scenarios
heighten
environmental
concerns
if
these
excess
6. v
nutrients
leach
to
groundwater
or
run-‐off
to
surface
water
masses,
especially
if
they
are
not
properly
managed.
Traditionally,
poultry
CAFOs
dispose
of
their
manure
waste
via
either
land
application
or
export,
but
they
have
been
exploring
AD
as
an
alternative
option.
The
Ohio
poultry
manure
anaerobic
digester
(AD)
was
built
to
handle
its
poultry
litter
in
order
to
tap
into
AD’s
beneficial
attributes
including:
stabilization
and
reduction
of
manure
waste,
production
of
a
stable
organic
soil
conditioner
and/
or
liquid
fertilizer,
and
production
of
a
combustible,
renewable
biogas.
Yet
the
recycling
of
the
digester’s
effluent
back
into
the
digester
as
influent
led
to
the
persistence
of
ammonia,
a
known
inhibitor
of
digester
microbial
ecology
at
higher
levels.
The
goal
of
this
research
was
to
investigate
operation
restoration
of
this
sour
AD
via
two
treatments
at
various
dilutions:
1)
aeration
of
the
digester’s
ammonia-‐inhibited
contents,
and
2)
coupling
aeration
and
heat
treatment
of
the
digester’s
ammonia-‐inhibited
contents.
The
results
of
this
study
suggest
that
both
aeration
and
dilution
treatments
are
effective
methods
of
conditioning
inhibited
digester’s
effluent
and
thus
restoring
normal
operations
of
an
inhibited
digester.
7. vi
TABLE
OF
CONTENTS
ACKNOWLEDGEMENTS……………………………………………………………………………...
iii
ABSTRACT………………………………………………………………………………………………….
iv-‐v
LIST
OF
TABLES………………………………………………………………………………………….
viii
LIST
OF
FIGURES
………………………………………………………………………………….........
ix-‐x
DEDICATION………………………………………………………………………………………………
xi
CHAPTER
1
INTRODUCTION
AND
BACKGROUND……………………...……………………….……….......
1
1.1
Concentrated
Animal
Feeding
Operations
(CAFOs)………………………………
1
1.2
Purpose
of
CAFO
waste
handling…………………………………………………………
2
1.3
Known
Environmental
Effects
of
CAFOs………………………………………………
4
1.4
Effective
Land
Application…………………………………………………………………..
6
1.5
Anaerobic
Digestion
(AD)
in
CAFOs……………………………………………………..
6
CHAPTER
2
METHANE
PRODUCTION
ANALYSIS
OF
INHIBITED
POULTRY
DIGESTION
EFFLUENT
AFTER
DILUTION
AND
AMMONIA
VOLATILIZATION…………………
8
2.1
Abstract……………………………………………………………………………………………..
8
2.2
Introduction……………………………………………………………………………………….
9
2.3
Methods
and
Materials……………………………………………………………………….
12
2.3.1
Farm
Operation…………………………………………………………………………….
12
8. vii
2.3.2
Effluent
Used
In
Experiment…………………………………………………………..
13
2.3.3
Experimental
Design……………………………………………………………………..
13
2.3.4
Methane
Production
Analysis………………………………………………………...
14
2.3.5
Laboratory
Analysis………………………………………………………………………
15
2.4
Results
and
Discussion………………………………………………………………………..
16
2.4.1
Effects
of
Dilution
on
TS
and
VS
of
Influent……………………………………..
16
2.4.2
Initial
TAN-‐N
Levels
According
to
Effluent
Type………………………..........
16
2.4.3
Inhibition
Test……………………………………………………………………………….
18
2.4.4
Methane
Production
within
Treatments……………………………………........
23
2.4.5
Effect
of
Dilution
on
Specific
Methane
Yield…………………………………….
25
2.4.6
Effect
of
Treatment
on
Specific
Methane
Yield…………………………….......
26
2.4.7
Effect
of
Dilution
on
Volumetric
Methane
Yield………………………………
27
2.4.8
Effect
of
Treatment
on
Volumetric
Methane
Yield…………………………..
28
2.5
Conclusions………………………………………………………………………………………..
30
2.6
Recommendations………………………………………………………………………….......
31
2.7
References………………………………………………………………………………………….
32
9. viii
LIST
OF
TABLES
Table
2.1:
Basic
characteristics
of
treatment
samples
and
poultry
litter
used
in
this
study
(all
effluents
were
extracted
from
an
inhibited
digester
between
September
and
October,
2011)………………………….
13
Table
2.2:Effectiveness
of
dilution
on
total
solids
and
volatile
solids
distribution……………………………………………………………………………….
16
Table
2.3:
Characteristics
of
seed
and
effluent
samples
before
and
after
anaerobic
digestions
during
the
BMPs
determination…………………
17
Table
2.4:
Literature
values
for
poultry
manure
and
poultry
litter
bio-‐
methane
potentials……………………………………………………………………...
19
10. ix
LIST
OF
FIGURES
Figure
2.1:
The
experiment
consisted
of
three
treatments:
Aeration
Effluent
(AE),
Heat
and
Aeration
(HAE),
and
control
(Inhibited
Effluent
IE)
each
at
four
dilutions
(6%,
20%,
40%,
&
60%).
Acclimated
Seed
at
20%
by
volume
supplemented
with
4.45
g
chicken
litter
per
100
mL
substrate
was
used
as
the
seed
in
this
study…………………………………………..
14
Figure
2.2:
Concentrations
of
TAN
at
different
dilutions
of
the
treatment
samples
and
the
Seed…………………………………………………………………..
18
Figure
2.3:
Effect
of
dilution
of
inhibited
digester’s
effluent
on
TAN
and
specific
methane
yield………………………………………………………………….
20
Figure
2.4:
Specific
methane
yields
of
each
of
the
treated
effluents,
the
control
(inhibited
effluent),
and
the
Seed……………………………………..
24
Figure
2.5:
Volumetric
methane
yields
of
each
of
the
treated
effluents,
the
control
(inhibited
effluent),
and
the
Seed…................................................
25
Figure
2.6:
Effect
of
dilution
on
methane
yield
(same
letters
above
each
cluster
denote
statistical
similarity,
while
the
converse
is
also
true)……………………………………………………………………………………………
26
Figure
2.7:
Comparison
of
specific
methane
yields
across
treatments
(same
letters
above
the
clusters
denote
statistical
similarity,
while
the
converse
is
true;
Aeration
and
the
Seed
had
statistically
higher
specific
yield
than
the
Inhibited
Effluent
and
the
Heat
and
Aerated
11. x
Effluent)……………………………………………………………………………………...
27
Figure
2.8:
Comparison
of
volumetric
methane
yields
at
various
dilutions.……
28
Figure
2.9:
Effect
of
treatments
(aeration
or
combined
heating
and
aeration)
on
volumetric
methane
yield
compared
to
the
Seed
and
Inhibited
Effluent……………………………………………………………………………………...
29
12. xi
DEDICATION
This
thesis
is
dedicated
to
my
Grandparents:
Gene,
Katie,
Leonard,
and
Vera.
I
appreciate
your
love
of
goodness,
loyalty,
and
of
each
other
you
instilled
in
all
of
us.
I
hope
to
make
you
proud
in
this
life.
13. 1
Chapter
1.
Introduction
and
Background
1.1
Concentrated
Animal
Feeding
Operations
(CAFOs)
Concentrated
animal
feeding
operations
(CAFOs)
take
advantage
of
economies
of
scale
to
provide
various
animal
products
for
consumption
at
affordable
prices.
Between
1982
and
2002,
the
number
of
CAFOs
in
the
United
States
grew
by
approximately
230%.
In
addition
to
the
number
of
CAFOs
growth,
further
analysis
indicates
a
clear
trend
towards
geographic
concentration
of
animal
production,
and
more
animals
per
farm
(Williams,
Barker,
and
Sims,
1999;
Sims
et
al.,
2005;
Bradford
et
al.,
2008;
Mallin,
2000).
Similarly,
global
animal
inventory
has
increased,
as
has
global
demand
for
meat
products,
leading
to
an
increase
in
animal
production
worldwide
(Sims
et
al.,
2005).
The
poultry
industry,
specifically,
is
one
of
the
largest
and
fastest
growing
agro-‐based
industries
in
the
world
due
to
increasing
demand
for
meat
and
eggs.
In
the
U.S.
in
2008,
the
broiler
industry
accounted
for
8.8
billion
birds.
The
estimated
manure
production,
from
those
birds,
was
44.4
million
tons,
representing
2.2
million
tons
of
N,
0.7
million
tons
of
P,
and
1.4
million
tons
of
K
(Bolan
et
al.,
2010).
These
historic
trends,
therefore,
have
resulted
in
larger
quantities
of
manures
in
concentrated
regions,
which
cannot
be
utilized
locally
without
posing
serious
threats
to
the
environment
unless
active
advanced
management
practices
are
incorporated.
In
general,
CAFOs
have
become
net
positive
nutrient
producer
as
their
sizes
have
grown
requiring
the
need
to
import
feed
(Williams,
Barker,
and
Sims,
1999;
Collins,
Murphy,
and
Bainbridge,
2000).
This
in
turn
has
decoupled
manure
management
with
land
nutrient
14. 2
needs
because
nutrients
exceed
the
surrounding
lands’
ability
to
uptake
them.
In
other
words,
feed
is
drawn
from
a
wide
area
while
manure
distribution
is
limited
to
a
small,
local
landmass.
Without
proper
and
deliberate
management,
the
industry
risks
re-‐occurring
incidences
of
soil
accumulation
and
run-‐off
of
N,
P,
and
other
pollutants
(Thorne,
2007),
gaseous
ammonia
volatilization
(Sims
et
al.,
2005),
and
other
adverse
environmental
impacts.
1.2
Purpose
of
CAFO
waste
handling
The
balance
of
nutrients
in
terms
of
input,
export,
and
land
assimilation
is
the
basis
for
proper
nutrient
and
runoff
management
at
CAFOs.
The
ultimate
manure
management
goal
is
to
develop
and
practice
nutrient
handling
practices
that
prevent
diffuse
nutrient
pollution,
and
to
think
in
terms
of
farm
and
watershed
nutrient
balances
(Sims
et
al.,
2005).
Nutrient
Management
Plans
(NMPs)
are
an
example
of
accounting
for
CAFO
nutrients,
and
are
developed
considering
all
nutrient
input
sources
such
as
manure,
fertilizer,
lagoon
water,
and
well
water.
Additionally,
they
consider
soil
surface
nutrient
content,
nutrient
volatilization,
nutrient
mineralization
rates,
and
plant
uptake
(Bradford
et
al.,
2008).1
The
most
effective
way
to
handle
nutrients
associated
with
manures
is
to
not
produce
them
in
the
first
place.
The
first
line
of
attack,
therefore,
is
manipulation
of
diet
to
maximize
animal
uptake
and
thus
reduce
total
nutrient
production
in
manures
(Bradford
et
al.,
2008).
The
most
obvious
option
of
handling
excess
manure
nutrient
is
to
export
them,
and
1
NMPs
are
written
to
protect
surface
resources,
and
only
provide
limited
guidance
on
characterizing
and
protecting
ground
water
contamination
15. 3
this
approach
is,
in
general,
not
cost
effective.
In
some
cases,
however,
exporting
through
hauling
manure
waste
is
the
only
option
(Williams,
Barker,
and
Sims,
1999;
Kelleher
et
al.,
2002;
Sims
et
al.,
2005;
Liedl,
Bombardiere,
and
Chatfield,
2006;
Bradford
et
al.,
2008).
On
the
other
hand,
storage
of
manures
may
be
necessary
in
order
to
properly
handle
them
at
different
appropriate
periods.
Biological
processes
during
storage
are
continuous,
so
odors
and
other
gas
emissions
associated
with
the
anaerobic
conditions
of
the
piles
or
liquid
storages
are
constant
issues.
For
example,
if
litter
is
moist,
ammonia
is
emitted
from
the
production
or
storage
facility
while
if
the
litter
is
dry,
emissions
and
dust
particles
are
emitted
(Williams,
Barker,
and
Sims,
1999).
Whatever
type
of
storage
approach,
careful
management
practices
must
be
put
in
place.
Storage
lagoons
are
often
utilized
as
a
method
to
eliminate
nitrogen
through
volatilization
(Mallin,
2000).
Similar
to
watershed
science,
airshed
science
is
becoming
more
relevant
in
assessing
and
managing
the
effects
of
air
emissions
on
the
surrounding
environment
(Williams,
Barker,
and
Sims,
1999).
Volatilization
of
ammonia
from
storage
ponds
is
a
common
management
practice
to
reduce
an
operation’s
net
nitrogen
(Edwards
and
Daniel,
1992;
Burkholder
et
al.,
2007).
Once
the
ammonia
gas
volatilizes,
it
is
subsequently
deposited
through
wet
and
dry
adsorption
or
may
be
oxidized
to
nitrates.
Such
ammonia
volatilization
can
lead
to
10-‐50%
external
nitrogen
loading
(Williams,
Barker,
and
Sims,
1999).
Similar
to
the
municipal
wastewater
industry,
volatilization
of
ammonia
to
ammonia
gas
and
the
conversion
of
ammonia
to
nitrogen
gas
are
some
of
the
main
strategies
to
reduce
nitrogen
in
the
wastewater
(Williams,
Barker,
and
Sims,
1999).
Yet
the
16. 4
method
is
not
without
its
flaws;
ammonia
emissions
have
an
inverse
relationship
between
source
distance
and
deposition
(Angus,
Hodge,
and
Sutton,
2006).
Thus,
ammonia
volatilization
simply
shifts
it
from
a
point
source
to
a
diffuse
source
of
pollution.
Storage
lagoons
are
not
designed
to
sustain
major
natural
disaster
events,
and
massive
one-‐time
pollution
events
have
resulted
in
over-‐flow
incidents,
spilling
manures
into
waterways
(Mallin,
2000;
Burkholder
et
al.,
2007).
Other
considerations
to
make
when
considering
storage
effectiveness
are
depth
of
the
water
table,
soil
structure
and
infiltration
rates,
and
CAFO
drainage
patterns
(Bradford
et
al.,
2008).
Once
the
decision
to
store
manure
is
made,
then
effective
land
application
of
the
stored
manure
becomes
the
focal
point.
1.3
Known
Environmental
Effects
of
CAFOs
In
1997,
the
US
Senate
Committee
on
Agriculture,
Nutrition,
and
Forestry
noted
that
pollutants
from
CAFOs
impaired
more
miles
of
US
rivers
than
all
other
industry
sources
and
municipal
sewers
combined
(Williams,
Barker,
and
Sims,
1999).
The
U,S.
animal
agriculture
accounted
for
133
million
tons
of
manure
per
year
(dry
weight),
representing
13-‐fold
more
solid
waste
than
human
sanitary
waste
production
(Burkholder
et
al.,
2007).
Environmental
contamination
is
known
to
occur
when
land
application’s
sole
purpose
is
manure
disposal
rather
than
application
in
accordance
with
fertilizer
or
soil
amendment
agronomic
rates.
The
other
management
practice
that
contributes
to
polluting
waterways
is
application
of
manures
in
excess
or
under
poor
management
conditions
(Edwards
and
17. 5
Daniel,
1992;
Williams,
Barker,
and
Sims,
1999;
Burkholder
et
al.,
2007).
Over
application
leads
to
either
migration
of
nutrients,
causing
problems
elsewhere,
or
to
nutrient-‐
accumulation
if
they
don’t
migrate
(Edwards
and
Daniel,
1992;
Williams,
Barker,
and
Sims,
1999).
Proper
manure
management
should
account
for
soil
properties,
contaminant
properties,
hydraulic
loading
characteristics,
and
crop
management,
all
of
which
determine
the
magnitude
of
contaminant
run-‐off
(Burkholder
et
al.,
2007).
Nitrogen
is
mobile
in
both
ammonium
and
nitrate
forms,
and
the
impacts
on
surface
water
sources
and
wildlife
have
been
well
documented
in
many
agricultural
areas
in
the
U.S.
(Burkholder
et
al.,
2007).
Ammonia
originating
in
CAFOs
may
end
up
be
being
toxic
to
many
organisms
through
a
variety
of
mechanisms
(Mallin,
2000),
the
most
common
being
eutrophication.
Eutrophication
is
the
decrease
in
dissolved
oxygen
due
to
bacteria
oxidation
of
fecal
or
plant
matter,
which
has
obvious
repercussions
to
aquatic
species
(Williams,
Barker,
and
Sims,
1999;
Kelleher
et
al.,
2002).
Algal
blooms
usually
account
for
the
plant
matter
in
waterways,
whose
concentrations
can
be
toxic
to
species.
Additionally,
settling
of
algal
blooms
after
death
consumes
all
oxygen
as
bacteria
degrade
the
algal
matter.
Fecal
matter
has
the
same
bacterial
effect
(Mallin,
2000).
Impacts
of
waste
from
CAFOs
have
been
documented
as
far
as
30
km
downstream
from
point
of
entry
into
surface
waters
(Burkholder
et
al.,
2007).
In
addition
to
macro-‐nutrients,
there
are
a
number
of
compounds
and
bacteria
that
are
also
associated
with
CAFOs:
hydrogen
sulfide
and
ammonia
gas
can
pose
health
threats
to
farm-‐
workers
and
animals
(Williams,
Barker,
and
Sims,
1999);
endocrine
and
reproductive
18. 6
systems
disrupters
are
found
in
feedlot
effluents
(Whitehead
et
al.,
2004);
pathogens
are
a
concern
after
raw
deposition
(El-‐Hadidi
and
Al-‐Turki,
2007);
and
the
use
of
nontherapeutic
anti-‐microbial
growth
promoters
has
intensified
the
risk
for
more
resistant
microorganisms
(Burkholder
et
al.,
2007;
Gilchrist
et
al.,
2007)
.
1.4
Effective
Land
Application
Most
litter
produced
from
poultry
operations
is
land
applied
(Williams,
Barker,
and
Sims,
1999;
Bolan
et
al.,
2010).
Land
application
is
an
effective
means
of
manure
management
when
method
of
application,
timing
of
application,
and
rate
of
application
are
considered.
Yet
it
is
difficult
to
optimize
agronomic
rates
due
to
the
heterogeneous
nature
of
manure
as
opposed
to
commercial,
inorganic
fertilizers;
so
manures
are
often
applied
in
excess
to
compensate
for
the
variability.
Nevertheless,
organic
material
in
manures
offer
positive
benefits
to
soils.
They
are
a
valuable
source
of
plant
nutrients,
increased
soil
organic
matter,
increased
water-‐holding
capacity,
improved
oxygen
diffusion
rate,
and
aggregated
stability
in
soils.
Numerous
crops
have
thrived
when
the
soil
salinity
concentrations
didn’t
get
too
high
(Bolan
et
al.,
2010).
Although
land
application
has
its
place
in
CAFO
nutrient
management,
the
poultry
industry’s
environmental
impacts
have
stimulated
interest
in
cleaner
and
safer
disposal
options
(Kelleher
et
al.,
2002).
1.5
Anaerobic
digestion
(AD)
in
CAFOs
Anaerobic
digestion
is
a
technology
utilized
at
CAFOs
for
numerous
reasons,
but
the
main
ones
are
that
the
process:
stabilizes
and
reduces
manure
waste,
produces
a
stable
organic
19. 7
soil
conditioner
and/
or
liquid
fertilizer,
and
produces
a
combustible,
renewable
biogas
(Sakar,
Yetilmezsoy,
and
Kocak,
2009;
Zhang
et
al.,
2011).
Additionally,
it
is
an
effective
method
of
sanitation
through
pathogen
reduction
via
substrate
consumption
(Yongabi,
Harris,
and
Lewis,
2009).
This
technology,
however,
has
not
received
wide-‐spread
adoption
most
probably
because
of
unfavorable
economics,
low
biogas
yields
for
litter-‐
based
systems,
and
technical
operational
difficulties
(Williams,
Barker,
and
Sims,
1999).
Nutrient
recovery
(more
specifically
ammonia
volatilization)
is
a
good
tool
for
balancing
of
nutrients,
beyond
its
effect
on
the
AD
process.
Nutrient
recovery
extracts
nutrients
from
the
AD
effluent,
which
alleviates
the
inhibition
associated
with
TAN
accumulation.
Simultaneously,
nutrient
recovery
acts
as
a
nutrient
extraction
process,
both
reducing
the
amount
of
nitrogen
to
be
land
applied
while
also
producing
a
nitrogen
product
that
can
be
exported.
The
ability
to
export
nutrients
enables
CAFOs
the
potential
to
increase
animal
density
(animals
per
unit
area).
In
this
context,
AD
as
a
technology
reaches
far
beyond
its
ability
to
reduce
the
mass
of
solid
waste
or
produce
a
combustible
biogas;
it
is
a
management
practice
with
the
capability
to
regulate
the
macronutrients
applied
to
a
farm’s
footprint,
and
to
a
watershed
(Sims
et
al.,
2005).
20. 8
Chapter
2:
Methane
Production
Analysis
of
Inhibited
Poultry
Litter
Digestion
Effluent
after
Dilution
and
Ammonia
Volatilization
2.1
Abstract
This
study
was
conducted
using
inhibited
poultry
waste
from
a
1.5
million
chicken
egg
laying
facility
in
Ohio
in
the
Mid-‐West
of
the
United
States,
which
operated
a
mesophilic,
plug
flow
anaerobic
digester
(AD)
to
handle
its
poultry
litter
waste.
After
two
years
of
re-‐
circulating
the
AD’s
effluent
as
influent,
gas
production
dropped
to
40%
of
initial
gas
levels
with
effluent
accumulating
in
excess
of
8,000
mg
total
ammonia
nitrogen
(TAN)/L.
Tests
were
conducted
to
condition
the
inhibited
digester’s
content
via
three
treatments:
aeration
of
effluent
(AE),
combined
heat
and
aeration
of
effluent
(HAE),
and
dilution
(60%,
40%,
20%
and
6%).
The
effects
of
these
treatments
were
determined
using
bio-‐methane
potentials
(BMPs)
after
each
treatment.
The
specific
methane
yield
of
the
IE6%
at
57
mL
CH4/g
VSin
indicated
that
digester’s
contents
were
significantly
inhibited.
Conversely,
the
IE
diluted
to
80%
(referred
to
as
the
Seed)
achieved
a
specific
methane
yield
of
1,053
mL
CH4/g
VSin
(1.68%
TS,
2,017
mg
TAN/L).
Dilution
of
the
effluent
treatments,
in
general,
enhanced
the
specific
methane
yield
but
not
the
volumetric
methane
yield.
The
AE
treatment
resulted
in
higher
specific/
volumetric
methane
yields
than
both
the
HAE
and
IE
treatments.
The
results
of
this
study
suggest
that
both
aeration
and
dilution
treatments
are
effective
methods
of
conditioning
inhibited
digester’s
effluent
and
thus
restoring
normal
operations
of
an
inhibited
digester.
21. 9
2.2
Introduction
Concentrated
animal
feeding
operations
(CAFOs)
have
become
the
norm
for
the
United
States’
livestock
and
poultry
industries
and
have
advanced
economic
efficiencies
by
integrating
scale,
mechanization,
and
technology
into
their
operations.
But
with
this
economy
of
scale,
operational
dilemmas
such
as
manure
management
and
nutrient
run-‐off
have
become
more
poignant
(Williams,
Barker,
and
Sims,
1999;
Sims
et
al.,
2005).
As
a
result,
land
application
of
manures
has
had
to
consider
soil
surface
nutrient
content,
nutrient
volatilization,
nutrient
mineralization
rates,
and
plant
uptake
(Bradford
et
al.,
2008).
Similarly,
resources
that
have
not
been
traditionally
limited
including
energy
usage,
transportation
fuels,
and
water,
require
more
informed
consideration.
As
CAFOs
have
increased
in
size
and
concentrated
geographically,
animal
feeds
no
longer
comes
from
only
the
surrounding
land
but
some
have
to
be
imported.
This
leads
into
CAFOs
being
nutrient
net
positive
(difference
between
imported
nutrients
and
nutrients
used
within
the
CAFOs
after
nutrients
are
applied
on
available
land
at
desired
agronomic
rates)
(Williams,
Barker,
and
Sims,
1999;
Collins,
Murphy,
and
Bainbridge,
2000).
Traditionally,
CAFOs
have
land-‐applied
its
manures/
litter
(Bradford
et
al.,
2008;
Williams,
Barker,
and
Sims,
1999;
Mallin,
2000;
Kelleher
et
al.,
2002).
Whereas
dairy
CAFOs
have
been
more
apt
to
apply
on-‐site
handling
technologies
such
as
anaerobic
digestion,
poultry
operations
have
been
more
reluctant
to
add
water
to
solid
manure
because
it
adds
complexity
to
the
operation.
This
technology,
therefore,
is
more
common
in
dairy
and
swine
CAFOs,
which
produce
liquid
manures
or
manure
slurries.
22. 10
Perhaps
more
indicative
for
the
lack
of
historic
widespread
utilization
of
anaerobic
technology
application
to
poultry
manure
is
unfavorable
economics
and
the
inhibition
of
digester
performance
related
to
the
manure’s
high
ammonia
content
(Williams,
Barker,
and
Sims,
1999).
While
high
ammonia
is
not
ideal
for
anaerobic
digestion,
there
are
a
number
of
reasons
to
develop
the
ability
to
overcome
the
inhibitory
dilemmas
such
as
low
gas
production,
water
scarcity,
bio-‐nutrient
generation,
and
alleviation
of
pollution
(Kelleher
et
al.,
2002).
Dilution
and
C:N
adjustments
are
the
simplest
means
to
alleviate
ammonia-‐inhibition.
Bujoczek
et
al.
(2000)
noted
that
the
common
approach
traditionally
was
to
dilute
manure
to
0.5%–3%
solids,
but
the
resulting
large
volume
of
waste
makes
this
method
economically
unattractive.
Nielsen
and
Angelidaki
(2008)
also
stabilized
an
ammonia-‐
inhibited
digester
through
dilution.
Resch
et
al.
(2011)
recommended
a
C:N
ratio
between
16:1-‐25:1,
and
promoted
adjusting
the
C:N
ratio
in
high
protein
substrates
to
overcome
inhibition.
Co-‐digestion,
through
C:N
ratio
adjustment,
has
also
has
shown
promising
results
(Yangin-‐Gomec
and
Ozturk,
2013;
Y.
Zhang
et
al.,
2011;
Sharma,
Espinosa-‐Solares,
and
Huber,
2013).
Another
approach
for
increased
process
stabilization
is
ammonia
volatilization.
A
number
of
experiments
have
examined
various
forms
of
ammonia
volatilization
for
improved
control
and
enhancement
of
biogas
production.
Zhang
et
al
(2012)
pretreated
piggery
wastewater
by
increasing
the
pH
with
sodium
hydroxide
and
achieved
methane
production
23. 11
of
0.75
CH4/L
d
and
0.57
CH4/L
d
at
pH
of
9.5
and
10,
respectively,
an
increase
over
the
control
of
0.23
CH4/L
d.
Using
biogas
as
the
stripping
medium
within
a
digester,
Abouelenien
et
al.
(2010)
were
able
to
extract
65.6%
of
total
N
as
ammonia
while
Serna-‐
Maza,
Heaven,
and
Banks
(2014)
achieved
48%
TAN
removal
at
70°C
and
pH
10.
Resch
et
al.
(2011)
increased
COD
degradation
by
55%
when
TKN
was
decreased
during
digestion
from
7.5
to
4.0
g
kg-‐1.
Post-‐digestion
ammonia
volatilization
also
has
been
studied
as
a
nutrient
removal
method
for
digester
effluent
(Guštin
and
Marinšek-‐Logar,
2011;
Rico,
García,
and
Rico,
2011;
Gangagni
Rao,
Gandu,
and
Swamy,
2012).
Very
little
work
has
been
done
to
examine
the
effects
of
similar
conditioning
of
ammonia-‐
inhibited
anaerobic
digester’s
effluent
in
order
to
resuscitate
a
sour
digester
under
the
stipulation
that
the
effluent
is
reused
either
in
part
or
as
the
sole
feed
substrate.
Lei
et
al.
(2007)
used
ammonia
stripping
via
air
stripping
and
pH
adjustment
to
pretreat
effluent
for
disposal,
but
were
less
concerned
with
the
treated
effluent’s
performance
when
recycled
back
into
the
digestion
system.
Little
else
has
been
examined
to
determine
methods
of
alleviating
chronically
ammonia-‐inhibited
effluent
for
reuse
in
the
digester.
This
experiment
differs
from
previous
work
in
that
it
examined
treatments
to
a
chronically
inhibited
digester
as
opposed
to
the
majority
of
inhibition
studies
that
slowly
increased
the
amount
of
ammonia
to
inhibitory
levels
(Benabdallah
El
Hadj
et
al.,
2009;
Lay,
Li,
and
Noike,
1998;
Lü
et
al.,
2013;
Kayhanian,
1994;
Krylova
et
al.,
1997).
The
goal
of
this
research
was
to
investigate
operation
restoration
of
a
sour
anaerobic
digester
via
two
treatments
at
various
dilutions:
1)
aeration
of
the
digester’s
ammonia-‐inhibited
contents,
and
2)
coupling
aeration
and
heat
treatment
of
the
digester’s
ammonia-‐inhibited
contents.
24. 12
2.3
Methods
and
Materials
2.3.1
Farm
Operation
A
1.5
million
chicken
egg
laying
operation
in
Fort
Recovery,
OH,
United
States,
installed
an
axial-‐mixed,
mesophilic,
plug-‐flow
anaerobic
digester
(DVO
Inc.,
Chilton
WI)
for
production
of
combined
heat
and
power
on
the
farm.
Hydraulic
retention
time
(HRT)
of
the
digester
was
30-‐35
days.
A
mix
of
poultry
litter
(PL),
egg
wash
water,
and
recycled
effluent
served
as
the
digester’s
influent
or
feed
substrate.
The
commercial
digester
during
the
period
of
study
was
in
a
state
of
inhibition
probably
due
to
being
overloaded
with
ammonia.
Total
ammonia
nitrogen
(TAN)
had
accumulated
to
8,000
mg/L
within
the
digester,
while
biogas
had
dropped
to
40%
of
initial
production
levels
after
two
years
of
operation.
Addition
of
carbon
had
been
tried
as
a
means
to
reduce
inhibition,
but
was
not
a
sustainable
option
due
to
the
lack
of
a
long-‐term,
viable
source.
A
subsequent
approach
was
to
centrifuge
out
most
of
the
suspended
solids
and
then
aerate
and
partially
strip
the
effluent
of
ammonia,
producing
an
aerated
effluent
(AE)
that
was
being
used
as
new
recycle
water.
The
process
consisted
of
98%
suspended
solids
removal
with
a
decanting
centrifuge,
followed
by
a
12-‐hour
aeration
within
an
aeration
pit
fitted
with
12
diffusers
resulting
in
an
overall
aeration
rate
of
250
cfm.
25. 13
2.3.2
Effluent
Used
in
Experiment
Laboratory
experiments
utilized
farm
poultry
litter
(PL)
as
well
as
three
effluent
treatments,
either
sourced
from
treatments
at
the
farm
or
produced
within
the
laboratory.
The
treatments
in
the
laboratory
included
either
aeration
(AE)
or
combined
heating
and
aeration
(HAE)
of
the
inhibited
effluents
(IE).
All
samples
obtained
from
the
farm
were
composite,
random
samples
shipped
overnight
and
stored
at
4°C
until
use.
Table
2.1
shows
the
descriptions
and
properties
of
the
three
effluents
and
the
poultry
litter.
Table
2.1:
Basic
characteristics
of
treatment
samples
and
poultry
litter
used
in
this
study
(all
effluents
were
extracted
from
an
inhibited
digester
between
September
and
October,
2011).
2.3.3
Experimental
Design
Biological
methane
potential
(BMP)
studies
were
conducted
to
determine
the
degree
to
which
both
recycle
rate
and
treatment
of
recycle
effluent
impacts
inhibition
as
measured
by
biogas
production.
The
study
consisted
of
three
treatments:
Inhibited
Effluent
(IE),
Treatment(
Effluent(Samples/(
Poultry(Litter Eflluent(Description TS VS VS/TS TAN;N
%(decrease(TAN(
from(Inhibited(
Effluent
Inhibited)Effluent
Effluent)from)poultry)digester)
process:)30935)day)HRT,)C:N) 5.219)±0.022 3.088)±0.0161 59.16)±0.2678 8661)±3.888 9
Aerated)Effluent
)Centrifuged)effluent)treated)in)
aeration)chamber)adjoined)to)
poultry)digester)with)an)HRT)of)
12)hours,)at)an)aeration)rate)of)
250)cfm 4.069)±0.3269 2.257)±0.01842 55.67)±3.865 6307)±25.66 27.2%
Heated)and)
Aerated)Effluent
Trial)1)Effluent)aerated)in)lab)
for)8)hrs)at)55°)C)at)aeration)
rate)of)1)L)air)/)min/)L)effluent 4.625)±0.005888 2.57)±0.002988 55.57)±0.1236 3917)±14.74 54.8%
Poultry)Litter
Ohio)egg)laying)operation.))
Mostly)manure)with)some)
feathers)and)egg)shells 53.09)±4.091 36.28)±4.153 68.2)±2.604
26. 14
Aeration
Effluent
(AE),
and
Heat
and
Aeration
Effluent
(HAE)
each
with
four
dilutions
(6%,
20%,
40%,
&
60%)
as
outlined
in
Figure
2.1.
Acclimated
effluent
was
used
for
“seed”
and
represented
20%
of
the
flask
volume
(4.45
g
of
chicken
litter
was
added
per
100
mL
of
solution).
Dilution
values
were
chosen
to
straddle
4
g/L
TAN,
which
is
the
accepted
threshold
of
TAN
concentration
for
ammonia-‐inhibited
digesters
(Hao
et
al.,
2013;
Smith
et
al.,
2014;
Angenent,
Sung,
and
Raskin,
2002;
Westerholm
et
al.,
2011;
Zhang,
Yuan,
and
Lu,
2014;
Westerholm
et
al.,
2011).
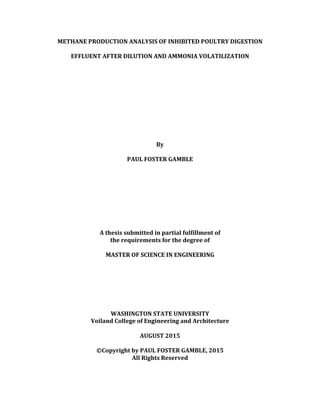
Figure
2.1:
The
experiment
consisted
of
three
treatments:
Aeration
Effluent
(AE),
Heat
and
Aeration
(HAE),
and
control
(Inhibited
Effluent,
IE)
each
at
four
dilutions
(6%,
20%,
40%,
&
60%).
Acclimated
seed
at
20%
by
volume
supplemented
with
4.45
g
chicken
litter
per
100
mL
substrate
was
used
as
the
seed
in
this
study.
2.3.4
Methane
Production
Analysis
A
modified
BMP
outlined
in
Frear
et
al.
(2011)
was
completed
using
a
AER-‐200
respirometer
(AER-‐200,
CES
Inc.,
USA).
Either
250
or
125
mL
bottles
(depending
on
27. 15
availability)
were
filled
with
prescribed
treatment
substrate,
and
the
headspace
(20%
of
bottle
volume)
was
purged
with
nitrogen
gas
for
10
minutes.
Potassium
hydroxide
was
used
in
solution
as
a
scrubbing
medium
to
purify
non-‐methane
biogas
by
adsorbing
carbon
dioxide
and
hydrogen
sulfide.
Homogenous
mixing
was
provided
with
magnetic
stirring
bars,
and
mesophilic
temperatures
were
maintained
through
submersing
the
digestion
bottles
in
a
temperature
controlled
water
bath
at
35°C.
Methane
gas
production
was
automatically
logged
in
a
computer
every
5
min.
All
tests
were
conducted
in
either
triplicate
or
duplicate
and
were
terminated
once
methane
production
ceased,
which
was
between
30
and
45
days.
2.3.5
Laboratory
Analysis
The
laboratory
analyses
for
the
parameters
listed
below
were
conducted
using
either
Standard
Methods
(APHA,
2005,
particular
method
given
in
parentheses)
or
standard
Equipment
as
follows:
total
solids
(TS,
2540B),
volatile
solids
(VS,
2540E),
pH
(AB
15,
Accumet
Basic),
and
Total
Ammonia
Nitrogen
(TAN)
(Tecator
2300
Kjeltec
Analyzer,
Eden
Prairie,
MN,
USA;
4500-‐NorgB;
4500NH3BC).
28. 16
2.4
Results
and
Discussion
2.4.1
Effects
of
Dilution
on
TS
and
VS
of
Influent
Table
2.2
represents
the
characteristics
of
samples
of
each
treatment
after
dilution.
The
nearly
constant
ratio
of
the
VS
to
TS
ratio
after
dilution
indicates
evenly
distributed
VS
and
TS,
which
suggested
that
the
dilution
for
all
samples
were
accomplished
successfully.
The
TS
of
the
samples,
however,
were
higher
compared
to
the
TS
of
inhibited
effluent
due
to
the
addition
of
supplemental
solid
poultry
litter
to
each
of
the
other
samples.
Table
2.2:
Effectiveness
of
dilution
on
total
solids
and
volatile
solids
distribution.
2.4.2
Initial
TAN-‐N
Levels
According
to
Effluent
Type
The
experimental
values
of
TAN
for
each
treatment
sample
were
staggered
and
straddled
the
4,000
mg/L
(Table
2.3),
which
is
the
often
cited
threshold
level
of
ammonia-‐inhibited
anaerobic
digestion
(Hao
et
al.,
2013;
Smith
et
al.,
2014;
Angenent,
Sung,
and
Raskin,
2002;
Westerholm
et
al.,
2011;
Zhang,
Yuan,
and
Lu,
2014;
Westerholm
et
al.,
2011).
In
general,
Treatment Dilution TS
(%) VS
(%) VS/TS
(%/%)
Seed Seed 1.682±0.33 1.134±0.15 62.82±2.53
60% 2.818±0.54 1.732±0.46 60.89±4.49
40% 4.744±0.42 3.058±0.41 64.27±3.01
20% 5.591±0.14 3.515±0.11 62.86±0.60
6% 5.918±0.72 3.671±0.56 61.81±2.146
60% 2.672±0.05 1.622±0.05 60.45±0.69
40% 3.727±0.18 2.275±0.15 60.69±0.75
20% 4.594±0.08 2.803±0.04 60.9±0.19
6% 4.826±0.36 2.9±0.26 60.07±1.01
60% 2.452±0.03 1.431±0.03 58.61±0.77
40% 3.507±0.01 2.038±0.00 58.19±0.82
20% 4.624±0.23 2.698±0.19 57.9±1.24
6% 5.148±0.28 3.007±0.23 57.93±0.89
Inhibited
Effluent
Aerated
Effluent
Heated
and
Aerated
Effluent
29. 17
the
concentrations
of
TAN
increased
during
anaerobic
digestions/
incubation,
during
determination
of
BMPs,
presumably
following
mineralization
of
organic
nitrogen
to
TAN.
Table
2.3:
Characteristics
of
seed
and
effluent
samples
before
and
after
anaerobic
digestions
during
the
BMPs
determination.
Figure
2.2
shows
the
levels
of
average
initial
TAN
for
all
samples
at
different
dilution
levels.
Heat
and
Aeration
Effluent
(HAE)
had
significantly
less
TAN
than
the
Aeration
Effluent
(AE)
or
the
Inhibited
Effluent
(IE).
The
AE
process
reduced
the
initial
TAN
levels
of
the
IE
by
approximately
27%,
while
the
HAE
process
reduced
the
IE
by
approximately
55%,
which
was
almost
double
that
by
AE
process
only.
Treatment Dilution TAN-‐N
Initial
(mg/L) TAN-‐N
Final
(mg/L) %
Increase
Seed Seed 2017±55.14 2722±449.3 34.93%
60% 3835±27.33 4169±552 8.70%
40% 5413±209.50 6278±94.4 15.98%
20% 7141±126.60 8061±63.15 12.88%
6% 8141±116.20 8756±590.3 7.55%
60% 3301±74.35 4297±287 30.16%
40% 4655±51.65 5698±187.5 22.41%
20% 5918±128.90 7065±122.4 19.38%
6% 6466±27.24 7811±141.4 20.81%
60% 2861±59.09 3302±22.98 15.42%
40% 3626±41.20 4245±147.8 17.06%
20% 4137±76.19 5118±136.1 23.71%
6% 4525±100.30 5358±617.7 18.40%
Inhibited
Effluent
Aerated
Effluent
Heated
and
Aerated
Effluent
30. 18
Figure
2.2:
Concentrations
of
TAN
at
different
dilutions
of
the
treatment
samples
and
the
Seed.
2.4.3
Inhibition
Test
This
experiment
was
conducted
to
test
if
either
the
aeration
treatment
or
combined
heat
and
aeration
treatment
of
effluent
from
a
sour,
full-‐scale
anaerobic
digester
could
restore
the
digester
to
normal
operation.
The
first
task
was
to
establish,
in
the
lab,
whether
the
effluent
that
originated
from
the
full-‐scale
digester
was
indeed
inhibited.
The
Inhibited
Effluent
(IE)
diluted
at
6%
(IE6)
was
used
in
this
test
to
mimic
the
inhibited
conditions
of
the
full-‐scale
digester.
Table
2.4
presents
some
typical
values
of
poultry
litter
BMPs
for
comparison.
At
5.9%
TS,
IE6
had
a
specific
yield
of
57
mL
CH4/
g
VSin
at
a
TAN
value
of
8,141
mg/L,
which
was
significantly
lower
than
most
literature
BMPs,
confirming
that
the
effluent
was
indeed
from
an
inhibited
digester.
The
seed
BMP,
on
the
other
hand,
indicated
substantially
higher
values
of
specific
methane
yield
(1053
mL
CH4/g
VSin,
1.68%
TS,
2017
mg
TAN/
L)
than
the
literature
values
listed
in
0 20 40 60 80
0
2000
4000
6000
8000
10000
Dilution Rates
TAN-N(mg/L)
Inhibited Effluent
Aerated
Heat and Aeration
Seed
31. 19
Table
2.4.
The
gas
production
of
an
uninhibited
system
is
evidently
significantly
less
than
the
gas
production
from
that
of
an
inhibited
substrate
once
the
inhibition
is
alleviated.
Furthermore,
the
yield
may
be
a
function
of
both
the
time
the
substrate
was
under
inhibition,
and
the
extent
of
inhibition
mitigation
during
subsequent
treatment.
The
latter
effect
is
clearly
illustrated
in
Figure
2.3.
Table
2.4:
Literature
values
for
poultry
manure
and
poultry
litter
bio-‐methane
potentials.
Specific
Methane
Yield
Description
Source
or
reference
140
mL
CH4/
g
VSin
Self-‐mixed
anaerobic
digester,
poultry
litter.
10%
TS,
25
day
HRT
Gangagni
Rao
et
al.
(2013)
160
mL
CH4/
g
VS
reduced
3.5
kg
VS/
m3/day
13
day
HRT
Gangagni
Rao
et
al.
(2011)
245
mL
CH4/g
VSin
and
372
mL
CH4/g
VSin
29
day
HRT,
4%
VS
and
12
day
HRT,
1%
VS,
respectively
Webb
and
Hawkes
(1985)
320
mL
CH4/g
VSin
TAN
2,830
mg/L,
thermophilic
CSTR
Niu
et
al.
(2014)
195
and
157
mL
CH4/
g
VSin
Batch
initial
pH
8,
55°C;
treated
poultry
manure
and
mixture
treated
and
non-‐
treated
manure,
respectively
Abouelenien
et
al.
(2010)
31
mL
CH4/
g
VSin
Sequential
batch
experiment
to
test
acclimated
bacterial
performance
in
high
TAN
of
8-‐14
g-‐N
kg-‐1
Abouelenien
et
al.
(2009)
350–400
mL
CH4/g
VSinat
TAN
lower
than
5,000
mg/L;
300
mL
CH4/g
VSin
at
TAN
of
10,000
mg/L;
complete
inhibition
at
TAN
16,000
mg/L
12-‐L,
mesophilic
CSTR.
30-‐
day
HRT
Niu
et
al.
(2013)
32. 20
Figure
2.3:
Effect
of
dilution
of
inhibited
digester’s
effluent
on
TAN
and
specific
methane
yield.
Whereas
the
6%
dilution
in
the
IE
treatment
was
substantially
inhibited,
the
seed
treatment
that
was
80%
diluted
and
20%
acclimated
seed
(IE)
achieved
substantially
higher
methane
yields
(per
g
VSin)
than
those
observed
in
previous
BMPs
studies
of
poultry
manure
(Table
2.4).
These
results
agree
with
the
conclusions
of
Chen
et
al
(2008),
which
also
noted
BMP
values
vary
substantially
due
to
differences
in
the
consortium
of
anaerobic
microorganisms
and
substrate
composition.
In
general,
however,
the
higher
BMP
values
observed
with
inhibited
digestion
systems
may
be
attributed
to
proper
seed
acclimation,
VFA
accumulation,
and
changes
in
Archea
metabolic
pathways.
Early
inhibition
studies
set
the
tolerance
for
acclimated
Archea
at
4
g/L
TAN
(Angelidaki
I.,
Ellegaard
L.,
Ahring
B.
K.,
1993),
while
similar
studies
noted
lack
of
inhibition
of
acclimated
bacteria
that
were
7-‐10
times
higher
in
NH3
tolerance
than
studies
that
didn’t
use
a
seed
acclimated
to
the
substrate
(Hansen,
Angelidaki,
and
Ahring
1998).
Similarly,
anaerobic
33. 21
systems
have
experienced
less
inhibition
after
extended
periods
of
operations,
indicating
microbial
adaptation
to
inhibitory
conditions
(Wang,
Hovland,
and
Bakke
2013).
Abouelenien,
Nakashimada,
and
Nishio
(2009)
further
identified
the
effectiveness
of
acclimated
seed
bacteria
by
conducting
nine
sequential
batch
studies,
where
a
portion
of
each
batch
was
added
to
the
next
as
seed.
Biogas
continued
to
increase
even
as
the
ammonia
concentration
increased.
Other
research
also
indicated
that
AD
systems
that
function
in
higher
TAN
levels
benefit
from
the
increased
buffering
capacity
associated
with
the
ammonium
ion
(Procházka
et
al.
2012).
The
Seed
in
this
study
was
effluent
from
a
digester
system
operating
for
two
years
under
inhibitory
conditions
being
loaded
with
the
poultry
litter
and
recycled
effluent
substrates
used
in
the
study,
and
therefore,
can
be
considered
acclimated.
There
is
also
evidence
in
the
literature
that
supports
this
study’s
elevated
methane
production
based
on
the
accumulation
of
volatile
fatty
acids
(VFA).
Wilson
et
al.
(2013)
reported
that
acclimated
bacteria
achieved
similar
rates
of
hydrolysis
at
5
g/L
TAN
to
the
baseline
values,
confirming
that
hydrolysis
isn’t
rate
limiting
in
TAN
inhibited
digestion
systems.
Elevated
ammonia
levels
are
well
documented
to
accumulate
VFA
(Resch
et
al.
2011),
with
longer
chain
VFA-‐
propionic,
butyric
and
valeric
acids,
having
more
elevated
levels
in
the
more
highly
inhibited
systems
(Poggi-‐Varaldo
et
al.
1997).
Other
studies
indicated
VFA
accumulation
at
higher
TAN
levels
(Bruni
et
al.
2013;
Niu
et
al.,
2014).
Niu
et
al.
(2013)
conducted
a
study
in
which
they
established
BMPs
for
a
chicken
manure
feedstock
at
TAN
concentrations
lower
than
5,000
mg/L,
then
increased
TAN
to
extreme
inhibitory
levels
(16,000
mg
TAN/L),
and
finally
diluted
the
substrate
after
the
extreme
34. 22
inhibitory
levels
to
4,000
mg
TAN/L.
The
initial
BMP
was
350–400
mL
biogas/g
VSin;
the
process
was
completely
inhibited
at
the
extreme
TAN
levels;
but
achieved
a
value
of
500
mL
biogas/g
VSin
after
dilution.
Similar
to
this
study,
the
Niu
et
al.
(2013)
study
demonstrated
an
increased
yield
potential
of
previously
inhibited
substrate
once
inhibitory
characteristics
are
alleviated.
Niu
et
al.
(2014)
noted
that
prolonged
accumulation
of
TAN
(over
6,000
mg/L)
resulted
in
elevated
levels
of
VFA
accumulation
in
the
digester
system
of
25,000
mg/L.
This
result
corroborates
the
potential
for
an
inhibited
system
to
accumulate
VFA
under
inhibited
conditions,
and
once
the
inhibited
conditions
are
alleviated,
provide
a
substrate
with
higher
methane
potential.
The
shift
of
methanogenic
pathways
in
ammonia/
ammonium
inhibited
anaerobic
environments,
and
the
Archea
that
drive
them,
has
been
well
documented
in
the
literature.
The
consensus
is
that
the
shift
from
the
aceticlastic
to
syntrophic
acetate
oxidation
(SAO)/
hydrogenotrophic
pathway
depends
on
how
acclimated
the
bacteria
are
to
elevated
levels
of
TAN,
but
happens
at
approximately
4
g/L
TAN
(Hao
et
al.,
2013;
Smith
et
al.,
2014;
Angenent,
Sung,
and
Raskin,
2002;
Westerholm
et
al.,
2011;
Zhang,
Yuan,
and
Lu,
2014;
Westerholm
et
al.,
2011).
The
energetics
between
acetotrophic
(aceticlastic)
and
SAO/
hydrogenotrophic
Archea
differ
as
do
their
tolerances
for
higher
pH
and
ammonium/
ammonia.
Energetically,
aceticlastic
methanogenesis
is
more
favorable
than
the
combination
of
syntrophic
acetate
oxidation
and
hydrogenotropic
methanogenesis,
with
their
ΔG
being
-‐36.0
kj/mol
CH4
and
-‐22.0
kj/mol
CH4
respectively
(Welte
and
Deppenmeier,
2014;
Dolfing,
2014).
But
SAO
and
hydrogenotrophic
Archea
consortium
have
exhibited
higher
tolerances
for
proton
imbalance,
thus
being
better
adapted
to
35. 23
elevated
TAN
and
pH
environs
(Smith
et
al.,
2014;
Angenent,
Sung,
and
Raskin,
2002;
Westerholm
et
al.,
2011).
With
the
shift
in
pathways
also
comes
a
decrease
in
acetate
degradation
efficiency.
Schnürer,
Zellner,
and
Svensson
(1999)
noted
the
decrease
was
substantially
lower
(10-‐800
times)
when
SAO/
hydrogenotrophic
methanogenesis
was
the
dominant
acetate
degradation
pathway.
This
is
perhaps
related
to
the
difference
of
doubling
time
of
SAO
cultures
compared
to
aceticlastic
methanogens,
measured
at
28
days
and
2-‐12
days
respectively
(A.
Schnürer
and
Nordberg,
2008).
In
addition
to
the
SAO/
hydrogenotrophic
Archea
being
more
tolerant
to
elevated
TAN,
their
slow
growth
rate
also
alludes
to
the
need
for
an
acclimated
seed
as
it
would
take
time
to
establish
substantial
population
levels.
In
summary,
proper
seed
acclimation,
VFA
accumulation
in
inhibited
systems,
and
shifts
in
Archea
pathways
as
a
result
of
increased
TAN
may
explain
the
significantly
different
BMPs
observed
from
the
Seed
and
inhibited
effluent
(IE6)
sample
used
in
this
study.
2.4.4
Methane
Production
within
Treatments
Methane
production
can
be
considered
in
terms
of
volatile
solids
input
or
in
terms
of
a
unit
volume
of
substrate,
which
in
this
study
was
100mL.
The
former
is
referred
to
as
specific
yield,
while
the
latter
is
the
volumetric
yield.
Specific
yield
normalizes
the
methane
production
to
volatile
solids
input
and
is
the
common
metric
used
within
the
scientific
community.
Volumetric
yield,
on
the
other
hand,
normalizes
methane
production
with
respect
to
the
substrate
volumetric
loading
into
the
digestion
vessel.
The
latter
is
more
useful
in
the
industry
for
engineering
designs
of
digesters.
36. 24
The
specific
methane
yields
for
each
of
the
treatments,
at
different
dilutions,
are
shown
in
Figure
2.4.
The
Aerated
Effluent
(AE)
resulted
in
significantly
higher
specific
methane
yields
than
either
the
Heated
and
Aerated
(HAE)
or
the
Inhibited
Effluent
(IE).
For
each
treatment,
dilution
further
enhanced
the
specific
methane
yields.
Figure
2.4:
Specific
methane
yield
of
each
of
the
treated
effluents,
the
control
(inhibited
effluent),
and
the
Seed.
Figure
2.5
show
the
volumetric
yield
for
all
treatments
at
different
dilution
levels.
Volumetric
methane
yield
is
a
relevant
design
parameter
that
takes
into
account
TS.
While
the
normalization
of
methane
to
VS
is
scientifically
standard,
it
often
undervalues
methane
production
at
high
solids.
The
gas
production
at
higher
solids
can
be
similar
to
that
of
a
lower
solid
trial,
but
have
a
lower
specific
yield
due
the
higher
VS.
Volumetric
yield
is
a
better
indicator
of
how
much
methane
a
treatment
will
effectively
yield.
0 20 40 60 80
0
500
1000
1500
Dilution Rates
mLMethane/gVSin
Inhibited Effluent
Aerated
Heat and Aeration
Seed
37. 25
Figure
2.5:
Volumetric
methane
yields
of
each
of
the
treated
effluents,
the
control
(inhibited
effluent),
and
the
Seed.
2.4.5
Effect
of
Dilution
on
Specific
Methane
Yield
The
specific
methane
yields
for
the
Seed
dilution
and
the
60%
dilution
were
statistically
higher
than
the
yields
from
the
6%,
20%,
and
40%
dilutions
(Figure
2.6).
As
the
dilution
increased,
both
TS
and
TAN
decreased
simultaneously.
For
both
the
60%
dilution
and
the
80%
seed
dilution,
the
TAN
levels
were
below
the
4,000
mg/L
threshold
for
the
onset
of
TAN
inhibition,
at
2,017
mg/L
and
3,391
mg/L,
respectively.
Below
this
level
of
TAN,
it
is
expected
that
the
more
energetically
favorable
aceticlastic
degradation
pathway
is
predominant.
0 20 40 60 80
0
500
1000
1500
2000
2500
Dilution Rates
mLMethane/100mLSolution
Inhibited Effluent
Aerated
Heat and Aeration
Seed
38. 26
Figure
2.6:
Effect
of
dilution
on
specific
methane
yield
(same
letters
above
each
cluster
denote
statistical
similarity,
while
the
converse
is
also
true).
2.4.6
Effect
of
Treatment
on
Specific
Methane
Yield
The
specific
methane
yields
for
both
the
AE
and
the
Seed
treatment
were
statistically
greater
than
those
for
either
the
HAE
Treatment
or
the
IE
Treatment
(Figure
2.7).
Since
the
levels
of
TAN
were
lower
in
the
HAE
than
in
the
AE,
these
results
suggest
that
the
heating
process
may
have
sterilized
or
killed
some
beneficial
Archea,
which
on
the
other
hand,
could
survive
the
aeration
process.
Further
work
to
elucidate
the
dynamics
and
fate
of
the
microbial
consortia
is
necessary.
Another
possible
explanation
for
these
results
is
the
potential
volatilization
of
short-‐chained
VFA
during
the
heat-‐treatment
process.
Future
studies
should
also
be
designed
to
test
this
stipulation.
6%
20%
40%
60%
Seed:80%
0
500
1000
1500
2000
Dilution Rates
mLMethane/gVSin
a a
a
b b
39. 27
Figure
2.7:
Comparison
of
specific
methane
yields
across
treatments
(same
letters
above
the
clusters
denote
statistical
similarity,
while
the
converse
is
true;
Aeration
and
the
Seed
had
statistically
higher
specific
yield
than
the
Inhibited
Effluent
and
the
Heat
and
Aeration
Effluent).
2.4.7
Effect
of
Dilution
on
Volumetric
Methane
Yield
Figure
2.8
shows
the
effect
of
dilution
on
volumetric
methane
yield.
Unlike
the
specific
methane
yield,
dilution
had
no
significant
effect
on
volumetric
yield.
These
results
suggest
that,
while
substrates
with
higher
solid
treatments
(less
diluted)
are
not
converted
to
methane
more
efficiently,
the
higher
solids
content
counterbalances
the
dilution
effect.
H
eatand
A
eration
A
eration
Inhibited
Effluent
Seed
0
500
1000
1500
2000
Effluent Treatment
mLMethanegVSin
b b
a a
40. 28
Figure
2.8:
Comparison
of
volumetric
methane
yields
at
various
dilutions.
2.4.8
Effect
of
Treatment
on
Volumetric
Methane
Yield
The
effects
of
treatments
on
methane
volumetric
yield
are
presented
in
Figure
2.9.
The
AE
treatment
resulted
in
significantly
higher
volumetric
methane
yield
than
the
other
treatments.
The
Seed
treatment,
however,
led
into
significantly
more
volumetric
methane
yield
than
the
HAE,
but
not
to
the
IE.
The
HAE
and
the
IE
showed
no
statistical
difference.
As
previously
noted,
the
heat-‐treatment
process
most
probably
degraded
useful
microbial
consortium.
6%
20%
40%
60%
Seed:80%
0
500
1000
1500
2000
2500
Dilution Rates
mLMethane/100mLSolution
a
a
a
a
a
41. 29
Figure
2.9:
Effect
of
treatments
(aeration
or
combined
heating
and
aeration)
on
volumetric
methane
yield
compared
to
the
Seed
and
Inhibited
Effluent.
There
are
valuable
ramifications,
based
on
the
results
of
this
study,
for
producers
processing
their
high
TAN
chicken
wastes
through
anaerobic
digestion.
Both
aeration
and
dilution
treatments
have
proven
as
effective
conditioning
methods
of
inhibited-‐effluent
from
an
inhibited
or
sour
anaerobic
digester.
However,
water
is
a
valuable
resource,
which
also
exacerbates
effluent
volume
and
subsequent
management
issues.
The
less
the
water
that
is
introduced
into
an
anaerobic
digestion
system,
the
better
it
is
for
the
entire
poultry
operation.
On
the
other
hand,
aeration
treatment,
although
a
viable
choice,
is
not
only
expensive
but
also
may
result
in
negative
impacts
on
air
and
water
quality
issues.
A
thorough
economic
and
environmental
impact
assessment,
for
each
method,
is
recommended
to
guide
selection
of
the
approach
to
be
adopted.
H
eatand
A
eration
A
eration
Inhibited
Effluent
Seed
0
500
1000
1500
2000
2500
Effluent Treatment
mLMethane/100mLSolution
c
b
a ab
42. 30
2.5
Conclusions
1. This
research
revealed
the
potential
for
higher
yield
of
methane
from
previously
ammonia-‐inhibited
poultry
waste
effluent
from
an
anaerobic
digester
than
literature
BMPs
once
the
inhibited
conditions
were
alleviated.
2. The
aeration
treatment
of
previously
ammonia-‐inhibited
poultry
waste
from
an
anaerobic
digester
significantly
enhanced
specific
methane
yield
more
than
either
the
combined
heat
and
aeration
treatment
or
the
inhibited
effluent.
3. For
each
treatment
(aeration,
combined
heat
and
aeration,
and
the
inhibited
effluent),
dilution
also
enhanced
the
specific
methane
yields.
4. Aeration
of
previously
ammonia-‐inhibited
anaerobic
digestion
poultry
litter
effluent
significantly
enhanced
volumetric
methane
yields
more
than
the
combined
heating
and
aeration
of
the
ammonia-‐inhibited
substrate.
5. Unlike
for
the
specific
methane
yield,
however,
dilution
of
ammonia-‐inhibited
digester’s
effluent
had
no
significant
effect
on
volumetric
methane
yield.
6. Overall,
this
study
suggests
that
both
aeration
and
dilution
could
be
effective
methods
for
conditioning
previously
ammonia-‐inhibited
anaerobic
digester’s
effluent
prior
to
re-‐using
it
to
restore
digester’s
normal
operation.
43. 31
2.6
Recommendations
Future
work
should
be
directed
at:
1)
establishing
microbial
dynamics
and
fate
during
the
heating
and
aeration
processes,
2)
VFA
identification
and
their
potential
volatilization
during
the
heating
and
aeration
process,
and
3)
extent
of
VFA
accumulation
in
inhibited
anaerobic
digesters.
44. 32
2.7
References
Abouelenien,
F.,
W.
Fujiwara,
Y.
Namba,
M.
Kosseva,
N.
Nishio,
Y.
Nakashimada.
2010.
“Improved
Methane
Fermentation
of
Chicken
Manure
via
Ammonia
Removal
by
Biogas
Recycle.”
Bioresource
Technology
101
(16):
6368–73.
doi:10.1016/j.biortech.2010.03.071.
Abouelenien,
F.,
Y.
Nakashimada,
N.
Nishio.
2009.
“Dry
Mesophilic
Fermentation
of
Chicken
Manure
for
Production
of
Methane
by
Repeated
Batch
Culture.”
Journal
of
Bioscience
and
Bioengineering
107
(3):
293–95.
doi:10.1016/j.jbiosc.2008.10.009.
Angelidaki
I.,
L.
Ellegaard,
B.K.
Ahring.
1993.
“A
Mathematical
Model
for
Dynamic
Simulation
of
Anaerobic
Digestion
of
Complex
Substrates:
Focusing
on
Ammonia
Inhibition.”
Bioresources
and
Biotechnology
42:
159–66.
Angenent,
L.T.,
S.
Sung,
L.
Raskin.
2002.
“Methanogenic
Population
Dynamics
during
Startup
of
a
Full-‐Scale
Anaerobic
Sequencing
Batch
Reactor
Treating
Swine
Waste.”
Water
Research
36
(18):
4648–54.
doi:10.1016/S0043-‐1354(02)00199-‐9.
Angus,
A.J.,
I.D.
Hodge,
M.A.
Sutton.
2006.
“Ammonia
Abatement
Strategies
in
Livestock
Production:
A
Case
Study
of
a
Poultry
Installation.”
Agricultural
Systems
89
(1):
204–
22.
doi:10.1016/j.agsy.2005.09.003.
Benabdallah
E.H.,
T.,
S.
Astals,
A.
Galí,
S.
Mace,
J.
Mata-‐Álvarez.
2009.
“Ammonia
Influence
in
Anaerobic
Digestion
of
OFMSW.”
Water
Science
&
Technology
59
(6):
1153–58.
doi:10.2166/wst.2009.100.
Bolan,
N.S.,
A.A.
Szogi,
T.
Chuasavathi,
B.
Seshadri,
M.J.
Rothrock,
P.
Panneerselvam.
2010.
“Uses
and
Management
of
Poultry
Litter.”
World’s
Poultry
Science
Journal
66
(04):
673–98.
doi:10.1017/S0043933910000656.
Bradford,
S.A.,
E.
Segal,
W.
Zheng,
Q.
Wang,
S.R.
Hutchins.
2008.
“Reuse
of
Concentrated
Animal
Feeding
Operation
Wastewater
on
Agricultural
Lands.”
Journal
of
Environmental
Quality
37
(5):
S97–115.
doi:10.2134/jeq2007.0393.
45. 33
Bruni,
E.,
A.J.
Ward,
M.
Køcks,
A.
Feilberg,
A.P.S.
Adamsen,
A.P.
Jensen,
A.K.
Poulsen.
2013.
“Comprehensive
Monitoring
of
a
Biogas
Process
during
Pulse
Loads
with
Ammonia.”
Biomass
and
Bioenergy
56:
211–20.
doi:10.1016/j.biombioe.2013.05.002.
Bujoczek,
G.,
J.
Oleszkiewicz,
R.
Sparling,
S.
Cenkowski.
2000.
“High
Solid
Anaerobic
Digestion
of
Chicken
Manure.”
Journal
of
Agricultural
Engineering
Research
76
(1):
51–60.
doi:10.1006/jaer.2000.0529.
Burkholder,
J.,
B.
Libra,
P.
Weyer,
S.
Heathcote,
D.
Kolpin,
P
S.
Thorne,
M.
Wichman.
2007.
“Impacts
of
Waste
from
Concentrated
Animal
Feeding
Operations
on
Water
Quality.”
Environmental
Health
Perspectives
115
(2):
308–12.
doi:10.1289/ehp.8839.
Chen,
Y.,
J.J.
Cheng,
K.S.
Creamer.
2008.
“Inhibition
of
Anaerobic
Digestion
Process:
A
Review.”
Bioresource
Technology
99
(10):
4044–64.
doi:10.1016/j.biortech.2007.01.057.
Collins,
A.R.,
J.
Murphy,
D.
Bainbridge.
2000.
“Optimal
Loading
Rates
and
Economic
Analyses
for
Anaerobic
Digestion
of
Poultry
Waste.”
Journal
of
the
Air
&
Waste
Management
Association
50
(6):
1037–44.
Dolfing,
J.
2014.
“Thermodynamic
Constraints
on
Syntrophic
Acetate
Oxidation.”
Applied
and
Environmental
Microbiology
80
(4):
1539–41.
doi:10.1128/AEM.03312-‐13.
Edwards,
D.R.,
T.C.
Daniel.
1992.
“Environmental
Impacts
of
on-‐Farm
Poultry
Waste-‐
Disposal
-‐
a
Review.”
Bioresource
Technology
41
(1):
9–33.
doi:10.1016/0960-‐
8524(92)90094-‐E.
El-‐Hadidi,
Y.M.,
A.I.
Al-‐Turki.
2007.
“Organic
Fertilizer
and
Biogas
Production
from
Poultry
Wastes.”
Journal
of
Food
Agriculture
&
Environment
5
(1):
228–33.
Frear,
C.,
Z.-‐W.
Wang,
C.
Li,
and
S.
Chen.
2011.
“Biogas
Potential
and
Microbial
Population
Distributions
in
Flushed
Dairy
Manure
and
Implications
on
Anaerobic
Digestion
Technology.”
Journal
of
Chemical
Technology
&
Biotechnology
86
(1):
145–52.
doi:10.1002/jctb.2484.
Gangagni,
R.A.,
B.
Gandu,
K.
Sandhya,
K.
Kranti,
S.
Ahuja,
Y
V.
Swamy.
2013.
“Decentralized
Application
of
Anaerobic
Digesters
in
Small
Poultry
Farms:
Performance
Analysis
of
46. 34
High
Rate
Self
Mixed
Anaerobic
Digester
and
Conventional
Fixed
Dome
Anaerobic
Digester.”
Bioresource
Technology
144:
121–27.
doi:10.1016/j.biortech.2013.06.076.
Gangagni,
R.A.,
B.
Gandu,
Y.V.
Swamy.
2012.
“Mass
Transfer
Dynamics
of
Ammonia
in
High
Rate
Biomethanation
of
Poultry
Litter
Leachate.”
Bioresource
Technology,
Special
Issue:
Innovative
Researches
on
Algal
Biomass,
109:
234–38.
doi:10.1016/j.biortech.2011.12.136.
Gangagni,
R.A.,
S.S.
Prakash,
J.
Joseph,
A.R.
Reddy,
P.
N.
Sarma.
2011.
“Multi
Stage
High
Rate
Biomethanation
of
Poultry
Litter
with
Self
Mixed
Anaerobic
Digester.”
Bioresource
Technology
102
(2):
729–35.
doi:10.1016/j.biortech.2010.08.069.
Gilchrist,
M.J.,
C.
Greko,
D.B.
Wallinga,
G.W.
Beran,
D.G.
Riley,
P.S.
Thorne.
2007.
“The
Potential
Role
of
Concentrated
Animal
Feeding
Operations
in
Infectious
Disease
Epidemics
and
Antibiotic
Resistance.”
Environmental
Health
Perspectives
115
(2):
313–16.
doi:10.1289/ehp.8837.
Guštin,
S.,
R.
Marinšek-‐Logar.
2011.
“Effect
of
pH,
Temperature
and
Air
Flow
Rate
on
the
Continuous
Ammonia
Stripping
of
the
Anaerobic
Digestion
Effluent.”
Process
Safety
and
Environmental
Protection
89
(1):
61–66.
doi:10.1016/j.psep.2010.11.001.
Hansen,
K.H.,
I.
Angelidaki,
B.K.
Ahring.
1998.
“Anaerobic
Digestion
of
Swine
Manure:
Inhibition
by
Ammonia.”
Water
Research
32
(1):
5–12.
doi:10.1016/S0043-‐
1354(97)00201-‐7.
Hao,
L.,
F.
Lü,
L.
Li,
Q.
Wu,
L.
Shao,
P.
He.
2013.
“Self-‐Adaption
of
Methane-‐Producing
Communities
to
pH
Disturbance
at
Different
Acetate
Concentrations
by
Shifting
Pathways
and
Population
Interaction.”
Bioresource
Technology
140:
319–27.
doi:10.1016/j.biortech.2013.04.113.
Kayhanian,
M.
1994.
“Performance
of
a
High-‐Solids
Anaerobic-‐Digestion
Process
Under
Various
Ammonia
Concentrations.”
Journal
of
Chemical
Technology
and
Biotechnology
59
(4):
349–52.
doi:10.1002/jctb.280590406.
Kelleher,
B.P.,
J.J.
Leahy,
A.M.
Henihan,
T.
F.
O’Dwyer,
D.
Sutton,
M.J.
Leahy.
2002.
“Advances
in
Poultry
Litter
Disposal
Technology
–
a
Review.”
Bioresource
Technology,
Reviews
Issue,
83
(1):
27–36.
doi:10.1016/S0960-‐8524(01)00133-‐X.