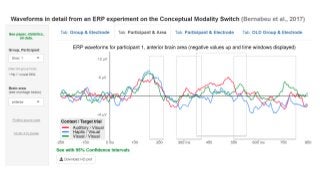
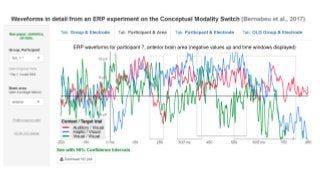
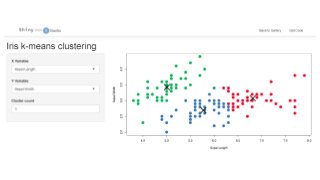
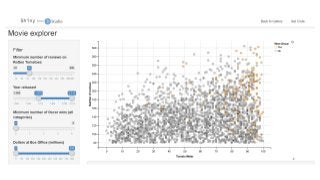
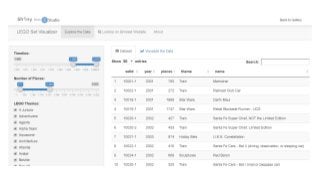
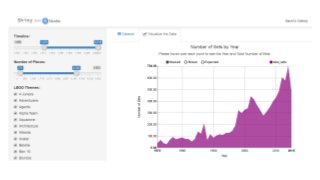
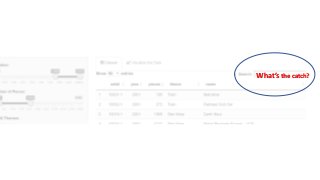
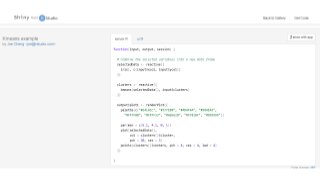
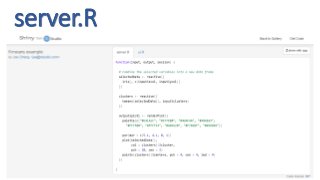
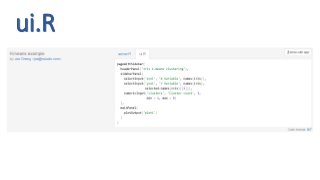
Dashboards for data visualization, such as R Shiny and Tableau, allow the interactive exploration of data by means of drop-down lists and checkboxes, with no coding for the user. The apps can be useful for both the data analyst and the public.
See also: https://www.linkedin.com/pulse/shiny-data-presentation-added-value-pablo-bernabeu
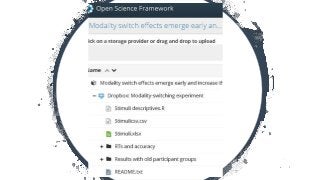
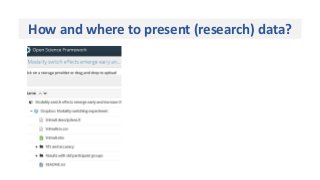
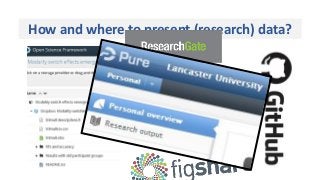
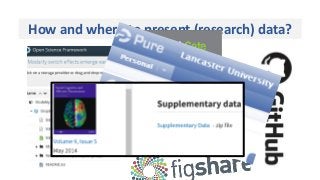
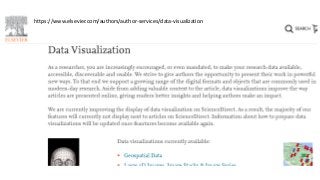
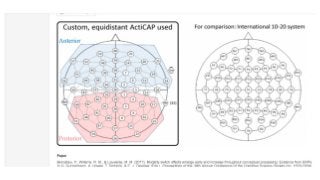
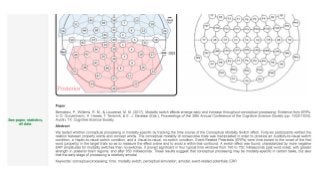
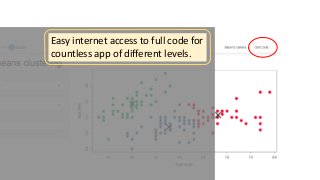
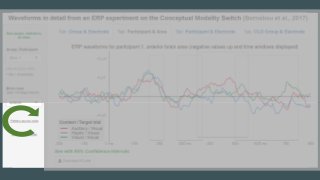
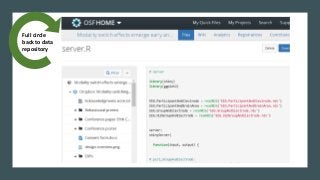
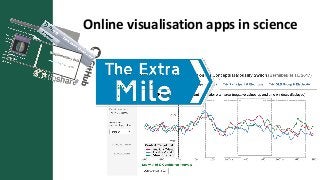
Visualization apps run on internet browsers. This allows for three options: private viewing (useful during analysis), selected sharing (used at institutions), or internet publication (all out). Among the available platforms for viz apps, R Shiny and Tableau stand out due to being relatively accessible to new users. Apps serve a broad variety of purposes (see here and here). For instance, at a time of open science in which publicly archiving data is becoming standard practice (cf. journals, osf.io, figshare.com, etc.), data presentation interfaces can be used to let anyone delve into data sets at once without any programming involved for them. It's the right tool for acknowledging all facets of the data (yet this doesn't replace archiving the data files).


![[DSC Europe 25] Danica Soc - The Science Behind Marketing: Experimentation me...](https://cdn.slidesharecdn.com/ss_thumbnails/c0nofsggs9gw5ucmallr-3-251216103155-56bd64d1-thumbnail.jpg?width=640&height=640&fit=bounds)


![[DSC Europe 25] Uros Pesic - The Reality of AI in Marketing.pdf](https://cdn.slidesharecdn.com/ss_thumbnails/rtkodnmtycovsllvzsyn-9-251215095918-b0c6bfe3-thumbnail.jpg?width=640&height=640&fit=bounds)
![[DSC Europe 25] Velibor Ilic - Autonomous Driving - How AI Shapes Technical ...](https://cdn.slidesharecdn.com/ss_thumbnails/gwu9aqths9ovngsrhidc-3-velibor-ilic-autonomous-driving-how-ai-shapes-technical-challenges-251219150035-7436923a-thumbnail.jpg?width=640&height=640&fit=bounds)

![[DSC Europe 25] Mathias Halkjær Petersen - The AI workforce revolution.pptx](https://cdn.slidesharecdn.com/ss_thumbnails/3xviexv7q5gojhdsyvat-the-ai-workforce-revolution-251218084820-f3c286ed-thumbnail.jpg?width=640&height=640&fit=bounds)

![[DSC Europe 25] Tatevik Maytesyan - How to actually use AI in marketing: gett...](https://cdn.slidesharecdn.com/ss_thumbnails/tjo626lsqdgfntbgl2mw-4-251216103155-e36cd239-thumbnail.jpg?width=640&height=640&fit=bounds)


![[DSC Europe 25] Maria Kokiasmenos - AI Governance US Perspective.pptx](https://cdn.slidesharecdn.com/ss_thumbnails/eszqnbzlsqa2vch6dmci-6-251215095918-6fcdf45f-thumbnail.jpg?width=640&height=640&fit=bounds)

![[DSC Europe 25] Kaja Kandare - LLM as a judge.pptx](https://cdn.slidesharecdn.com/ss_thumbnails/arxyccaxsdsd1ba99wjw-7-251212104007-2b4e3f64-thumbnail.jpg?width=640&height=640&fit=bounds)
![[DSC Europe 25] Branko Urosevic -Rethinking Financial Talent: Integrating Cod...](https://cdn.slidesharecdn.com/ss_thumbnails/8jjrus8ttko6qj64f58f-3-251212103250-642c6374-thumbnail.jpg?width=640&height=640&fit=bounds)
![[DSC Europe 25] Debmalya Biswas - Agentification: the art of transforming man...](https://cdn.slidesharecdn.com/ss_thumbnails/r5azlggvtqiaiiusrqdr-4-251212103249-5a12c89b-thumbnail.jpg?width=640&height=640&fit=bounds)


