The Evolving Search for a New Home
•
0 likes•29 views

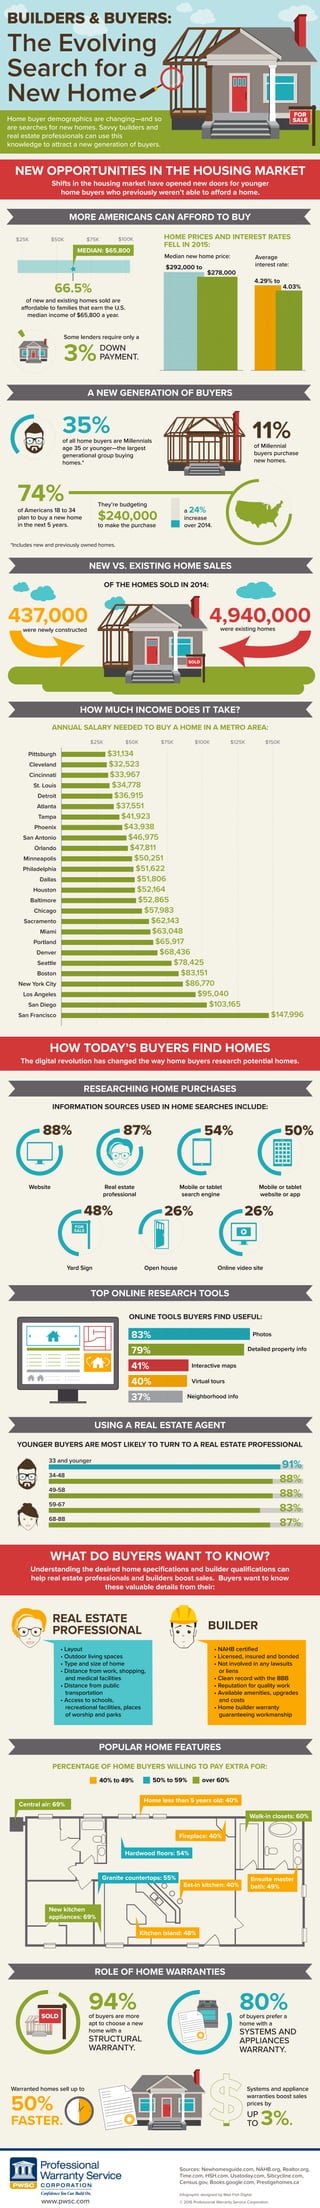
The document summarizes how home buying demographics and search methods are changing. Younger buyers now make up a larger share of the market and prefer to do online research. Some of their key online tools include photos, detailed property information, interactive maps and virtual tours. The median home price and interest rates declined in 2015, making homes affordable to more families. Features like kitchen islands, granite countertops and walk-in closets are popular upgrades buyers are willing to pay more for.

Recommended
More Related Content
Similar to The Evolving Search for a New Home
Similar to The Evolving Search for a New Home (20)
Recently uploaded
Recently uploaded (20)
The Evolving Search for a New Home
- 1. The Evolving Search for a New Home Home buyer demographics are changing—and so are searches for new homes. Savvy builders and real estate professionals can use this knowledge to attract a new generation of buyers. FOR SALE BUILDERS & BUYERS: were existing homes SOLD 4,940,000437,000were newly constructed HOW TODAY’S BUYERS FIND HOMES The digital revolution has changed the way home buyers research potential homes. ANNUAL SALARY NEEDED TO BUY A HOME IN A METRO AREA: MORE AMERICANS CAN AFFORD TO BUY HOW MUCH INCOME DOES IT TAKE? Pittsburgh Cleveland Cincinnati St. Louis Detroit Atlanta Tampa Phoenix San Antonio Orlando Minneapolis Philadelphia Dallas Houston Baltimore Chicago Sacramento Miami Portland Denver Seattle Boston New York City Los Angeles San Diego San Francisco $147,996 $103,165 $25K $50K $75K $100K $125K $150K $95,040 $86,770 $83,151 $78,425 $68,436 $65,917 $63,048 $62,143 $57,983 $52,865 $52,164 $51,806 $51,622 $50,251 $47,811 $46,975 $43,938 $41,923 $37,551 $36,915 $34,778 $33,967 $32,523 $31,134 INFORMATION SOURCES USED IN HOME SEARCHES INCLUDE: RESEARCHING HOME PURCHASES OF THE HOMES SOLD IN 2014: NEW VS. EXISTING HOME SALES 88% 87% 54% 50% Website Real estate professional Mobile or tablet search engine Mobile or tablet website or app 48% 26% 26% Yard Sign Open house Online video site FOR SALE • • • • • • • • • • • • ONLINE TOOLS BUYERS FIND USEFUL: Photos Detailed property info Interactive maps Virtual tours Neighborhood info TOP ONLINE RESEARCH TOOLS 83% 79% 41% 40% 37% USING A REAL ESTATE AGENT NEW OPPORTUNITIES IN THE HOUSING MARKET Shifts in the housing market have opened new doors for younger home buyers who previously weren’t able to afford a home. HOME PRICES AND INTEREST RATES FELL IN 2015: Median new home price: $292,000 to $278,000 Average interest rate: 4.29% to 4.03% of new and existing homes sold are affordable to families that earn the U.S. median income of $65,800 a year. Some lenders require only a A NEW GENERATION OF BUYERS $25K $50K $75K $100K MEDIAN: $65,800 66.5% 3%DOWN PAYMENT. of all home buyers are Millennials age 35 or younger—the largest generational group buying homes.* 35% of Millennial buyers purchase new homes. 11% *Includes new and previously owned homes. 74% They’re budgeting $240,000 to make the purchase of Americans 18 to 34 plan to buy a new home in the next 5 years. a 24% increase over 2014. WHAT DO BUYERS WANT TO KNOW? Understanding the desired home specifications and builder qualifications can help real estate professionals and builders boost sales. Buyers want to know these valuable details from their: REAL ESTATE PROFESSIONAL YOUNGER BUYERS ARE MOST LIKELY TO TURN TO A REAL ESTATE PROFESSIONAL 91%33 and younger 34-48 88% 49-58 88% 59-67 83% 68-88 87% POPULAR HOME FEATURES PERCENTAGE OF HOME BUYERS WILLING TO PAY EXTRA FOR: BUILDER Kitchen island: 48% Eat-in kitchen: 40% New kitchen appliances: 69% Granite countertops: 55% Ensuite master bath: 49% Walk-in closets: 60% Fireplace: 40% Central air: 69% Hardwood floors: 54% Home less than 5 years old: 40% 40% to 49% 50% to 59% over 60% ROLE OF HOME WARRANTIES of buyers are more apt to choose a new home with a STRUCTURAL WARRANTY. 94% of buyers prefer a home with a SYSTEMS AND APPLIANCES WARRANTY. 80%SOLD Warranted homes sell up to 50% FASTER. Systems and appliance warranties boost sales prices by 3%. UP TO • Layout • Outdoor living spaces • Type and size of home • Distance from work, shopping, and medical facilities • Distance from public transportation • Access to schools, recreational facilities, places of worship and parks • NAHB certified • Licensed, insured and bonded • Not involved in any lawsuits or liens • Clean record with the BBB • Reputation for quality work • Available amenities, upgrades and costs • Home builder warranty guaranteeing workmanship Sources: Newhomesguide.com, NAHB.org, Realtor.org, Time.com, HSH.com, Usatoday.com, Sibcycline.com, Census.gov, Books.google.com, Prestigehomes.ca www.pwsc.com © 2016 Professional Warranty Service Corporation Infographic designed by Mad Fish Digital