Download to read offline
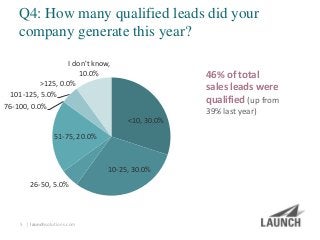
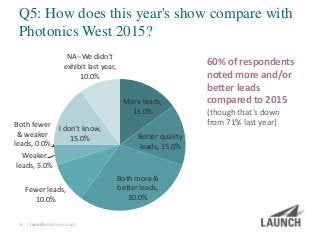
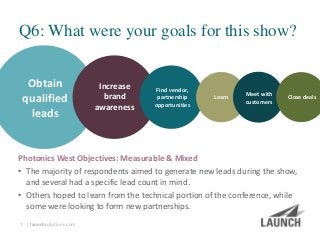
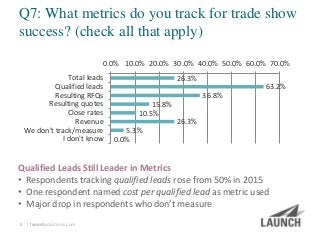


The results of our 2016 survey reveal average lead numbers, as well as sales follow-up techniques and metrics used by Photonics West participants. Use the data to benchmark your own trade show success. Read more on our blog: http://www.launchsolutions.com/blog/photonics-west-2016-survey-more-qualified-leads-shift-in-trade-show-follow-up


