More Related Content
Similar to Paper+6 microscopia+electrónica+rubinstein+nature+2012
Similar to Paper+6 microscopia+electrónica+rubinstein+nature+2012 (20)
Paper+6 microscopia+electrónica+rubinstein+nature+2012
- 1. LETTER doi:10.1038/nature10699
Subnanometre-resolution structure of the intact
Thermus thermophilus H1
-driven ATP synthase
Wilson C. Y. Lau1,2
& John L. Rubinstein1,2,3
Ion-translocating rotary ATPases serve either as ATP synthases,
using energy from a transmembrane ion motive force to create the
cell’s supply of ATP, or as transmembrane ion pumps that are
powered by ATP hydrolysis1
. The members of this family of
enzymes each contain two rotary motors: one that couples ion
translocation to rotation and one that couples rotation to ATP
synthesis or hydrolysis. During ATP synthesis, ion translocation
through the membrane-bound region of the complex causes rota-
tion of a central rotor that drives conformational changes and ATP
synthesis in the catalytic region of the complex. There are no struc-
tural models available for the intact membrane region of any ion-
translocating rotary ATPase. Here we present a 9.7 A˚ resolution
map of the H1
-driven ATP synthase from Thermus thermophilus
obtained by electron cryomicroscopy of single particles in ice. The
600-kilodalton complex has an overall subunit composition of
A3B3CDE2FG2IL12. The membrane-bound motor consists of a ring
of L subunits and the carboxy-terminal region of subunit I, which
are equivalent to the c and a subunits of most other rotary ATPases,
respectively. The map shows that the ring contains 12 L subunits2
and that the I subunit has eight transmembrane helices3
. The L12
ring and I subunit have a surprisingly small contact area in the
middle of the membrane, with helices from the I subunit making
contacts with two different L subunits. The transmembrane helices
of subunit I form bundles that could serve as half-channels across
the membrane, with the first half-channel conducting protons
from the periplasm to the L12 ring and the second half-channel
conducting protons from the L12 ring to the cytoplasm. This struc-
ture therefore suggests the mechanism by which a transmembrane
proton motive force is converted to rotation in rotary ATPases.
To investigate how the structure of the T. thermophilus ATP
synthase allows its rotary mechanism, we imaged the detergent-
solubilized intact enzyme by electron cryomicroscopy (cryo-EM)
and calculated a three-dimensional map to approximately 10 A˚ reso-
lution (Supplementary Fig. 1). This resolution was sufficient to observe
a-helices in the structure. Achieving this resolution required optim-
ization of the specimen preparation and imaging conditions, and
development of a new map refinement algorithm (Methods).
Figure 1a shows the refined three-dimensional map. Available crystal
structures of subunits and subcomplexes of the enzyme were fitted into
the map with remarkably good agreement (Fig. 1b, c). A cross-section
through the soluble region of the map shows that the a-helices that
make up each of the E and G subunits of the two peripheral stalks can
be resolved (Fig. 1d, purple and beige arrows, respectively), as can
densities that correspond to a-helices in subunits with more complex
folds, such as the A subunits (Fig. 1d, for example, circled in yellow).
Map segments corresponding to subunits matched available crystal
structures with high fidelity (Fig. 1e–g). If the protein particles imaged
occupied all possible rotational states of the central rotor, the three-
dimensional map would show the average conformation of each A and
B subunit and the density corresponding to the DF subcomplex would
1
Molecular Structure and Function Program, The Hospital for Sick Children Research Institute, 555 University Avenue, Toronto, Ontario M5G 1X8, Canada. 2
Department of Biochemistry, The University of
Toronto, Ontario M5S 1A8, Canada. 3
Department of Medical Biophysics, The University of Toronto, Ontario M5G 2M9, Canada.
d
e
f gc
90°
I
L-ring
G
E
C
D
F
A
B
A
G
E
D
F
ba
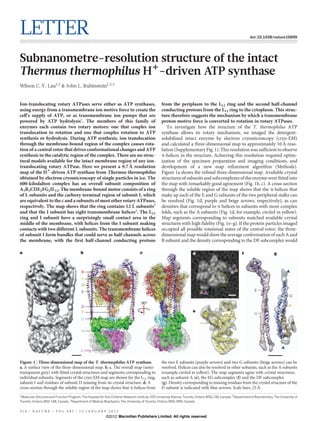
Figure 1 | Three-dimensional map of the T. thermophilus ATP synthase.
a, A surface view of the three-dimensional map. b, c, The overall map (semi-
transparent grey) with fitted crystal structures and segments corresponding to
individual subunits. Segments of the cryo-EM map are shown for the L12 ring,
subunit I and residues of subunit D missing from its crystal structure. d, A
cross-section through the soluble region of the map shows that a-helices from
the two E subunits (purple arrows) and two G subunits (beige arrows) can be
resolved. Helices can also be resolved in other subunits, such as the A subunits
(example circled in yellow). The map segments agree with crystal structures,
such as subunit A (e), the EG subcomplex (f) and the DF subcomplex
(g). Density corresponding to missing residues from the crystal structure of the
D subunit is indicated with blue arrows. Scale bars, 25 A˚.
2 1 4 | N A T U R E | V O L 4 8 1 | 1 2 J A N U A R Y 2 0 1 2
Macmillan Publishers Limited. All rights reserved©2012
- 2. appear as a rotational average of the structure of these subunits.
However, docking an A3B3DF crystal structure4
into the map
(Fig. 1b, c and Supplementary Fig. 2) and fitting the DF-rotor sub-
complex into its corresponding map segment (Fig. 1g) revealed that
the enzyme was arrested in a single rotational state5
. This homogeneity
explains why we were able to extract nanometre-resolution informa-
tion when averaging many different particles to calculate the map. The
crystal structure of the A3B3DF subcomplex showed that two of the
AB subunit pairs took on similar closed or narrow conformations,
designated ANBN and AN9BN9, whereas the third adopted an open or
wide conformation, designated AWBW
4
. From the position of the D
and F subunits in the cryo-EM map, it is apparent that the ANBN pair,
which corresponds to the bTPaTP pair in mitochondrial F1-ATPase6
, is
positioned at the A/B interface between the two peripheral stalks
(Supplementary Fig. 2). Because we did not take any measures to stop
the rotor in one rotational state, the existence of this unique position
suggests that in the intact complex the observed state has a lower
energy than other positions of the rotor. For the membrane-bound
subunits I and L, where no crystal structures are available, segmented
densities are shown in Fig. 1b, c.
The extramembranous portion of the map contains a wealth of
informationonhow thedifferentsubunitsinteractinthe intactenzyme.
The twoperipheral stalksofthe complexhavethe samestructures inthe
intact assembly, both adopting conformations that match the available
crystal structure7
. Contacts between the catalytic A3B3 hexamer and the
peripheralstalksexclusivelyinvolvetheBsubunitsandEsubunitsofthe
stalks, and are mostly between the amino-terminal b-barrel domains of
the B subunits and the C-terminal a/b-domains of the E subunits. The
N-terminal region of both subunits E and G in both of the peripheral
stalks interact with the N-terminal region of subunit I. The funnel-
shaped C subunit, which links the DF portion of the central rotor to
the L12 ring and has been crystallized in isolation8
, is significantly more
open in the intact enzyme than in the crystal structure so that it can
accept the DF subunits into its central cavity (Fig. 2). The three pseudo-
symmetric domains of the C subunit can be differentiated in the map
showing that interaction of the C subunit and the L12 ring strongly
involves the N-terminal a-helix of the first domain of subunit C. The
C subunit sits asymmetrically on the L12 ring and does not penetrate
significantly into the central pore of the ring. The cryo-EM map shows
that the N-terminal region of subunit I consists of an elongated helical
bundle flanked by two domains, consistent with a crystal structure of
a homologous protein that was published after submission of this
manuscript9
(Supplementary Fig. 3).
The map provides the first detailed insight into how the I subunit
and L12 ring fit together to allow the generation of rotation (Fig. 3a).
Cross-sections through the detergent-embedded region of the map
show two concentric rings of densities, with the outer ring consisting
of12 well-resolved densities (Fig. 3b–e). These 12 densities undoubtedly
correspond to the outer helices of the L12 ring, where each L subunit
consists of a helical hairpin. The N-terminal inner helices of the L12 ring
could not be resolved and appear as a nearly continuous density. Our
ability to resolve the outer helices is consistent with the loose packing
and gaps seen between the outer helices in crystal structures of related
ring subcomplexes10–15
. Although composed of similarly sized residues
as the outer helices, the crystallographic studies suggest that the inner
helices are more tightly packed and resolving them would require a
resolution better than 9.7A˚. As shown previously5
, the detergent used
to keep the enzyme soluble, dodecylmaltoside, has a density higher than
that of ice and is visible surrounding the transmembrane region of the
complex (Fig. 3b, left panel, white bars). Features in the detergent
micelle, which we expect to be mostly unstructured, may represent
noise that is enhanced by construction of the map to nanometre reso-
lution. Density is visible within the centre of the L12 ring (Fig. 3b, left
panel, yellow circle) and probably corresponds to a detergent or lipid
plug observed by atomic force microscopy of isolated rings16
. The map
presents the first determination of the ring structure within an intact
rotary ATPase, providing insight into how the I subunit affects the L12
ring. This information is necessary to assess the likelihood of proposed
catalytic models in which the L subunits undergo conformational
changes when they contact the I subunit17
. From the cryo-EM map it
is evident that the 12-fold symmetry of the L12 ring is not broken
significantly, even where the L subunits contact the I subunit (Fig. 3c,
d). This preserved symmetry of the ring is inconsistent with models of
proton translocation that require major conformational changes in the
rotor, but could still be consistent with swivelling of the outer helices of
the L subunits if this motion did not distort the ring significantly17
.
Proton translocation facilitated by the I subunit drives rotation of
the L12 ring, but until now there has been no structural information
available for subunit I or its equivalent subunit from any rotary
ATPase. Here we observe eight transmembrane densities that can be
a
b
c
d
e
Figure 2 | Fitting of the C subunit crystal structure. a, b, Side (a) and top
(b) views comparing rigid body fitting of the C subunit crystal structure (red) to
flexible fitting of the crystal structure (cyan) into the corresponding map
segment. Arrows indicate regions of major difference between the two atomic
models. c, d, Side (c) and top (d) views showing that flexible fitting of the C
subunit gives it a more open conformation that allows it to accommodate the
segment for the DF subcomplex (dark blue) into its central cavity. e, A side view
of the C subunit, and the segment corresponding to the L12 ring (magenta),
show that subunit C sits asymmetrically on the ring with its N-terminal a-helix
(cyan arrow) mediating most of the contact with the L subunits. Scale bar, 25 A˚.
LETTER RESEARCH
1 2 J A N U A R Y 2 0 1 2 | V O L 4 8 1 | N A T U R E | 2 1 5
Macmillan Publishers Limited. All rights reserved©2012
- 3. attributed to a-helices in the C-terminal region of subunit I (Fig. 3b–e).
This number of transmembrane helices is consistent with an experi-
mentally tested topology map of the Saccharomyces cerevisiae
V-ATPase a subunit3
, with which the I subunit sequence aligns
well (Supplementary Fig. 4). Although we can trace the complete
trajectories of the eight transmembrane densities of subunit I, our
inability to resolve the helices in the tightly packed inner ring of the
L12 oligomer means that we cannot rule out the possibility that we have
missed a transmembrane helix in our analysis of subunit I. At the
cytoplasmic surface of the membrane region, the densities from the
N- and C-terminal regions of subunit I appear to be connected in more
than one place (Fig. 3a and the right panel of Fig. 3b, blue arrows).
These connections show that there must be protein–protein inter-
actions between the N- and C-terminal regions of subunit I involved
in keeping the two regions rigidly attached. Within the membrane,
subunit I divides into two clusters of helices: one that is mostly per-
pendicular to the membrane, and another that contains tilted helices
adjacent to the L12 ring. The first cluster contacts a single L subunit
near the middle of the membrane region (right panel of Fig. 3c, circled
in red) whereas the second cluster contacts the adjacent L subunit a
small distance further towards the periplasm (right panel of Fig. 3d,
circled in blue). The maximal separation of the I subunit helices from
theouter helices of theL12 ring is of around thesamedistance, approxi-
mately 15 A˚ between helical axes, as is the maximal separation between
adjacent outer helices of the L12 ring.
Proton translocation in rotary ATPases is thought to involve proto-
nation and deprotonation of conserved mid-membrane glutamic acid
or aspartic acid residues in the outer helices of the ring-forming sub-
units. In the L subunit from the T. thermophilus ATP synthase, this
conserved protonatable residue is Glu 63. The contact of the I subunit
with two different L subunits (Fig. 3c, d) places the two L subunits in
distinctchemicalenvironmentsandestablishestheconditionsnecessary
for a two half-channel model for proton translocation13,18
, with one L
subunit exchanging protons with the periplasm and another L subunit
exchanging protons with the cytoplasm. One cluster of transmembrane
helices in the I subunit could conduct protons from the periplasm to the
mid-membrane Glu 63 residue of an L subunit (Fig. 4a, blue circle). The
other cluster of transmembrane helices in subunit I could conduct
protons from the mid-membrane Glu 63 residue of the adjacent L
subunit to the cytoplasm (Fig. 4a, red circle). Crystal structures of other
membrane proteins indicate that four transmembrane helices are suf-
ficient for forming a proton pore, with available examples showing
proton19
and sodium20
conducting pores composed of four and three
transmembrane helices, respectively. The structure suggests that
protons flow from the periplasmic half-channel to the Glu63 residue
of the L subunit in contact with the periplasmic half-channel (the L
subunit with an outer helix labelled ‘1’ in Fig. 3c–e). Protonation of this
Glu 63 neutralizes the negative charge of the residue and allows the
anticlockwise rotation of the ring (viewed from the cytoplasm) that
places the Glu63 in the hydrophobic environment of the lipid bilayer
(Fig. 4b). With the negative charge neutralized, Glu63 can assume the
proton-locked conformation seen in a crystal structure of the Spirulina
platensis c15 ring13
. In this conformation, both oxygen atoms in Glu63
are involved in hydrogen bonding with other residues in the L12 ring
and the neutral Glu63 residue is tucked into the crevice between L
subunits. The directionality of the rotation is explained by a Brownian
ratchet mechanism where random thermal rotational fluctuations are
biased to go in the correct direction by the direction of the proton
motive force across the membrane18
. Rotation of the L12 ring brings
an L subunit bearing a protonated Glu 63 (on the helix labelled ‘2’ in
Fig. 3c–e) out of the lipid environment and into contact with the
cytoplasmic half-channel of subunit I. Subunit I contains a conserved
and essential arginine residue (Arg 563) of unknown function21,22
. It
has been postulated that Arg 563 causes a decrease in the pKa of the
Glu 63 residue on the L subunit in contact with the cytoplasmic half-
channel, thereby causing it to lose its proton to the channel23
. Arg 563
may also stabilize the deprotonated Glu 63 by forming a salt bridge12
.
This arrangement of half-channels is consistent with a model where L
ring rotation could be driven in either direction, depending only on the
direction of the proton motive force across the membrane. However,
thespecificarrangementsofaminoacidsinthestructure,whichcannot
be resolved in this map, could be such that proton translocation from
1
2
3
4
5
6 7
8
9
10
11
12
3
N terminal regionN-terminal region
C-terminaal
region
Cytoplasm
Periplasm
a b c
e d
4
5
6
7
8
9
10
11
1212
1
2
3
4
5
6 7
8
9
10
11
12
Figure 3 | The membrane-bound region of the enzyme. a, Map segments of
the L12 ring (magenta) and subunit I (green) showing multiple contacts
between the N- and C-terminal regions of subunit I (blue arrows). b, Cross-
sections through the map (left panel) and map segments truncated at the same
height (right panel) show subunit I separated from the L12 ring near the
cytoplasm. Outer helices of the L12 ring are indicated (red arrows) and the
transmembrane helices of subunit I are outlined (green). Cross-sections show
the detergent micelle (white bars) and detergent or lipid in the centre of the L12
ring (yellowcircle). c, Near themiddle of themembrane, subunit I contacts an L
subunit, probably forming the mid-membrane end of the cytoplasmic half
channel (circle in red in right panel). d, Approximately 6 A˚ further towards the
periplasm subunit I contacts a different L subunit, probably forming the mid-
membrane end of the periplasmic half-channel (circled in blue in right panel).
e, Subunit I is separated from the L12 ring near the periplasm. Scale bars, 25 A˚.
RESEARCH LETTER
2 1 6 | N A T U R E | V O L 4 8 1 | 1 2 J A N U A R Y 2 0 1 2
Macmillan Publishers Limited. All rights reserved©2012
- 4. the cytoplasm to the periplasm is not able to induce rotation. At 9.7 A˚
resolution, it is not possible to relate unambiguously the sequence of
the C-terminal region of subunit I and predicted transmembrane
helices (shown in Supplementary Fig. 4) to the transmembrane
densities in the map. Nonetheless, Arg 563 has been proposed to reside
on transmembrane helix 7 and form part of the cytoplasmic half-
channel3
, which would identify transmembrane helix 7 as one of the
two helices in contact with the L subunit labelled ‘2’ in Fig. 3.
At both the cytoplasmic and periplasmic limits of the membrane-
embedded region of the map (Fig. 3b, e) all helices from subunit I are
well separated from the helices of the L12 ring, making it highly
unlikely that an entire half-channel could be formed by the interface
of helices from the I and L subunits24
. F-type ATP synthases have been
proposed to have five transmembrane helices25,26
. If true, this topology
would suggest that in those enzymes the two half-channels consist of
three helices, that one or more helices contributes to both half-
channels simultaneously, or that helices from the rotor are involved
in formation of the half-channels. The observation that the two L
subunits in contact with the I subunit are immediately adjacent to
each other indicates that after a Glu 63 residue is deprotonated by
the cytoplasmic half-channel it is immediately reprotonated by the
periplasmic half-channel with a single 30u rotational step of the rotor.
The small contact area between the I subunit and L12 ring suggests that
these membrane-bound components rely on the two peripheral stalks
to hold them together in the precise arrangement necessary for the
complex’s biological activity. This minimal contact is consistent with
an important but fragile interaction that might easily be disrupted by
non-physiological conditions such as those needed to make three-
dimensional crystals, thus helping to explain why the membrane region
of this class of enzyme has not been crystallized, despite significant
efforts by many research groups. Knowledge of the precise residues
involved in proton translocation will require construction of cryo-EM
maps to higher resolution or formation of well-ordered crystals of this
hitherto refractory protein complex. At subnanometre resolution, the
complete structure of the T. thermophilus H1
-driven ATP synthase
suggests the mechanism by which the energy stored in a transmem-
brane proton motive force is converted into rotation in rotary ATPases.
METHODS SUMMARY
T. thermophilus HB8 was grown and the H1
-driven ATP synthase purified as
described previously5
. Specimens were prepared for cryo-EM with a Vitrobot
(FEI) and imaged with an FEI Tecnai F20 electron microscope equipped with a
field emission gun and operating at 200kV. An electron exposure of approxi-
mately 18 electrons A˚22
was used during imaging to optimize the signal-to-noise
ratio at relevant spatial frequencies27
. Images were recorded on Kodak SO-163
film and digitized with a Photoscan densitometer (Intergraph). The previously
published cryo-EM map of the T. thermophilus V-ATPase5
was filtered to 30 A˚
resolution and used as an initial model for refinement of the entirely new data set
of 46,105 particle images. Initial particle orientations were determined by projec-
tion matching with Frealign28
using information out to 20 A˚ resolution. The
accuracy of particle orientations was refined further with a new program
(Refine_fspace), ultimately using information out to 11.2 A˚ resolution.
Full Methods and any associated references are available in the online version of
the paper at www.nature.com/nature.
Received 18 July; accepted 3 November 2011.
Published online 18 December 2011; corrected 11 January 2012 (see full-text
HTML version for details).
1. Muench, S. P., Trinick, J. & Harrison, M. A. Structural divergence of the rotary
ATPases. Q. Rev. Biophys. 44, 311–356 (2011).
2. Toei, M. et al. Dodecamer rotor ring defines H1
/ATP ratio for ATP synthesis of
prokaryotic V-ATPase from Thermus thermophilus. Proc. Natl Acad. Sci. USA 104,
20256–20261 (2007).
3. Toei,M., Toei, S. &Forgac,M.Definition ofmembranetopologyandidentification of
residues important for transport in subunit a of the vacuolar ATPase. J. Biol. Chem.
286, 35176–35186 (2011).
4. Numoto, N., Hasegawa, Y., Takeda, K. & Miki, K. Inter-subunit interaction and
quaternary rearrangement defined by the central stalk of prokaryotic V1-ATPase.
EMBO Rep. 10, 1228–1234 (2009).
5. Lau, W. C. & Rubinstein, J. L. Structure of intact Thermus thermophilus V-ATPase by
cryo-EM reveals organization ofthe membrane-bound V(O)motor.Proc.NatlAcad.
Sci. USA 107, 1367–1372 (2010).
6. Abrahams, J. P., Leslie,A. G., Lutter, R. & Walker, J. E. Structure at 2.8 A resolution of
F1-ATPase from bovine heart mitochondria. Nature 370, 621–628 (1994).
7. Lee, L. K. et al. The structure of the peripheral stalk of Thermus thermophilus H1
-
ATPase/synthase. Nature Struct. Mol. Biol. 17, 373–378 (2010).
8. Iwata, M. et al. Crystal structure of a central stalk subunit C and reversible
association/dissociation of vacuole-type ATPase. Proc. Natl Acad. Sci. USA 101,
59–64 (2004).
To cytoplasm -
12
3
4
12
11
10
9
87
6
5
a
Periplasm
Cytoplasm
half-channel
Cytoplasmic
half-channel
12
3
4
12
11
10
9
87
6
5
-
b
(i)
(ii)
From
periplasm
1
2
3
4
12
11
10
98
7
6
5
-
(iii)
+++++++++++++++++++++++++++++++++++++++
H
+++++++++
HHHHHHHHHHHHHHHHHH
+
H
+++++++
HHHHHHHHHHHHHHHHHH
++++++++++++++++++++++++++++++++++++++++
H+
H+
+
+
Figure 4 | Model for proton translocation. a, Subunit I (green) is shown
parallel to the membrane with the L12 ring in front of it indicated by a semi-
transparent magenta rectangle. During ATP synthesis, protons enter the
periplasmic half-channel in subunit I (dashed blue oval) and are conducted to
the centre of the lipid bilayer where they neutralize the Glu63 residue of an L
subunit. The ring rotates to bring a protonated Glu 63 residue into contact with
the cytoplasmic half-channel (dashed red oval). b, Viewed from the cytoplasm,
two half-channels in subunit I are depicted as clusters of green cylinders.
Deprotonated Glu63 residues are shown with two red oxygen atoms whereas
protonated Glu63 residues are shown with one red and one yellow oxygen
atom. Protonation of L subunit ‘1’ by the periplasmic half-channel (i) and
deprotonation of L subunit ‘2’ by the cytoplasmic half-channel (ii) lead to
rotation of the ring, with L subunit ‘1’ assuming a proton-locked conformation
as it enters the lipid bilayer. Rotation brings the proton-locked L subunit ‘3’ to
the cytoplasmic half-channel (iii) where it assumes an unlocked conformation,
allowing the sequence of events to repeat.
LETTER RESEARCH
1 2 J A N U A R Y 2 0 1 2 | V O L 4 8 1 | N A T U R E | 2 1 7
Macmillan Publishers Limited. All rights reserved©2012
- 5. 9. Srinivasan, S., Vyas, N. K., Baker, M. L. & Quiocho, F. A. Crystal structure of the
cytoplasmic N-terminal domain of subunit I, a homolog of subunit a, of V-ATPase.
J. Mol. Biol. 412, 14–21 (2011).
10. Murata, T. et al. Structure of the rotor of the V-type Na1
-ATPase from Enterococcus
hirae. Science 308, 654–659 (2005).
11. Stock, D., Leslie, A. G. & Walker, J. E. Molecular architecture of the rotary motor in
ATP synthase. Science 286, 1700–1705 (1999).
12. Meier, T. et al. Structure of the rotor ring of F-type Na1
-ATPase from Ilyobacter
tartaricus. Science 308, 659–662 (2005).
13. Pogoryelov,D., Yildiz, O., Faraldo-Gomez, J. D. & Meier, T. High-resolution structure
of the rotor ring of a proton-dependent ATP synthase. Nature Struct. Mol. Biol. 16,
1068–1073 (2009).
14. Watt, I. N. et al. Bioenergetic cost of making anadenosinetriphosphate molecule in
animal mitochondria. Proc. Natl Acad. Sci. USA 107, 16823–16827 (2010).
15. Preiss, L. et al. A new type of proton coordination in an F1F0-ATP synthase rotor
ring. PLoS Biol. 8, e1000443 (2010).
16. Meier, T. et al. The central plug in the reconstituted undecameric c cylinder of a
bacterial ATPsynthase consistsofphospholipids. FEBSLett. 505, 353–356 (2001).
17. Fillingame, R. H., Angevine, C. M. & Dmitriev, O. Y. Mechanics of coupling proton
movements to c-ring rotation in ATP synthase. FEBS Lett. 555, 29–34 (2003).
18. Junge, W., Lill, H. & Engelbrecht, S. ATP synthase: an electrochemical transducer
with rotatory mechanics. Trends Biochem. Sci. 22, 420–423 (1997).
19. Stouffer, A. L. et al. Structural basis for the function and inhibition of an influenza
virus proton channel. Nature 451, 596–599 (2008).
20. Gonzales, E. B., Kawate, T. & Gouaux, E. Pore architecture and ion sites in acid-
sensing ion channels and P2X receptors. Nature 460, 599–604 (2009).
21. Cain, B. D. & Simoni, R. D. Proton translocation by the F1F0ATPase of Escherichia
coli. Mutagenic analysis of the a subunit. J. Biol. Chem. 264, 3292–3300 (1989).
22. Kawasaki-Nishi, S., Nishi, T. & Forgac, M. Arg-735 of the 100-kDa subunit a of the
yeast V-ATPase is essential for proton translocation. Proc. Natl Acad. Sci. USA 98,
12397–12402 (2001).
23. Pogoryelov, D. et al. Microscopic rotary mechanism of ion translocation in the Fo
complex of ATP synthases. Nature Chem. Biol. 6, 891–899 (2010).
24. Steed, P. R. & Fillingame, R. H. Aqueous accessibility to the transmembrane
regions of subunit c of the Escherichia coli F1F0 ATP synthase. J. Biol. Chem. 284,
23243–23250 (2009).
25. Long, J. C., Wang, S. & Vik, S. B. Membrane topology of subunit a of the F1F0 ATP
synthaseasdeterminedbylabelingofuniquecysteine residues. J.Biol. Chem. 273,
16235–16240 (1998).
26. Valiyaveetil,F. I. & Fillingame, R. H. Transmembrane topography of subunit a in the
Escherichia coli F1F0 ATP synthase. J. Biol. Chem. 273, 16241–16247 (1998).
27. Baker, L. A., Smith, E. A., Bueler, S. A. & Rubinstein, J. L. The resolution dependence
of optimal exposures in liquid nitrogen temperature electron cryomicroscopy of
catalase crystals. J. Struct. Biol. 169, 431–437 (2010).
28. Grigorieff, N. FREALIGN: high-resolution refinement of single particle structures. J.
Struct. Biol. 157, 117–125 (2007).
Supplementary Information is linked to the online version of the paper at
www.nature.com/nature.
Acknowledgements We thank V. Kanelis, F. Sicheri, P. Rosenthal, L. Kay and
R. Henderson for discussions and reading this manuscript, and J. Walker and R. Pome`s
for discussions. Computations were performed on the general-purpose cluster
supercomputer at the SciNet HPC Consortium. W.C.Y.L. was supported by an Ontario
Graduate Scholarship. J.L.R. was supported by a New Investigator Award from the
Canadian Institutes of Health Research and an Early Researcher Award from the
Ontario Ministry of Research and Innovation. This research was funded by operating
grant MOP 81294 from the Canadian Institutes of Health Research.
Author Contributions J.L.R. and W.C.Y.L. designed the experiments and J.L.R.
supervised the research. W.C.Y.L. performed protein purification and cryo-EM. J.L.R.
wrote new computer programs. W.C.Y.L. and J.L.R. performed the image analysis,
interpreted the data and wrote the manuscript.
Author Information The cryo-EM map of the T. thermophilus H1
-driven ATP synthase is
deposited in Electron Microscopy Data Bank under accession code EMD-5335; the
docked atomic models are deposited in Protein Data Bank under accession number
3J0J. Reprints and permissions information is available at www.nature.com/reprints.
The authors declare no competing financial interests. Readers are welcome to
comment on the online version of this article at www.nature.com/nature.
Correspondence and requests for materials should be addressed to J.L.R.
(john.rubinstein@utoronto.ca).
RESEARCH LETTER
2 1 8 | N A T U R E | V O L 4 8 1 | 1 2 J A N U A R Y 2 0 1 2
Macmillan Publishers Limited. All rights reserved©2012
- 6. METHODS
Specimen preparation and imaging. T. thermophilus HB8 was grown and the
H1
-driven ATP synthase purified as described previously5
. Specimens were pre-
pared on glow-discharged Quantifoil R2/2 carbon-coated TEM grids (Quantifoil
Microtools) with a Vitrobot grid freezing device (FEI Company) and imaged with
a FEI Tecnai F20 electron microscope equipped with a field emission gun and
operating at 200kV. An electron exposure of approximately 18 electrons A˚22
was
used to optimize the signal-to-noise ratio at relevant spatial frequencies27
. Images
were recorded on Kodak SO-163 film with defocus values between 2.5 and 4.5mm
at 350,000 magnification, developed in D19 for 8 min and digitized with a
Photoscan densitometer (Intergraph). Only micrographs that showed high con-
trast from thin ice layers, no noticeable drift and oscillations of the contrast
transfer function beyond 10 A˚ resolution were selected for further analysis.
From these micrographs, contrast transfer function parameters were determined29
and particle images were selected interactively with Ximdisp30
.
Three-dimensional map construction and segmenting. Initial particle orienta-
tion parameters for the data set of 46,105 particle images were determined by
projection matching with Frealign28
using a reference map created by low-pass
filtering the previously published map of the T. thermophilus H1
-driven ATP
synthase to 30 A˚ resolution. Orientation parameters were refined with Frealign
using information out to 20 A˚ resolution. Further refinement of particle orienta-
tion parameters was achieved with a new program, Refine_fspace, that performs
projection matching in Fourier space while allowing continuous constrained
optimization of the Euler angles and shifts with a simplex minimization algo-
rithm31,32
. Before projection matching with a normalized correlation coefficient,
imageFourier transforms were multiplied bythecontrast transfer functionandthe
map projection Fourier transforms by the square of the contrast transfer function.
To avoid influencing the measurement of resolution with noise bias, the highest
spatial frequency used during refinement was kept below the resolution limitof the
map, ultimately incorporating information out to 11.2 A˚ resolution.
From the data set of particle images, the top approximately 90% (42,075) with
the best correlation coefficients at their determined orientations were selected and
the final three-dimensional map was calculated by sinc function interpolation in
Fourier space28
. The resolution of the final map was assessed by Fourier shell
correlation and Fourier neighbour correlation33
with the 0.143 (ref. 34) and 0.5
thresholds.Fouriercomponents were sharpenedwith aninverse B-factorof750A˚2
and weighted for the signal-to-noise ratio with a Cref filter35
. Segmentation was
performedautomaticallyusingSegger36
, semiautomatically usingWateredge37
and
manually using EMAN qsegment38
.
Model building and fitting. The ProteinDataBank accessionnumbersforatomic
models used to interpret the three-dimensional cryo-EM map were 3A5C
(A3B3DF complex4
), 3K5B (EG complex7
), 1R5Z (subunit C8
) and 3RRK (the
N-terminal domain of subunit I from Meiothermus ruber9
). A comparative model
of the L subunit in its proton-locked conformation was built with Phyre2 (ref. 39)
using the two C-terminal transmembrane helices of the NtpK subunit of the
sodium-driven V-ATPase from Enterococcus hirae (Protein Data Bank accession
number 2BL2 (ref. 10)) as the template. This template was identified automatically
by Phyre2 with 99.9% confidence and represents 90% coverage of subunit L. An
atomic model of the L12 ring was constructed in Situs40
. Rigid-body fitting of
atomic models into the cryo-EM map was done with UCSF Chimera41
; flexible
fitting of subunit C into the map was performed with IMODFIT (http://chaconlab.
org/imodfit/index.html). All figures were rendered with UCSF Chimera41
.
29. Mindell,J.A.&Grigorieff,N.Accuratedeterminationoflocaldefocusandspecimen
tilt in electron microscopy. J. Struct. Biol. 142, 334–347 (2003).
30. Crowther, R. A., Henderson, R. & Smith, J. M. MRC image processing programs.
J. Struct. Biol. 116, 9–16 (1996).
31. Nelder, J. A. & Mead, R. A simplex method for function minimization. Comput. J. 7,
308–313 (1965).
32. Press, W. H., Teukolsky, S. A., Vetterlin, W. T. & Flannery, B. P. Numerical Recipes in
Fortran 77 2nd edn (Cambridge Univ. Press, 2003).
33. Sousa, D. & Grigorieff, N. Ab initio resolution measurement for single particle
structures. J. Struct. Biol. 157, 201–210 (2007).
34. Rosenthal, P. B., Crowther, R. A. & Henderson, R. An objective criterion for
resolution assessment in single-particle electron microscopy (appendix). J. Mol.
Biol. 333, 743–745 (2003).
35. Rosenthal, P. B. & Henderson, R. Optimal determination of particle orientation,
absolute hand, and contrast loss in single-particle electron cryomicroscopy. J. Mol.
Biol. 333, 721–745 (2003).
36. Pintilie, G. D. et al. Quantitative analysis of cryo-EM density map segmentation by
watershed and scale-space filtering, and fitting of structures by alignment to
regions. J. Struct. Biol. 170, 427–438 (2010).
37. Baker, L. A. & Rubinstein, J. L. Edged watershed segmentation: a semi-interactive
algorithmfor segmentation oflow-resolutionmaps fromelectron cryomicroscopy.
J. Struct. Biol. 176, 127–132 (2011).
38. Ludtke, S. J., Baldwin, P. R. & Chiu, W. EMAN: semiautomated software for high-
resolution single-particle reconstructions. J. Struct. Biol. 128, 82–97 (1999).
39. Kelley,L.A. & Sternberg,M.J.Proteinstructureprediction onthe Web: a casestudy
using the Phyre server. Nature Protocols 4, 363–371 (2009).
40. Chacon, P. & Wriggers, W. Multi-resolution contour-based fitting of
macromolecular structures. J. Mol. Biol. 317, 375–384 (2002).
41. Goddard, T. D., Huang, C. C. & Ferrin, T. E. Visualizing density maps with UCSF
Chimera. J. Struct. Biol. 157, 281–287 (2007).
LETTER RESEARCH
Macmillan Publishers Limited. All rights reserved©2012