Beginners Guide to TikTok for Search - Rachel Pearson - We are Tilt __ Bright...
The Walt Disney Company Annual Report Analysis - Graphs
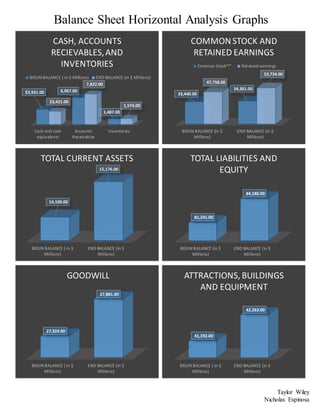
1. Taylor Wiley
Nicholas Espinosa
Balance Sheet Horizontal Analysis Graphs
Cash and cash
equivalents
Accounts
Receivables
Inventories
$3,931.00 6,967.00
1,487.00
$3,421.00
7,822.00
1,574.00
CASH, ACCOUNTS
RECIEVABLES,AND
INVENTORIES
BEGIN BALANCE ( in $ Millions) END BALANCE (in $ Millions)
BEGIN BALANCE (in $
Millions)
END BALANCE (in $
Millions)
33,440.00
34,301.00
47,758.00
53,734.00
COMMONSTOCK AND
RETAINED EARNINGS
Common Stock** Retained earnings
BEGIN BALANCE ( in $
Millions)
END BALANCE (in $
Millions)
14,109.00
15,176.00
TOTAL CURRENT ASSETS
BEGIN BALANCE (in $
Millions)
END BALANCE (in $
Millions)
81,241.00
84,186.00
TOTAL LIABILITIES AND
EQUITY
BEGIN BALANCE ( in $
Millions)
END BALANCE (in $
Millions)
27,324.00
27,881.00
GOODWILL
BEGIN BALANCE ( in $
Millions)
END BALANCE (in $
Millions)
41,192.00
42,263.00
ATTRACTIONS, BUILDINGS
AND EQUIPMENT
2. Taylor Wiley
Nicholas Espinosa
Income Statement Horizontal Analysis Graphs
BEGIN BALANCE (in $
Millions)
END BALANCE (in $
Millions)
$37,280.00
$40,246.00
7,761.00 8,567.00
REVENUES: SERVICES &
PRODUCTS
Revenues: Services Revenues: Products
BEGIN BALANCE (in $
Millions)
END BALANCE (in $
Millions)
45,041.00
48,813.00
TOTAL REVENUES
BEGIN BALANCE (in $
Millions)
END BALANCE (in $
Millions)
(4,944.00) (5,064.00)
COST OF SERVICES &
PRODUCTS
SOLD
Costs of services* Cost of products*
BEGIN BALANCE (in $
Millions)
END BALANCE (in $
Millions)
(35,591.00)
(37,273.00)
TOTAL COSTS AND EXPENSES
BEGIN BALANCE (in $
Millions)
END BALANCE (in $
Millions)
6,636.00
8,004.00
NET INCOME
BEGIN BALANCE (in $
Millions)
END BALANCE (in $
Millions)
3.38
4.26
3.42
4.31
EARNINGS PER SHARE
ATTRIBUTABLE TO DISNEY
Diluted** Basic**