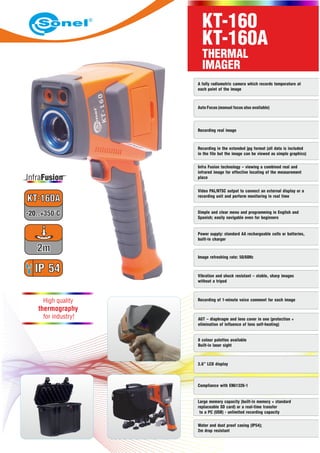
1. A fully radiometric camera which records temperature at
each point of the image
Auto Focus (manual focus also available)
Recording real image
Recording in the extended jpg format (all data is included
in the file but the image can be viewed as simple graphics)
Infra Fusion technology – viewing a combined real and
infrared image for effective locating of the measurement
place
THERMAL
IMAGER
Power supply: standard AA rechargeable cells or batteries,
built-in charger
Simple and clear menu and programming in English and
Spanish; easily navigable even for beginners
Video PAL/NTSC output to connect an external display or a
recording unit and perform monitoring in real time
Vibration and shock resistant – stable, sharp images
without a tripod
Image refreshing rate: 50/60Hz
AGT – diaphragm and lens cover in one (protection +
elimination of influence of lens self-heating)
Recording of 1-minute voice comment for each image
8 colour palettes available
Built-in laser sight
Large memory capacity (built-in memory + standard
replaceable SD card) or a real-time transfer
to a PC (USB) - unlimited recording capacity
Water and dust proof casing (IP54);
2m drop resistant
High quality
thermography
for industry!
KT-160
KT-160A
Compliance with EN61326-1
3.6” LCD display
2. Technical specification
Detector type Non-cooled microbolometric matrix (160 x 120 pixel, 25µm)
Spectral range 8-14µm
Thermal sensitivity <0.1°C at 30°
Field of view/ focus distance 20.6° x 15.5° / 11mm (standard lens)
Focus Automatic or manual
Recording of visual images
External display
Video output
CMOS sensor, 1600 x 1200 pixel, "true colours" mode (24-bit)
LCD TFT 3.6”, high-resolution
PAL/NTSC
InfraFusion technology Combining visual and IR image
Temperature range
Accuracy ±2°C or 2% reading
Emissivity
Adjustable from 0.01 to 1.00 (with 0.01 increments) atmospheric
transmission and outside optical conditions
Measurement properties
Automatic correction for distance, relative humidity, atmospheric
transmission and outside optical conditions
Optical transmission correction Automatic, based on signals from sensors
Image storage 2 memory types: 2GB replaceable SD card and 150MB built-in memory
File format
JPG with thermograph data, visual image of the recorded area
and voice comment
Voice comment up to 60 sec
Classification A1 GalnP semiconductor, diode laser
Power supply AA rechargeable cells, AA alkaline batteries
Charging Built-in charger
Battery operating time More than 3 hours of continuous operation
AC operation AC adapter - 110/230 VAC, 50/60Hz
Working temperature -10°C to 50°C
Storage temperature -20°C to 60°C
Humidity Operating and storage: 10% do 95%, non-condensing
Casing IP54, IEC 529
Shocks Working: 25G, IEC 68-2-29
Vibration Working: 2G, IEC 68-2-6
Communication
USB 2.0: transfer of image, measurement and voice to a PC;
video image live transfer, video output
Weight 0.73kg (with batteries)
Dimensions 111mm x 124mm x 240mm
REAL IMAGETHERMAL IMAGE THERMAL IMAGE + REAL IMAGE
thermal image on the corresponding visual image.
technology overlays
8 color palettes
available
THERMAL IMAGER
KT-160
KT-160A
Index: WMXXKT160
Index: WMXXKT160A
KT-160 KT-160A
-20°C do 250°C -20°C do 350°C
3. Create reports – also as an overlay for MS Word
or Excel . Use the “drag and drop” method to
transfer to the report all that you want to include
in it: thermographs, corresponding visual
images, analysis results for the whole or part of
theimage,histograms,etc.
Save all corrections and characteristic points
forfurtherreviewat a latertime.
Determine and read the minimum, maximum and
average temperature for the whole area or for each
selected area. Select the section (straight o broken line)
for which the averaged temperature can be determined and
an automatic temperaturedistributionprofile canbemade.
Sharpen, smooth, average, emphasize the edges of the object visible on the thermograph. Rotate
or make a mirrorimage.
InfraFusion technology – thermograph is overlaid on a part of visual image,
in a palette chosen by the user. The thermograph is overlaid with selected
transparency for optimized presentation and marking of images, particularly when
visual comparison of the area from the thermograph with the details on the visual
imageis difficult.
Automatic histograms for the whole image and
each selected area; including graphic
presentation of percent distribution of individual
temperatureranges.
Correct the emissivity for the whole or a part of the thermograph – emissivity can be
correctedseparatelyfor eachselectedimage area.
Selection of reviewed areas – select a rectangular or oval area or an area of any
shape. Then you can select the joint part of selected areas, combine or cut the areas,
and movetheir borders.
Read the temperature at any point – when the cursor is placed in the Information
window, it displays continuously read temperature with current coordinates. Other
saved information (maximum temperature, humidity,emissivity) isalsoavailable.
Select an optimum colour palette (from among
9 palettes available in the software) for the best
visual presentation of temperature changes.
Define the temperature range for the best
presentation of the distribution (auto or manual
mode).
WITH THE ATTACHED SOFTWARE
ANALYSE AND REPORT RESULTS
4. Real
image
Thermal
image
MEASUREMENT
Unlimited
in many areas!
applications
TRANSPARENCY 40% TRANSPARENCY 80%
ANALYSIS
REPORT
The software licence is unlimited – you can use it on many computers simultaneously.
Sonel S.A. Wokulskiego 11, 58-100 Świdnica, Poland
tel. +48 74 85 83 860, fax +48 74 85 83 809, export@sonel.pl, www.sonel.pl
WITH THE ATTACHED SOFTWARE
ANALYSE AND REPORT RESULTS