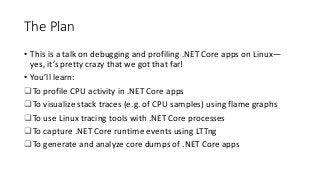
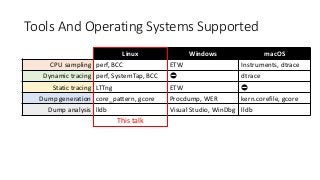
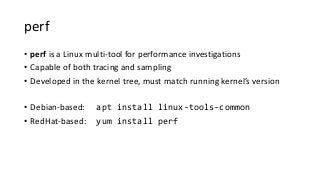
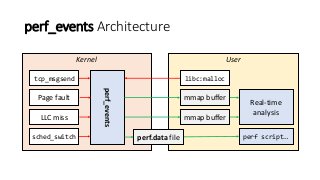
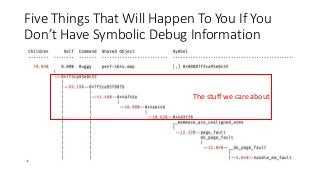
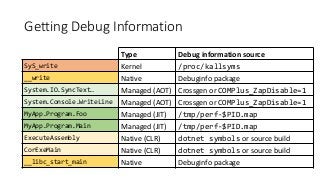
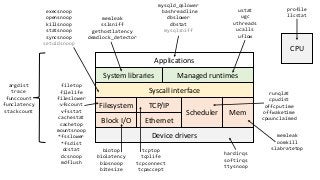
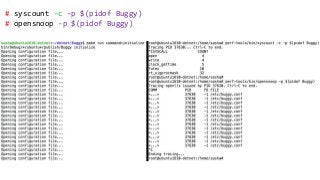
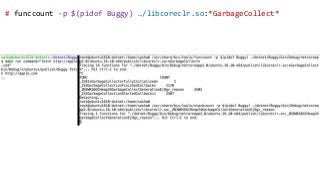
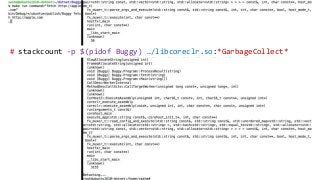
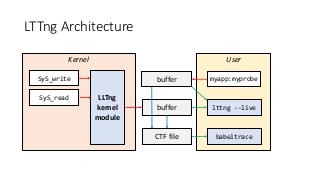
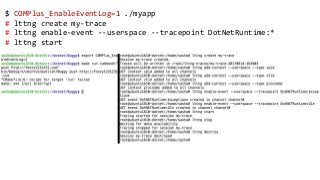
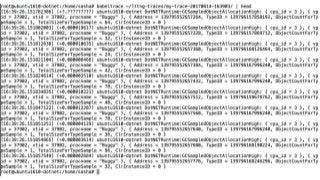
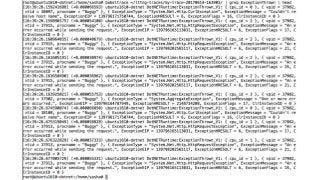
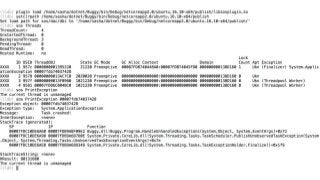
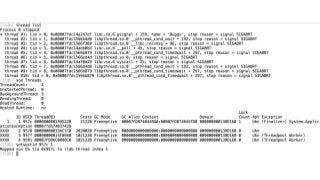
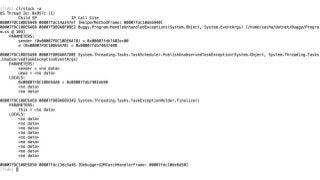
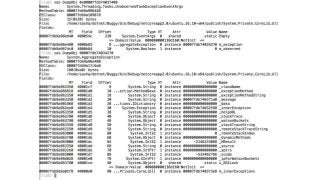
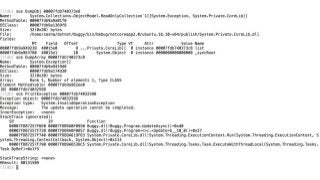
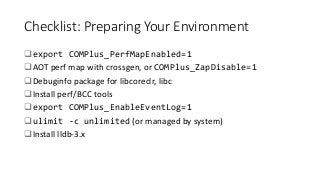
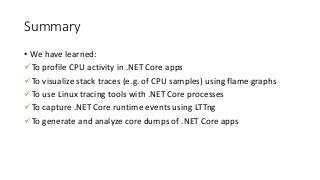
Debugging And
Profiling
.NET Core Apps
on Linux
Sasha Goldshtein
@goldshtn
The Plan
• This is a talk on debugging and profiling .NET Core apps on Linux—
yes, it’s pretty crazy that we got that far!
• You’ll learn:
To profile CPU activity in .NET Core apps
To visualize stack traces (e.g. of CPU samples) using flame graphs
To use Linux tracing tools with .NET Core processes
To capture .NET Core runtime events using LTTng
To generate and analyze core dumps of .NET Core apps
🎓 Disclaimer
• A lot of this stuff has changed, and is changing
• The tools described here mostly work with .NET Core 2.x, but your
mileage may vary
• Some of this relies on scripts I hacked together, and will hopefully* be
officially supported in the future
*I’ve been saying this for almost two years now
Tools And Operating Systems Supported
Linux Windows macOS
CPU sampling perf, BCC ETW Instruments, dtrace
Dynamic tracing perf, SystemTap, BCC ⛔️ dtrace
Static tracing LTTng ETW ⛔️
Dump generation core_pattern, gcore Procdump, WER kern.corefile, gcore
Dump analysis lldb Visual Studio, WinDbg lldb
This talk
⚠️ Mind The Overhead
• Any observation can change the state of the system, but some
observations are worse than others
• Diagnostic tools have overhead
• Check the docs
• Try on a test system first
• Measure degradation introduced by the tool
OVERHEAD
This traces various kernel page cache functions and maintains in-kernel counts, which are asynchronously copied
to user-space. While the rate of operations can be very high (>1G/sec) we can have up to 34% overhead, this is still
a relatively efficient way to trace these events, and so the overhead is expected to be small for normal
workloads. Measure in a test environment.
—man cachestat (from BCC)
Sampling vs. Tracing
• Sampling works by getting a snapshot or a call stack every N
occurrences of an interesting event
• For most events, implemented in the PMU using overflow counters and
interrupts
• Tracing works by getting a message or a call stack at every occurrence
of an interesting event
CPU timepid 121 pid 121 pid 408 pid 188
system timepid 121 pid 408
CPU sample
disk write
.NET Core on Linux Tracing Architecture
kernel
user
.NET Core app
CoreCLR
OS libraries
CPU
EventSource events
CLR events (LTTng)
Probes, USDT
Tracepoints (scheduler, block I/O, networking)
“Software events” (core migrations, page faults)
PMU events (clock cycles, branches, LLC misses)
The Official Story: perfcollect and PerfView
1. Download perfcollect
2. Install prerequisites: ./perfcollect install
3. Run collection: ./perfcollect collect mytrace
4. Copy the mytrace.zip file to a Windows machine 😳
5. Download PerfView 😁
6. Open the trace in PerfView 😱
perf
• perf is a Linux multi-tool for performance investigations
• Capable of both tracing and sampling
• Developed in the kernel tree, must match running kernel’s version
• Debian-based: apt install linux-tools-common
• RedHat-based: yum install perf
perf_events Architecture
UserKernel
tcp_msgsend
Page fault
LLC miss
sched_switch
perf_events
libc:malloc
mmap buffer
mmap buffer
Real-time
analysis
perf script…perf.data file
Five Things That Will Happen To You If You
Don’t Have Symbolic Debug Information
The stuff we care about
Getting Debug Information
Type Debug information source
SyS_write Kernel /proc/kallsyms
__write Native Debuginfo package
System.IO.SyncText… Managed (AOT) Crossgen or COMPlus_ZapDisable=1
System.Console.WriteLine Managed (AOT) Crossgen or COMPlus_ZapDisable=1
MyApp.Program.Foo Managed (JIT) /tmp/perf-$PID.map
MyApp.Program.Main Managed (JIT) /tmp/perf-$PID.map
ExecuteAssembly Native (CLR) dotnet symbols or source build
CorExeMain Native (CLR) dotnet symbols or source build
__libc_start_main Native Debuginfo package
🔥 Flame Graphs
• A visualization method (adjacency graph), very
useful for stack traces, invented by Brendan
Gregg
• http://www.brendangregg.com/flamegraphs.html
• Turns thousands of stack trace pages into a
single interactive graph
• Example scenarios:
• Identify CPU hotspots on the system/application
• Show stacks that perform heavy disk accesses
• Find threads that block for a long time and the stack
where they do it
Reading a Flame Graph
• Each rectangle is a function
• Y-axis: caller-callee
• X-axis: sorted stacks (not time)
• Wider frames are more common
• Supports zoom, find
• Filter with grep 😎
$ COMPlus_PerfMapEnabled=1 ./myapp
# perf record -g -p $(pidof Buggy) -F 97
# perf report
# perf script | stackcollapse-perf.pl | FlameGraph.pl > flame.svg
The Old Way And The New Way: BPF
kernel
u{,ret}probe:
malloc
perf_events perf.data
user
perf | awk | …
report
bytes # distribution
0 - 1 … |@@@@ |
1 – 2 … |@ |
2 - 4 … |@@@@@@@@ |
kernel
u{,ret}probe:
malloc
BPF program BPF map
user
control program
report
bytes # distribution
0 - 1 … |@@@@ |
1 – 2 … |@ |
2 - 4 … |@@@@@@@@ |
user
libc:malloc
user
libc:malloc
The BCC BPF Front-End
• https://github.com/iovisor/bcc
• BPF Compiler Collection (BCC) is a
BPF frontend library and a massive
collection of performance tools
• Contributors from Facebook, PLUMgrid,
Netflix, Sela
• Helps build BPF-based tools in high-
level languages
• Python, Lua, C++
• Up-and-coming competitor: bpftrace
kernel
user
BCC tool BCC tool …
BCC compiler frontend
Clang + LLVM
BCC loader library
BPF runtime
event
sources
Managed runtimes
Syscall interface
Block I/O Ethernet
Scheduler Mem
Device drivers
Filesystem TCP/IP
CPU
Applications
System libraries
profile
llcstat
hardirqs
softirqs
ttysnoop
runqlat
cpudist
offcputime
offwaketime
cpuunclaimed
memleak
oomkill
slabratetoptcptop
tcplife
tcpconnect
tcpaccept
biotop
biolatency
biosnoop
bitesize
filetop
filelife
fileslower
vfscount
vfsstat
cachestat
cachetop
mountsnoop
*fsslower
*fsdist
dcstat
dcsnoop
mdflush
execsnoop
opensnoop
killsnoop
statsnoop
syncsnoop
setuidsnoop
mysqld_qslower
bashreadline
dbslower
dbstat
mysqlsniff
memleak
sslsniff
gethostlatency
deadlock_detector
ustat
ugc
uthreads
ucalls
uflow
argdist
trace
funccount
funclatency
stackcount
# syscount -c -p $(pidof Buggy)
# opensnoop -p $(pidof Buggy)
# funccount -p $(pidof Buggy) …/libcoreclr.so:*GarbageCollect*
# stackcount -p $(pidof Buggy) …/libcoreclr.so:*GarbageCollect*
LTTng Architecture
UserKernel
SyS_write
SyS_read LLTng
kernel
module
myapp:myprobe
buffer lttng --live
babeltraceCTF file
buffer
$ COMPlus_EnableEventLog=1 ./myapp
# lttng create my-trace
# lttng enable-event --userspace --tracepoint DotNetRuntime:*
# lttng start
Plotting data from GCStats events,
original work by Aleksei Vereshchagin
at DotNext Saint Petersburg
🚮 Core Dumps
• A core dump is a memory snapshot of a running process
• Can be generated on crash or on demand
dump file
Generating Core Dumps
• /proc/sys/kernel/core_pattern configures the core file name or
application to process the crash
• ulimit -c controls maximum core file size (often 0 by default)
• gcore (part of gdb) can create a core dump on demand
• CoreCLR ships with a createdump utility
• There’s also Procdump for Linux 🙀😱
Analyzing .NET Core Dumps
$ lldb /usr/bin/dotnet -c core.1788
(lldb) bt
The stuff we care about
libsosplugin.so
(lldb) plugin load …/libsosplugin.so
(lldb) setclrpath …
DumpObj
DumpArray
DumpHeap
GCRoot
PrintException
Threads
ClrStack
EEHeap
DumpDomain
DumpAssembly
Checklist: Preparing Your Environment
export COMPlus_PerfMapEnabled=1
AOT perf map with crossgen, or COMPlus_ZapDisable=1
Debuginfo package for libcoreclr, libc
Install perf/BCC tools
export COMPlus_EnableEventLog=1
ulimit -c unlimited (or managed by system)
Install lldb-3.x
Summary
• We have learned:
To profile CPU activity in .NET Core apps
To visualize stack traces (e.g. of CPU samples) using flame graphs
To use Linux tracing tools with .NET Core processes
To capture .NET Core runtime events using LTTng
To generate and analyze core dumps of .NET Core apps
References
• perf and flame graphs
• https://perf.wiki.kernel.org/index.php/Main_Page
• http://www.brendangregg.com/perf.html
• https://github.com/brendangregg/perf-tools
• .NET Core diagnostics docs
• https://github.com/dotnet/coreclr/blob/master/Do
cumentation/project-docs/linux-performance-
tracing.md
• https://github.com/dotnet/coreclr/blob/master/Do
cumentation/building/debugging-instructions.md
• My blog posts
• http://blogs.microsoft.co.il/sasha/2017/02/26/anal
yzing-a-net-core-core-dump-on-linux/
• http://blogs.microsoft.co.il/sasha/2017/02/27/profi
ling-a-net-core-application-on-linux/
• http://blogs.microsoft.co.il/sasha/2017/03/30/traci
ng-runtime-events-in-net-core-on-linux/
• BCC tutorials
• https://github.com/iovisor/bcc/blob/master/docs/t
utorial.md
• https://github.com/iovisor/bcc/blob/master/docs/t
utorial_bcc_python_developer.md
• https://github.com/iovisor/bcc/blob/master/docs/r
eference_guide.md
Thank You!
@goldshtn

.NET Fest 2018. Sasha Goldshtein. Profiling and Debugging .NET Core Apps on Linux

  • 1.
    Debugging And Profiling .NET CoreApps on Linux Sasha Goldshtein @goldshtn
  • 2.
    The Plan • Thisis a talk on debugging and profiling .NET Core apps on Linux— yes, it’s pretty crazy that we got that far! • You’ll learn: To profile CPU activity in .NET Core apps To visualize stack traces (e.g. of CPU samples) using flame graphs To use Linux tracing tools with .NET Core processes To capture .NET Core runtime events using LTTng To generate and analyze core dumps of .NET Core apps
  • 3.
    🎓 Disclaimer • Alot of this stuff has changed, and is changing • The tools described here mostly work with .NET Core 2.x, but your mileage may vary • Some of this relies on scripts I hacked together, and will hopefully* be officially supported in the future *I’ve been saying this for almost two years now
  • 4.
    Tools And OperatingSystems Supported Linux Windows macOS CPU sampling perf, BCC ETW Instruments, dtrace Dynamic tracing perf, SystemTap, BCC ⛔️ dtrace Static tracing LTTng ETW ⛔️ Dump generation core_pattern, gcore Procdump, WER kern.corefile, gcore Dump analysis lldb Visual Studio, WinDbg lldb This talk
  • 5.
    ⚠️ Mind TheOverhead • Any observation can change the state of the system, but some observations are worse than others • Diagnostic tools have overhead • Check the docs • Try on a test system first • Measure degradation introduced by the tool OVERHEAD This traces various kernel page cache functions and maintains in-kernel counts, which are asynchronously copied to user-space. While the rate of operations can be very high (>1G/sec) we can have up to 34% overhead, this is still a relatively efficient way to trace these events, and so the overhead is expected to be small for normal workloads. Measure in a test environment. —man cachestat (from BCC)
  • 6.
    Sampling vs. Tracing •Sampling works by getting a snapshot or a call stack every N occurrences of an interesting event • For most events, implemented in the PMU using overflow counters and interrupts • Tracing works by getting a message or a call stack at every occurrence of an interesting event CPU timepid 121 pid 121 pid 408 pid 188 system timepid 121 pid 408 CPU sample disk write
  • 7.
    .NET Core onLinux Tracing Architecture kernel user .NET Core app CoreCLR OS libraries CPU EventSource events CLR events (LTTng) Probes, USDT Tracepoints (scheduler, block I/O, networking) “Software events” (core migrations, page faults) PMU events (clock cycles, branches, LLC misses)
  • 8.
    The Official Story:perfcollect and PerfView 1. Download perfcollect 2. Install prerequisites: ./perfcollect install 3. Run collection: ./perfcollect collect mytrace 4. Copy the mytrace.zip file to a Windows machine 😳 5. Download PerfView 😁 6. Open the trace in PerfView 😱
  • 9.
    perf • perf isa Linux multi-tool for performance investigations • Capable of both tracing and sampling • Developed in the kernel tree, must match running kernel’s version • Debian-based: apt install linux-tools-common • RedHat-based: yum install perf
  • 10.
    perf_events Architecture UserKernel tcp_msgsend Page fault LLCmiss sched_switch perf_events libc:malloc mmap buffer mmap buffer Real-time analysis perf script…perf.data file
  • 11.
    Five Things ThatWill Happen To You If You Don’t Have Symbolic Debug Information The stuff we care about
  • 12.
    Getting Debug Information TypeDebug information source SyS_write Kernel /proc/kallsyms __write Native Debuginfo package System.IO.SyncText… Managed (AOT) Crossgen or COMPlus_ZapDisable=1 System.Console.WriteLine Managed (AOT) Crossgen or COMPlus_ZapDisable=1 MyApp.Program.Foo Managed (JIT) /tmp/perf-$PID.map MyApp.Program.Main Managed (JIT) /tmp/perf-$PID.map ExecuteAssembly Native (CLR) dotnet symbols or source build CorExeMain Native (CLR) dotnet symbols or source build __libc_start_main Native Debuginfo package
  • 13.
    🔥 Flame Graphs •A visualization method (adjacency graph), very useful for stack traces, invented by Brendan Gregg • http://www.brendangregg.com/flamegraphs.html • Turns thousands of stack trace pages into a single interactive graph • Example scenarios: • Identify CPU hotspots on the system/application • Show stacks that perform heavy disk accesses • Find threads that block for a long time and the stack where they do it
  • 14.
    Reading a FlameGraph • Each rectangle is a function • Y-axis: caller-callee • X-axis: sorted stacks (not time) • Wider frames are more common • Supports zoom, find • Filter with grep 😎
  • 15.
    $ COMPlus_PerfMapEnabled=1 ./myapp #perf record -g -p $(pidof Buggy) -F 97
  • 16.
  • 17.
    # perf script| stackcollapse-perf.pl | FlameGraph.pl > flame.svg
  • 19.
    The Old WayAnd The New Way: BPF kernel u{,ret}probe: malloc perf_events perf.data user perf | awk | … report bytes # distribution 0 - 1 … |@@@@ | 1 – 2 … |@ | 2 - 4 … |@@@@@@@@ | kernel u{,ret}probe: malloc BPF program BPF map user control program report bytes # distribution 0 - 1 … |@@@@ | 1 – 2 … |@ | 2 - 4 … |@@@@@@@@ | user libc:malloc user libc:malloc
  • 20.
    The BCC BPFFront-End • https://github.com/iovisor/bcc • BPF Compiler Collection (BCC) is a BPF frontend library and a massive collection of performance tools • Contributors from Facebook, PLUMgrid, Netflix, Sela • Helps build BPF-based tools in high- level languages • Python, Lua, C++ • Up-and-coming competitor: bpftrace kernel user BCC tool BCC tool … BCC compiler frontend Clang + LLVM BCC loader library BPF runtime event sources
  • 21.
    Managed runtimes Syscall interface BlockI/O Ethernet Scheduler Mem Device drivers Filesystem TCP/IP CPU Applications System libraries profile llcstat hardirqs softirqs ttysnoop runqlat cpudist offcputime offwaketime cpuunclaimed memleak oomkill slabratetoptcptop tcplife tcpconnect tcpaccept biotop biolatency biosnoop bitesize filetop filelife fileslower vfscount vfsstat cachestat cachetop mountsnoop *fsslower *fsdist dcstat dcsnoop mdflush execsnoop opensnoop killsnoop statsnoop syncsnoop setuidsnoop mysqld_qslower bashreadline dbslower dbstat mysqlsniff memleak sslsniff gethostlatency deadlock_detector ustat ugc uthreads ucalls uflow argdist trace funccount funclatency stackcount
  • 22.
    # syscount -c-p $(pidof Buggy) # opensnoop -p $(pidof Buggy)
  • 23.
    # funccount -p$(pidof Buggy) …/libcoreclr.so:*GarbageCollect*
  • 24.
    # stackcount -p$(pidof Buggy) …/libcoreclr.so:*GarbageCollect*
  • 25.
  • 26.
    $ COMPlus_EnableEventLog=1 ./myapp #lttng create my-trace # lttng enable-event --userspace --tracepoint DotNetRuntime:* # lttng start
  • 29.
    Plotting data fromGCStats events, original work by Aleksei Vereshchagin at DotNext Saint Petersburg
  • 30.
    🚮 Core Dumps •A core dump is a memory snapshot of a running process • Can be generated on crash or on demand dump file
  • 31.
    Generating Core Dumps •/proc/sys/kernel/core_pattern configures the core file name or application to process the crash • ulimit -c controls maximum core file size (often 0 by default) • gcore (part of gdb) can create a core dump on demand • CoreCLR ships with a createdump utility • There’s also Procdump for Linux 🙀😱
  • 32.
    Analyzing .NET CoreDumps $ lldb /usr/bin/dotnet -c core.1788 (lldb) bt The stuff we care about
  • 33.
    libsosplugin.so (lldb) plugin load…/libsosplugin.so (lldb) setclrpath … DumpObj DumpArray DumpHeap GCRoot PrintException Threads ClrStack EEHeap DumpDomain DumpAssembly
  • 42.
    Checklist: Preparing YourEnvironment export COMPlus_PerfMapEnabled=1 AOT perf map with crossgen, or COMPlus_ZapDisable=1 Debuginfo package for libcoreclr, libc Install perf/BCC tools export COMPlus_EnableEventLog=1 ulimit -c unlimited (or managed by system) Install lldb-3.x
  • 43.
    Summary • We havelearned: To profile CPU activity in .NET Core apps To visualize stack traces (e.g. of CPU samples) using flame graphs To use Linux tracing tools with .NET Core processes To capture .NET Core runtime events using LTTng To generate and analyze core dumps of .NET Core apps
  • 44.
    References • perf andflame graphs • https://perf.wiki.kernel.org/index.php/Main_Page • http://www.brendangregg.com/perf.html • https://github.com/brendangregg/perf-tools • .NET Core diagnostics docs • https://github.com/dotnet/coreclr/blob/master/Do cumentation/project-docs/linux-performance- tracing.md • https://github.com/dotnet/coreclr/blob/master/Do cumentation/building/debugging-instructions.md • My blog posts • http://blogs.microsoft.co.il/sasha/2017/02/26/anal yzing-a-net-core-core-dump-on-linux/ • http://blogs.microsoft.co.il/sasha/2017/02/27/profi ling-a-net-core-application-on-linux/ • http://blogs.microsoft.co.il/sasha/2017/03/30/traci ng-runtime-events-in-net-core-on-linux/ • BCC tutorials • https://github.com/iovisor/bcc/blob/master/docs/t utorial.md • https://github.com/iovisor/bcc/blob/master/docs/t utorial_bcc_python_developer.md • https://github.com/iovisor/bcc/blob/master/docs/r eference_guide.md
  • 45.