
Recommended
Recommended
More Related Content
Similar to Deciding factors of Kickstarter campaigns’s success (Team 6 - Baing, Nguyen, Song, Tran, Wang)
Similar to Deciding factors of Kickstarter campaigns’s success (Team 6 - Baing, Nguyen, Song, Tran, Wang) (20)
Recently uploaded
Recently uploaded (20)
Deciding factors of Kickstarter campaigns’s success (Team 6 - Baing, Nguyen, Song, Tran, Wang)
- 1. Deciding factors of Kickstarter campaigns’s success Team 6 - Baing, Nguyen, Song, Tran, Wang May 2, 2018 Business problems Kickstarter is one of the most popular global crowdfunding platforms. To date, this Brooklyn based corporation has helped to launch over 400,171 million projects in music, film, technology, design, fashion, theater, dance, photography, art, journalism, comics and publishing with the equivalent pleaded amount of 3.66 billion US dollars. Out of over 400 million launched projects, there are only 36% are successfully funded. There are currently over 14 millions active backers who are pleading to invest and bring these projects to live, however Kickstarters funding model is all or nothing which means if the campaign doesn’t reach the goal, the pledged amount is returned to backers. Therefore, it is important for creators to know what enhance or offset their likelihood of success when they launch their projects on Kickstarter. There are many factors that can affect the chance of a project getting funded. These factors could be variables like the category of the project, how long the campaign live on the site, goal, number of backers, whether or not it is a popular project and is featured in the discovery page etc. We are interested in finding what factors are significant in determining whether or not the project would be successfully funded. Within those variables, we also aim to find which variables have more effect on the project success (success=1). By using a fitted Logistic Model with selected variables, we will predict the likelihood of success for over 3,000 ongoing campaigns. Our goals are to encourage entrepreneurship and help entrepreneurs to develop their ideas into a real business by increasing the chance of their projects to be funded. By figuring out the important factors for a project to be successfully funded, the entrepreneurs can better allocate their time and energy on aspects that drive up the successful rate of being fully funded, and better manage the risks and challenges. Spreading entrepreneurs’ideas and improving the success rate create win-win situations for both backers and entrepreneurs. Dataset introduction The data used here is from https://s3.amazonaws.com/weruns/forfun/Kickstarter/Kickstarter_ 2018-02-15T03_20_44_743Z.zip. “Web robots” which is a data scraping website which has been collecting Kickstarter campaign’s data from 2009 to 2018. There are a total of 48 files in the zip file. Combining all files amounts to around 190,000 observations. The observations have their date and time format in unix format with certain columns having unfiltered data that needs to be cleaned. Not all variables can be used as predictors as some do not contribute towards the response variable. Here, we remove those variables/columns. The date and time variables are converted into normal data and time format in R while the campaign categories are extracted from a huge string of unfiltered data using R packages. There are a total of 128 categories in the dataset which are grouped into 15 major categories. “Campaign name” variable is converted to “Campaign Name length” variable to find out the effect of length of a campaign’s success. The response variable is categorical with two outputs that are converted to a boolean binomial variable for VIF calculation. Our output variable is binary: a campaign can either succeed or fail. Following are the predictors which we think are important according to our business knowledge: 1) Number of backers - numbers of investors that have backed 2) Pledged Amount - the amount of money backers have pledged to fund the project if the campaign goal is met (integer) 3) Goal- the amount of money that the creators need to complete their projects (double) 4) Campaign Category (15 Categories) - all projects fall into 5) Difference between deadline and launch date - the duration of the campaign on Kickstarter site (integer) 6) Campaign 1
- 2. Name Length (integer) 7) Staff Pick - whether or not the project was a Kickstarter “staff pick” project and published in “Projects We Love discover page” ( T/F - Binary) We find out the importance of these variables, mainly the “Campaign categories” and try to predict the probability of success of a live campaign. Methods/specifications 1.Multicollinearity Test We first test our predictors for Multicollinearity. According to the plot, there can be no multicollinearity among our categories as they are mutually exclusive. Actually, in the Kickstarter’s requirements, each project could be categorized in one kind/category only - if one project is listed in photography, it could not be listed in another category. Let’s Run an OLS model just to check multicollinearity. lm.fit=lm(boolop ~ goal + date.difference + name.length+ backers_count + converted_pledged_amount + staf summary(lm.fit) ## ## Call: ## lm(formula = boolop ~ goal + date.difference + name.length + ## backers_count + converted_pledged_amount + staff_pick, data = ops) ## ## Residuals: ## Min 1Q Median 3Q Max ## -3.0483 -0.5006 0.1395 0.4446 0.9652 ## ## Coefficients: ## Estimate Std. Error t value Pr(>|t|) ## (Intercept) 5.027e-01 3.968e-03 126.663 < 2e-16 *** ## goal -1.336e-08 9.891e-10 -13.504 < 2e-16 *** ## date.difference -2.796e-03 8.678e-05 -32.223 < 2e-16 *** ## name.length 3.562e-03 7.030e-05 50.666 < 2e-16 *** ## backers_count 2.371e-05 1.737e-06 13.649 < 2e-16 *** ## converted_pledged_amount 1.133e-07 1.992e-08 5.688 0.0000000129 *** ## staff_pickTRUE 3.387e-01 3.257e-03 104.014 < 2e-16 *** ## --- ## Signif. codes: 0 '***' 0.001 '**' 0.01 '*' 0.05 '.' 0.1 ' ' 1 ## ## Residual standard error: 0.4698 on 175815 degrees of freedom ## Multiple R-squared: 0.09073, Adjusted R-squared: 0.09069 ## F-statistic: 2924 on 6 and 175815 DF, p-value: < 2.2e-16 Testing for Condition Index and VIF: collin.diag = colldiag(mod=lm.fit, scale=T, center=T, add.intercept=F) collin.diag ## Condition ## Index Variance Decomposition Proportions ## goal date.difference name.length backers_count ## 1 1.000 0.000 0.000 0.002 0.086 ## 2 1.346 0.042 0.340 0.502 0.003 ## 3 1.349 0.473 0.194 0.165 0.001 2
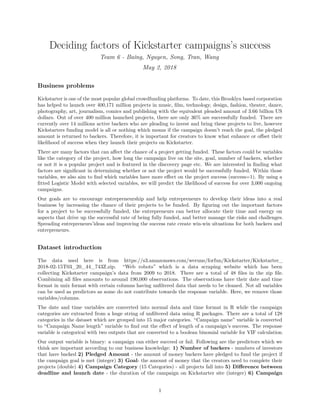
- 3. ## 4 1.384 0.485 0.406 0.038 0.001 ## 5 1.420 0.000 0.060 0.292 0.004 ## 6 3.152 0.000 0.000 0.001 0.905 ## converted_pledged_amount staff_pick ## 1 0.086 0.028 ## 2 0.002 0.069 ## 3 0.001 0.132 ## 4 0.001 0.088 ## 5 0.006 0.682 ## 6 0.904 0.000 vif(lm.fit) ## goal date.difference name.length ## 1.000777 1.001391 1.004255 ## backers_count converted_pledged_amount staff_pick ## 2.950967 2.945734 1.026015 Results:The CI and VIF test shows satisfactory results of no multicollinearity among the predictors. 2.Random Forests To check the level of importance of categories on the output we run Random Forests and find out the most to least important variables. train = sample(1:nrow(ops), 0.7*nrow(ops)) rf.ops<-randomForest(boolop ~ backers_count + converted_pledged_amount +date.difference + staff_pick + g ## Warning in randomForest.default(m, y, ...): The response has five or fewer ## unique values. Are you sure you want to do regression? varImpPlot(rf.ops) 3
- 4. theater crafts photography fashion publishing flim.video journalism art comics design name.length dance staff_pick music games food date.difference technology backers_count converted_pledged_amount pledged goal 0 600 %IncMSE dance photography theater comics crafts journalism design flim.video music publishing games art fashion food name.length date.difference staff_pick technology pledged converted_pledged_amount goal backers_count 0 3000 IncNodePurity rf.ops importance(rf.ops) ## %IncMSE IncNodePurity ## backers_count 45.050469 4293.156220 ## converted_pledged_amount 49.427067 2783.938618 ## date.difference 13.248514 54.547411 ## staff_pick 7.858096 73.751426 ## goal 801.217135 2985.185864 ## pledged 120.346165 2417.040059 ## name.length 6.855712 28.828003 ## art 4.751565 3.800586 ## comics 5.321982 1.639021 ## crafts -2.021478 1.807227 ## dance 7.162908 1.408357 ## design 5.755021 2.176112 ## fashion 3.015748 4.245275 ## flim.video 4.158676 2.881814 ## food 11.847136 18.352439 ## games 11.607178 3.751879 ## journalism 4.183365 2.047417 ## music 8.536983 3.464541 ## photography -1.525048 1.442306 ## publishing 3.519651 3.629353 ## technology 27.408149 74.377284 ## theater -3.994814 1.567899 Results: We find out that “goal” appears to be the most important variable while “photography” is one of 4
- 5. the least important. 3.Ridge Regression Now we have a rough idea of the level of importance of each variable. So we run Ridge Regression to check if the results match. Additionally, the least important categorical variable photography is used as a reference variable. x<-model.matrix(boolop ~ goal + date.difference + name.length+ backers_count + converted_pledged_amount y<-(ops$boolop) ridge.mod<-glmnet(x,y,alpha=0,family="binomial") plot(ridge.mod) 0 2 4 6 8 10 −1.0−0.50.00.51.0 L1 Norm Coefficients 21 21 21 21 21 21 cv.10Fold=cv.glmnet(x,y,alpha=0) cbind("Lambda"=cv.10Fold$lambda, "10-Fold MSE"=cv.10Fold$cvm) ## Lambda 10-Fold MSE ## [1,] 126.64214876 0.2427229 ## [2,] 115.39160931 0.2421852 ## [3,] 105.14053677 0.2421289 ## [4,] 95.80014126 0.2420714 ## [5,] 87.28952075 0.2420084 ## [6,] 79.53496030 0.2419395 ## [7,] 72.46929364 0.2418641 ## [8,] 66.03132132 0.2417816 ## [9,] 60.16528073 0.2416914 5
- 6. ## [10,] 54.82036301 0.2415928 ## [11,] 49.95027305 0.2414851 ## [12,] 45.51282846 0.2413674 ## [13,] 41.46959422 0.2412390 ## [14,] 37.78554977 0.2410989 ## [15,] 34.42878567 0.2409460 ## [16,] 31.37022724 0.2407795 ## [17,] 28.58338271 0.2405981 ## [18,] 26.04411377 0.2404006 ## [19,] 23.73042648 0.2401859 ## [20,] 21.62228080 0.2399526 ## [21,] 19.70141696 0.2396993 ## [22,] 17.95119738 0.2394246 ## [23,] 16.35646248 0.2391270 ## [24,] 14.90339943 0.2388049 ## [25,] 13.57942250 0.2384569 ## [26,] 12.37306404 0.2380813 ## [27,] 11.27387513 0.2376766 ## [28,] 10.27233513 0.2372411 ## [29,] 9.35976919 0.2367734 ## [30,] 8.52827309 0.2362720 ## [31,] 7.77064482 0.2357356 ## [32,] 7.08032215 0.2351630 ## [33,] 6.45132584 0.2345531 ## [34,] 5.87820784 0.2339050 ## [35,] 5.35600405 0.2332183 ## [36,] 4.88019141 0.2324926 ## [37,] 4.44664866 0.2317279 ## [38,] 4.05162065 0.2309248 ## [39,] 3.69168584 0.2300841 ## [40,] 3.36372664 0.2292070 ## [41,] 3.06490244 0.2282953 ## [42,] 2.79262495 0.2273514 ## [43,] 2.54453585 0.2263780 ## [44,] 2.31848630 0.2253784 ## [45,] 2.11251836 0.2243562 ## [46,] 1.92484805 0.2233158 ## [47,] 1.75384986 0.2222617 ## [48,] 1.59804267 0.2211989 ## [49,] 1.45607696 0.2201325 ## [50,] 1.32672310 0.2190680 ## [51,] 1.20886068 0.2180109 ## [52,] 1.10146883 0.2169665 ## [53,] 1.00361737 0.2159404 ## [54,] 0.91445877 0.2149377 ## [55,] 0.83322077 0.2139632 ## [56,] 0.75919974 0.2130215 ## [57,] 0.69175452 0.2121165 ## [58,] 0.63030096 0.2112518 ## [59,] 0.57430676 0.2104302 ## [60,] 0.52328693 0.2096541 ## [61,] 0.47679956 0.2089250 ## [62,] 0.43444200 0.2082440 ## [63,] 0.39584737 0.2076115 6
- 7. ## [64,] 0.36068138 0.2070273 ## [65,] 0.32863944 0.2064906 ## [66,] 0.29944402 0.2060002 ## [67,] 0.27284224 0.2055545 ## [68,] 0.24860369 0.2051515 ## [69,] 0.22651842 0.2047889 ## [70,] 0.20639515 0.2044643 ## [71,] 0.18805957 0.2041749 ## [72,] 0.17135288 0.2039183 ## [73,] 0.15613036 0.2036915 ## [74,] 0.14226017 0.2034921 ## [75,] 0.12962217 0.2033173 ## [76,] 0.11810689 0.2031647 ## [77,] 0.10761460 0.2030319 ## [78,] 0.09805442 0.2029167 ## [79,] 0.08934353 0.2028172 ## [80,] 0.08140650 0.2027314 ## [81,] 0.07417457 0.2026577 ## [82,] 0.06758511 0.2025944 ## [83,] 0.06158103 0.2025402 ## [84,] 0.05611034 0.2024940 ## [85,] 0.05112565 0.2024545 ## [86,] 0.04658379 0.2024209 ## [87,] 0.04244542 0.2023923 ## [88,] 0.03867468 0.2023680 ## [89,] 0.03523893 0.2023473 ## [90,] 0.03210840 0.2023298 ## [91,] 0.02925598 0.2023149 ## [92,] 0.02665696 0.2023023 ## [93,] 0.02428883 0.2022916 ## [94,] 0.02213108 0.2022825 ## [95,] 0.02016501 0.2022748 ## [96,] 0.01837361 0.2022683 ## [97,] 0.01674135 0.2022627 ## [98,] 0.01525409 0.2022580 ## [99,] 0.01389896 0.2022540 plot(cv.10Fold) # Plot all lambdas vs. MSEs 7
- 8. −4 −2 0 2 4 0.210.220.230.24 log(Lambda) Mean−SquaredError 21 21 21 21 21 21 21 21 21 21 21 21 21 21 21 best.lambda=cv.10Fold$lambda.min; log(best.lambda) ## [1] -4.275941 min.mse=min(cv.10Fold$cvm) cbind("Best Lambda"=best.lambda,"Log(Lambda)"=log(best.lambda),"Best 10FCV MSE"=min.mse) ## Best Lambda Log(Lambda) Best 10FCV MSE ## [1,] 0.01389896 -4.275941 0.202254 #cof<-(predict(ridge.mod,s=best.lambda,type="coefficients")) Let’s check out the coefficients: (predict(ridge.mod,s=best.lambda,type="coefficients")) ## 22 x 1 sparse Matrix of class "dgCMatrix" ## 1 ## (Intercept) 0.7392845663937 ## goal -0.0000002882948 ## date.difference -0.0133100950845 ## name.length 0.0146378089853 ## backers_count 0.0009553152687 ## converted_pledged_amount 0.0000100094739 ## staff_pickFALSE -0.8132891906517 ## staff_pickTRUE 0.8123502571619 ## art -0.1958158402733 ## comics 0.7096137035405 ## crafts -0.1513872618515 8
- 9. ## dance 1.2399057258460 ## design 0.4052340914653 ## fashion -0.5019103086745 ## flim.video 0.3010883737987 ## food -0.8090250738321 ## games 0.2203254660493 ## journalism -0.9622042123386 ## music 0.5780717283194 ## publishing 0.5946796011153 ## technology -0.9767070739998 ## theater 0.8625102834924 Let’s check out the coefficient plot: ridge.mod2<-glmnet(x,y,alpha=0,family='binomial',lambda=best.lambda) coefplot(ridge.mod2) ## Warning: Removed 22 rows containing missing values (geom_errorbarh). ## Warning: Removed 22 rows containing missing values (geom_errorbarh). (Intercept) goal date.difference name.length backers_count converted_pledged_amount staff_pickFALSE staff_pickTRUE art comics crafts dance design fashion flim.video food games journalism music publishing technology theater −1.0 −0.5 0.0 0.5 1.0 Value Coefficient Coefficient Plot Results: Ridge Regression gives the effect of Predictors on the success of response variable: positive coefficients improve the probability of success while negative coefficients reduce it. Following predictors contribute positively towards the success of a campaign with respect to campaign category photography, in a decreasing order of importance: 1) Dance 2) Theater 3) Comics 4) Publishing 5) Music 6) Design 7) Film & video 8) Games Following predictors contribute negatively towards the success of a campaign with respect to campaign 9
- 10. category photography: 1) Technology 2) Journalism 3) food 4) Fashion 5) Art 6) Crafts Following general predictors contribute towards success of a campaign: 1)Staff Pick - True 2)Staff Pick - False The “Staff Pick” is somewhat significant in contributing towards success of a campaign while other predictors like “Pledged Amount”, Backers Count“,”name Length“,”Difference between launch date and deadline and “Goal Amount” have no effect on the probability of success according to this method. 4.Logistic Model Now, we fit a Logistic Model and test it using Confusion Matrix. logistic.fit = glm( boolop ~ goal + date.difference + name.length+ backers_count + converted_pledged_amo ## Warning: glm.fit: fitted probabilities numerically 0 or 1 occurred summary(logistic.fit) ## ## Call: ## glm(formula = boolop ~ goal + date.difference + name.length + ## backers_count + converted_pledged_amount + staff_pick + art + ## comics + crafts + dance + design + fashion + flim.video + ## food + games + journalism + music + publishing + technology + ## theater, family = binomial(link = "logit"), data = ops) ## ## Deviance Residuals: ## Min 1Q Median 3Q Max ## -8.4904 -0.4252 0.0015 0.4338 8.4904 ## ## Coefficients: ## Estimate Std. Error z value Pr(>|z|) ## (Intercept) -0.424187243 0.041128923 -10.314 < 2e-16 *** ## goal -0.000185801 0.000001734 -107.121 < 2e-16 *** ## date.difference -0.011400929 0.000562606 -20.265 < 2e-16 *** ## name.length 0.006010506 0.000493338 12.183 < 2e-16 *** ## backers_count 0.039314573 0.000434350 90.513 < 2e-16 *** ## converted_pledged_amount 0.000275495 0.000004426 62.248 < 2e-16 *** ## staff_pickTRUE 0.057065520 0.034104189 1.673 0.094274 . ## art -0.085436709 0.039720898 -2.151 0.031482 * ## comics 0.033819395 0.051496494 0.657 0.511353 ## crafts 0.058971934 0.047193891 1.250 0.211458 ## dance 1.258774315 0.066437561 18.947 < 2e-16 *** ## design -0.204054953 0.055321204 -3.689 0.000226 *** ## fashion -0.507388561 0.048733470 -10.412 < 2e-16 *** ## flim.video 0.382472403 0.039006422 9.805 < 2e-16 *** ## food -0.759609780 0.046815586 -16.226 < 2e-16 *** ## games -0.436522026 0.049686105 -8.786 < 2e-16 *** ## journalism -0.632651126 0.054740419 -11.557 < 2e-16 *** ## music 0.342081944 0.038353244 8.919 < 2e-16 *** ## publishing 0.428364353 0.040587915 10.554 < 2e-16 *** ## technology -1.215911902 0.047985101 -25.339 < 2e-16 *** ## theater 0.862946027 0.051739868 16.679 < 2e-16 *** ## --- ## Signif. codes: 0 '***' 0.001 '**' 0.01 '*' 0.05 '.' 0.1 ' ' 1 10
- 11. ## ## (Dispersion parameter for binomial family taken to be 1) ## ## Null deviance: 238600 on 175821 degrees of freedom ## Residual deviance: 97839 on 175801 degrees of freedom ## AIC: 97881 ## ## Number of Fisher Scoring iterations: 13 Results: Logistic Regression shows a majority of the variables to be significant with a low Residual deviance. The coefficients depict log odds. Negative log odds depict a probability of less than 50% while positive depict more than 50%. Log odds of zero depict a probability of 50%, meaning no effect on output. Cross-validation 1) Training sample of 70% of the data: train=sample(1:nrow(ops), 0.7*nrow(ops)) 2) Testing sample of 30% of the data: test=seq(1:nrow(ops))[-train] 3) Fitting a Logistic Model using training sub-sample: ops.fit.train = glm(boolop ~ goal + date.difference + name.length+ backers_count + converted_pledged_amo ## Warning: glm.fit: fitted probabilities numerically 0 or 1 occurred 4) Predicting probabilities using test data: ops.probs.test=predict(ops.fit.train, ops, type="response")[test] ops.pred.test = ifelse(ops.probs.test>0.5, 1,0) 5) Creating a Confusion Matrix and checking classification fit statistics: conf.mat.ops <- table(ops.pred.test, "Actual"=ops$boolop[test]) # Cross-tab prediction vs. actual conf.mat.ops # Display confusion matrix ## Actual ## ops.pred.test 0 1 ## 0 20273 1905 ## 1 1758 28811 TruN=conf.mat.ops[1,1]; TruP=conf.mat.ops[2,2] # True negatives and positives FalN=conf.mat.ops[1,2]; FalP=conf.mat.ops[2,1] # False negatives and positives TotN=conf.mat.ops[1,1] + conf.mat.ops[2,1] # Total negatives TotP=conf.mat.ops[1,2] + conf.mat.ops[2,2] Tot=TotN+TotP # Total observations Accuracy.Rate=(TruN+TruP)/Tot; Error.Rate=(FalN+FalP)/Tot Sensitivity=TruP/TotP; Specificity=TruN/TotN; FalP.Rate = 1- Specificity logit.rates.50=c(Error.Rate, Sensitivity, Specificity, FalP.Rate) names(logit.rates.50)=c("Error Rate", "Sensitivity", "Specificity", "False Positives") logit.rates.50 ## Error Rate Sensitivity Specificity False Positives ## 0.06944471 0.93798021 0.92020335 0.07979665 Results:The model is trained on 70% of the data and tested on the remaining 30%. The Sensitivity and Specificity for this model are very high with a low False Positive and Error Rate. As such, this model has a near perfect fit. 11
- 12. We use the previously created Logistic Model to predict the probability of success of live campaigns. The live campaign data: live<- read.csv("newlive.csv", header=T) response<-predict(logistic.fit, newdata = live) odds <- exp(response) ProbOfSuccess<- odds/(odds+1) live<-cbind(live, ProbOfSuccess) live[1:5,] ## X.2 X.1 X backers_count converted_pledged_amount country fx_rate ## 1 1 215 215 21 644 MX 0.05393109 ## 2 2 216 216 24 634 US 1.00000000 ## 3 3 217 217 51 2182 CA 0.80059885 ## 4 4 218 218 34 433 US 1.00000000 ## 5 5 219 219 222 8299 US 1.00000000 ## goal pledged staff_pick state usd_pledged Cleaned_Category name.length ## 1 5700 11950 FALSE live 633.9715 art_illustration 33 ## 2 500 634 FALSE live 634.0000 art_illustration 48 ## 3 2500 2726 FALSE live 2187.8624 art_illustration 16 ## 4 360 433 FALSE live 433.0000 art_illustration 48 ## 5 2000 8299 TRUE live 8299.0000 art_illustration 41 ## date.difference art comics crafts dance design fashion flim.video food ## 1 30 1 0 0 0 0 0 0 0 ## 2 30 1 0 0 0 0 0 0 0 ## 3 35 1 0 0 0 0 0 0 0 ## 4 60 1 0 0 0 0 0 0 0 ## 5 60 1 0 0 0 0 0 0 0 ## games journalism music photography publishing technology theater ## 1 0 0 0 0 0 0 0 ## 2 0 0 0 0 0 0 0 ## 3 0 0 0 0 0 0 0 ## 4 0 0 0 0 0 0 0 ## 5 0 0 0 0 0 0 0 ## Grouped.Category ProbOfSuccess ## 1 art 0.3297429 ## 2 art 0.6135277 ## 3 art 0.7907052 ## 4 art 0.6186733 ## 5 art 0.9999418 Here, we have only shown 5 predictions due to paper’s space contraint but the entire validation set has 6533 observations.The “ProbOfSuccess”" variable shows the probability of success of a campaign. 5.Classification Tree Logistic Model works fine but let’s try fitting a Classification Tree model: tree.ops=tree(boolop ~ goal + date.difference + name.length+ backers_count + converted_pledged_amount + summary(tree.ops) ## ## Regression tree: ## tree(formula = boolop ~ goal + date.difference + name.length + ## backers_count + converted_pledged_amount + staff_pick + art + 12
- 13. ## comics + crafts + dance + design + fashion + flim.video + ## food + games + journalism + music + publishing + technology + ## theater, data = ops) ## Variables actually used in tree construction: ## [1] "backers_count" "goal" ## [3] "converted_pledged_amount" ## Number of terminal nodes: 11 ## Residual mean deviance: 0.04777 = 8398 / 175800 ## Distribution of residuals: ## Min. 1st Qu. Median Mean 3rd Qu. Max. ## -0.953800 -0.001703 0.046180 0.000000 0.046180 0.998300 plot(tree.ops); text(tree.ops, pretty=0) | backers_count < 11.5 goal < 676.5 converted_pledged_amount < 99.5converted_pledged_amount < 740.5goal < 3106.5 backers_count < 29.5 goal < 3269.5 converted_pledged_amount < 3497.5 goal < 15265converted_pledged_amount < 15753 0.1106000.8019000.0017030.8507000.082560 0.8894000.0302600.718100 0.953800 0.1369000.938200 Logistic Model drops a few variables which are important according to Business knowledge. Thus, we go with Logistic Regression in this case. Conclusion For this project, we focused on finding what variables enhance or offset the likelihood of whether or not the campaign is successfully funded on Kickstarter. We tried two models which are Classification Tree and Logistic Regression. When we ran Classification Tree, some of the variables were dropped. According to on our business knowledge, we strongly believe all variables are significant, thus, all should be retained. We used Random Forests, Ridge Regression for variables selection, Condition Index/variance inflation factors to test the multicollinearity and Confusion Matrix to check classification fit statistics. We applied our fitted Logistic Model to a new dataset of on-going projects to predict their likelihood of success. 13
- 14. Two main challenges we faced were the large dataset and the binary response variable. The dataset contains over 190,000 observations which resulted time-consuming data cleaning process. Some of the time variables were in unix format instead of dd/mm/yyyy and there were a few missing data points. Moreover, with the binary response variable, our choices of models were limited to Logistic Regression and Classification Tree only. References: 1.Kickstarter Stats. (n.d.). Retrieved May 02, 2018, from https://www.kickstarter.com/help/stats 14