SlideShare a Scribd company logo
1 of 2
Download to read offline
Number of police officers per 1,000 people
in Camden, Trenton, and Newark from 1989-2012
0
1
2
3
4
5
6
7
8
Trenton City
Newark City
Camden City
2011
1990 1995 2000 2005 2010
Camden City Crime Trends per 100,000 people
from 1989-2014
1990 1995 2000 2005 2010
0
3,000
6,000
9,000
12,000
15,000
18,000
Nonviolent Crime
Violent Crime
Crime Index
1995
2011
2014
KNOW YOUR CITY
Camden City Crime Trends from 1989 to 2014
Crime patterns in Camden reflect national trends as well as local events such as budget cuts
and police department restructuring.
When examining Camden crime
trends, it’s important to look at long-
term patterns, not just the last few
years, and to compare Camden data to
that of other similar geographic areas.
On an annual basis, the FBI Uniform
Crime Reports compile the crime index,
an aggregated statistic that provides a
standardized measure which allows us
to compare crime data year-to-year,
and across the United States. In line
with national trends (see Page 2),
Camden crime sharply decreased from
1995 until 2000. Nonviolent crime
decreased very gradually until 2011,
while violent crime increased slowly in
that span.
In 2011, budget cuts caused massive
layoffs in the Camden City Police
Department, and other cities in New
Jersey, including Newark and Trenton,
have done the same to combat declin-
ing state aid and tax revenue. From
2010 to 2011, the number of Camden
police officers fell from 366 to 265, and
the total number of all employees
dropped from 452 to 314. Also in 2011,
the crime index (+23.8%), violent
(+16.9%), and nonviolent crime
(+27.5%) increased – although it is
important to note that we can’t defini-
tively conclude that the layoffs caused
these results.
1
2
3
The crime index can include murder, manslaughter, rape, robbery, aggravated
assault, burglary, larceny, and motor vehicle theft. Violent crime, a segment of
that measurement, involves the use of force while nonviolent crime does not.
Levels of police officers per 1,000 residents had been increasing steadily in
Camden, but then dropped sharply by 2011, a trend that was mirrored in Trenton
and Newark as well.
Data Source: New Jersey Uniform Crime
Reports 1989 - 2014
http://www.njsp.org/info/stats.html
Violent Crimes
1990 1995 2000 2005 2010
0
500
1,000
1,500
2,000
2,500
3,000
3,500
4,000
4,500 New Jersey
Trenton City
Newark City
Camden City
1995
2011
2014
Crime Index
0
3,000
6,000
9,000
12,000
15,000
18,000 New Jersey
Trenton City
Newark City
Camden City
2011
2014
1995
1990 1995 2000 2005 2010
Homicides
0
20
40
60
80
100 New Jersey
Trenton City
Newark City
Camden City
2011
2014
1995
1990 1995 2000 2005 2010
New Jersey
Trenton
Newark
Camden City
Homicides, Crime Index, and
Violent Crimes per 100,000 people
from 1989 - 2014
In 2013, the Camden City Police Depart-
ment was disbanded in favor of a new
Camden County Police Department, a
move which made national news, and was
met with both support and criticism.
From 2012-2014, the Camden crime
index, violent crime, nonviolent crime,
and homicide rates showed a decreasing
trend compared to the peak of 2011.
Compared to 2013, homicide (-42.1%),
crime index (-15.6%), and violent
(-20.5%)/nonviolent crime (-12.7%)
rates lowered in 2014, but we can’t say for
sure that this was a direct result of the
police restructuring.
Crime across the US has been on the
decline since the 1980s due to a host of
factors, and crime in New Jersey cities
have followed a similar pattern. Violent
crime has followed this trend, but homi-
cides, however, have either stayed flat over
the last 25 years, or slightly increased in
the case of Camden or Trenton.
Footnotes:
1.http://www.cna.org/sites/default/files/research/Crime
_Trends.pdf
2.http://www.nj.com/news/index.ssf/2012/05/after_he
avy_police_layoffs_in.html
3. All data is adjusted for population in order to provide a
more consistent comparison across cities and time.
4.http://www.nytimes.com/2012/09/29/nyregion/overr
un-by-crime-camden-trades-in-its-police-force.html?_r=1
For more information, visit: www.CamConnect.org
800 Cooper Street, 7th Fl., Camden NJ 08102 • (856) 365 - 9510 ext. 2027
4

More Related Content

Similar to Police officers per capita and crime trends in Camden from 1989-2014

Law Enforcement Return on Investment in a Comparable Framework: Mason County ...
Law Enforcement Return on Investment in a Comparable Framework: Mason County ...Law Enforcement Return on Investment in a Comparable Framework: Mason County ...
Law Enforcement Return on Investment in a Comparable Framework: Mason County ...Greg Schundler
 
High Point Police Department: Statistical Report 2013 (Focused Deterrence)
High Point Police Department:  Statistical Report 2013 (Focused Deterrence)High Point Police Department:  Statistical Report 2013 (Focused Deterrence)
High Point Police Department: Statistical Report 2013 (Focused Deterrence)Patricia Hall
 
Student #1 I have chosen to write about the history of data anal.docx
Student #1 I have chosen to write about the history of data anal.docxStudent #1 I have chosen to write about the history of data anal.docx
Student #1 I have chosen to write about the history of data anal.docxjohniemcm5zt
 
FBI report compared to crimes in Sweden
FBI report compared to crimes in SwedenFBI report compared to crimes in Sweden
FBI report compared to crimes in SwedenADVICEDERNBACK
 
Item # 4 - 2020 Racial Profiling Report
Item # 4 - 2020 Racial Profiling ReportItem # 4 - 2020 Racial Profiling Report
Item # 4 - 2020 Racial Profiling Reportahcitycouncil
 
CRJ322City Demographic and Crime Trend Analysis ChartCity De
CRJ322City Demographic and Crime Trend Analysis ChartCity DeCRJ322City Demographic and Crime Trend Analysis ChartCity De
CRJ322City Demographic and Crime Trend Analysis ChartCity DeMargenePurnell14
 
Item # 7 2021 Racial Profiling Report
Item # 7   2021 Racial Profiling ReportItem # 7   2021 Racial Profiling Report
Item # 7 2021 Racial Profiling Reportahcitycouncil
 
ARC's 2013 Population Estimates
ARC's 2013 Population EstimatesARC's 2013 Population Estimates
ARC's 2013 Population EstimatesARCResearch
 

Similar to Police officers per capita and crime trends in Camden from 1989-2014 (11)

Law Enforcement Return on Investment in a Comparable Framework: Mason County ...
Law Enforcement Return on Investment in a Comparable Framework: Mason County ...Law Enforcement Return on Investment in a Comparable Framework: Mason County ...
Law Enforcement Return on Investment in a Comparable Framework: Mason County ...
 
High Point Police Department: Statistical Report 2013 (Focused Deterrence)
High Point Police Department:  Statistical Report 2013 (Focused Deterrence)High Point Police Department:  Statistical Report 2013 (Focused Deterrence)
High Point Police Department: Statistical Report 2013 (Focused Deterrence)
 
Student #1 I have chosen to write about the history of data anal.docx
Student #1 I have chosen to write about the history of data anal.docxStudent #1 I have chosen to write about the history of data anal.docx
Student #1 I have chosen to write about the history of data anal.docx
 
Victims of Crime Survey 2015/2016
Victims of Crime Survey 2015/2016Victims of Crime Survey 2015/2016
Victims of Crime Survey 2015/2016
 
Victims of Crime Survey, 2017 - 2018
Victims of Crime Survey, 2017 - 2018Victims of Crime Survey, 2017 - 2018
Victims of Crime Survey, 2017 - 2018
 
FBI report compared to crimes in Sweden
FBI report compared to crimes in SwedenFBI report compared to crimes in Sweden
FBI report compared to crimes in Sweden
 
Item # 4 - 2020 Racial Profiling Report
Item # 4 - 2020 Racial Profiling ReportItem # 4 - 2020 Racial Profiling Report
Item # 4 - 2020 Racial Profiling Report
 
CRJ322City Demographic and Crime Trend Analysis ChartCity De
CRJ322City Demographic and Crime Trend Analysis ChartCity DeCRJ322City Demographic and Crime Trend Analysis ChartCity De
CRJ322City Demographic and Crime Trend Analysis ChartCity De
 
Item # 7 2021 Racial Profiling Report
Item # 7   2021 Racial Profiling ReportItem # 7   2021 Racial Profiling Report
Item # 7 2021 Racial Profiling Report
 
Compstat
CompstatCompstat
Compstat
 
ARC's 2013 Population Estimates
ARC's 2013 Population EstimatesARC's 2013 Population Estimates
ARC's 2013 Population Estimates
 

Police officers per capita and crime trends in Camden from 1989-2014

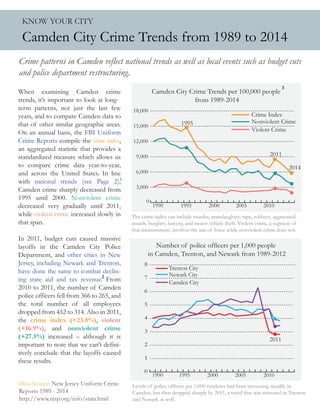
  • 1. Number of police officers per 1,000 people in Camden, Trenton, and Newark from 1989-2012 0 1 2 3 4 5 6 7 8 Trenton City Newark City Camden City 2011 1990 1995 2000 2005 2010 Camden City Crime Trends per 100,000 people from 1989-2014 1990 1995 2000 2005 2010 0 3,000 6,000 9,000 12,000 15,000 18,000 Nonviolent Crime Violent Crime Crime Index 1995 2011 2014 KNOW YOUR CITY Camden City Crime Trends from 1989 to 2014 Crime patterns in Camden reflect national trends as well as local events such as budget cuts and police department restructuring. When examining Camden crime trends, it’s important to look at long- term patterns, not just the last few years, and to compare Camden data to that of other similar geographic areas. On an annual basis, the FBI Uniform Crime Reports compile the crime index, an aggregated statistic that provides a standardized measure which allows us to compare crime data year-to-year, and across the United States. In line with national trends (see Page 2), Camden crime sharply decreased from 1995 until 2000. Nonviolent crime decreased very gradually until 2011, while violent crime increased slowly in that span. In 2011, budget cuts caused massive layoffs in the Camden City Police Department, and other cities in New Jersey, including Newark and Trenton, have done the same to combat declin- ing state aid and tax revenue. From 2010 to 2011, the number of Camden police officers fell from 366 to 265, and the total number of all employees dropped from 452 to 314. Also in 2011, the crime index (+23.8%), violent (+16.9%), and nonviolent crime (+27.5%) increased – although it is important to note that we can’t defini- tively conclude that the layoffs caused these results. 1 2 3 The crime index can include murder, manslaughter, rape, robbery, aggravated assault, burglary, larceny, and motor vehicle theft. Violent crime, a segment of that measurement, involves the use of force while nonviolent crime does not. Levels of police officers per 1,000 residents had been increasing steadily in Camden, but then dropped sharply by 2011, a trend that was mirrored in Trenton and Newark as well. Data Source: New Jersey Uniform Crime Reports 1989 - 2014 http://www.njsp.org/info/stats.html
  • 2. Violent Crimes 1990 1995 2000 2005 2010 0 500 1,000 1,500 2,000 2,500 3,000 3,500 4,000 4,500 New Jersey Trenton City Newark City Camden City 1995 2011 2014 Crime Index 0 3,000 6,000 9,000 12,000 15,000 18,000 New Jersey Trenton City Newark City Camden City 2011 2014 1995 1990 1995 2000 2005 2010 Homicides 0 20 40 60 80 100 New Jersey Trenton City Newark City Camden City 2011 2014 1995 1990 1995 2000 2005 2010 New Jersey Trenton Newark Camden City Homicides, Crime Index, and Violent Crimes per 100,000 people from 1989 - 2014 In 2013, the Camden City Police Depart- ment was disbanded in favor of a new Camden County Police Department, a move which made national news, and was met with both support and criticism. From 2012-2014, the Camden crime index, violent crime, nonviolent crime, and homicide rates showed a decreasing trend compared to the peak of 2011. Compared to 2013, homicide (-42.1%), crime index (-15.6%), and violent (-20.5%)/nonviolent crime (-12.7%) rates lowered in 2014, but we can’t say for sure that this was a direct result of the police restructuring. Crime across the US has been on the decline since the 1980s due to a host of factors, and crime in New Jersey cities have followed a similar pattern. Violent crime has followed this trend, but homi- cides, however, have either stayed flat over the last 25 years, or slightly increased in the case of Camden or Trenton. Footnotes: 1.http://www.cna.org/sites/default/files/research/Crime _Trends.pdf 2.http://www.nj.com/news/index.ssf/2012/05/after_he avy_police_layoffs_in.html 3. All data is adjusted for population in order to provide a more consistent comparison across cities and time. 4.http://www.nytimes.com/2012/09/29/nyregion/overr un-by-crime-camden-trades-in-its-police-force.html?_r=1 For more information, visit: www.CamConnect.org 800 Cooper Street, 7th Fl., Camden NJ 08102 • (856) 365 - 9510 ext. 2027 4