This series explains A/B tests on online services. It covers the statistics of A/B tests, the A/B tests on distributed application, and the architecture of Online Experiment As a Service.
Online A-B Tests
FromStatistics to Distributed Systems
Part 1. Applied Statistics
Ming Lei
2019/11
2.
The Statistics andConcepts
• Problem Structure in Statistics
• Formal Statistical Methodologies
• Hypothesis Testing: Superiority test, Non-inf test
• Two-sampled T-Tests: 1-tail vs. 2-tail, paired vs. unpaired
• A/B Test vs. Multi-treatments Test
• Power Analysis
• Is the sample set large enough?
• How MSZ relates to lift, std-dev and mean of population
• Sampling vs. Activation
• Activation is ultimately on impressions –- where end users interacts with computer
programs
3.
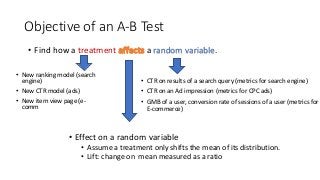
Objective of anA-B Test
• Effect on a random variable
• Assume a treatment only shifts the mean of its distribution.
• Lift: change on mean measured as a ratio
• Find how a treatment a random variable.
• CTR on results of a search query (metrics for search engine)
• CTR on an Ad impression (metrics for CPC ads)
• GMB of a user, conversion rate of sessions of a user (metrics for
E-commerce)
• New ranking model (search
engine)
• New CTR model (ads)
• New item view page (e-
comm
4.
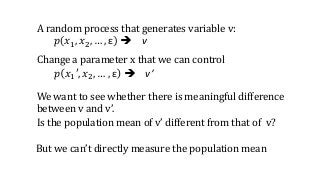
A random processthat generates variable v:
𝑝 𝑥1, 𝑥2, … , ε v
Change a parameter x that we can control
𝑝 𝑥1′, 𝑥2, … , ε v’
We want to see whether there is meaningful difference
between v and v’.
Is the population mean of v’ different from that of v?
But we can’t directly measure the population mean
5.
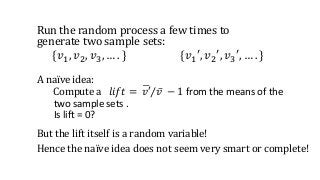
Run the randomprocess a few times to
generate two sample sets:
{𝑣1, 𝑣2, 𝑣3, … . } {𝑣1′, 𝑣2′, 𝑣3′, … . }
But the lift itself is a random variable!
Hence the naïve idea does not seem very smart or complete!
A naïve idea:
Compute a 𝑙𝑖𝑓𝑡 = 𝑣′ 𝑣 − 1 from the means of the
two sample sets .
Is lift = 0?
6.
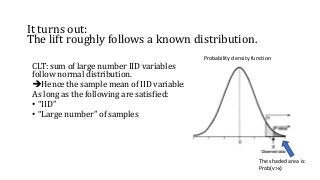
It turns out:
Thelift roughly follows a known distribution.
CLT: sum of large number IID variables
follow normal distribution.
Hence the sample mean of IID variables
As long as the following are satisfied:
• “IID”
• “Large number” of samples
Probability density function
The shaded area is:
Prob(v>x)
7.
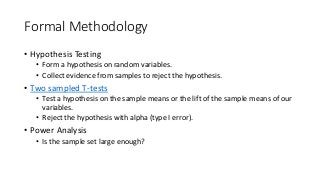
Formal Methodology
• HypothesisTesting
• Form a hypothesis on random variables.
• Collect evidence from samples to reject the hypothesis.
• Two sampled T-tests
• Test a hypothesis on the sample means or the lift of the sample means of our
variables.
• Reject the hypothesis with alpha (type I error).
• Power Analysis
• Is the sample set large enough?
8.
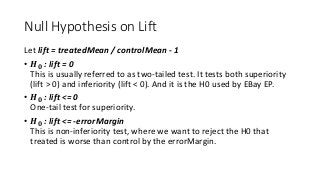
Null Hypothesis onLift
Let lift = treatedMean / controlMean - 1
• 𝑯 𝟎 : lift = 0
This is usually referred to as two-tailed test. It tests both superiority
(lift > 0) and inferiority (lift < 0). And it is the H0 used by EBay EP.
• 𝑯 𝟎 : lift <= 0
One-tail test for superiority.
• 𝑯 𝟎 : lift <= -errorMargin
This is non-inferiority test, where we want to reject the H0 that
treated is worse than control by the errorMargin.
9.
Assumptions of T-Test
•Mean of the two populations being compared should follow a normal
distribution
• Implied by the assumption of Central Limit Theorem:
sum/mean of large number of IID (independent and identical distributed)
variables tend to follow Normal Distribution.
• The two populations being compared should have the same variance
• Implied by the assumption that treatment only changes mean of the
population.
• Variables are sampled independently
• This implies that the metric computation has to be consistent with the serving
time treatment assignment [session scope metrics is not consistent with
assigning guids to treatments].
10.
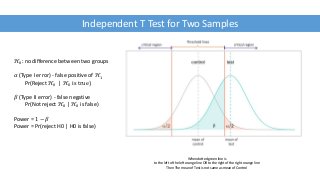
Independent T Testfor Two Samples
ℋ0: no difference between two groups
𝛼 (Type I error) - false positive of ℋ1
Pr(Reject ℋ0 | ℋ0 is true)
𝛽 (Type II error) - false negative
Pr(Not reject ℋ0 | ℋ0 is false)
Power = 1 − 𝛽
Power = Pr(reject H0 | H0 is false)
When dotted green line is
to the left of the left orange line OR to the right of the right orange line
Then The mean of Test is not same as mean of Control
11.
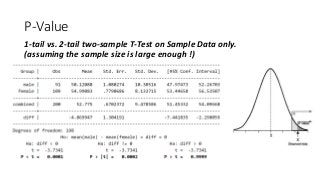
P-Value
1-tail vs. 2-tailtwo-sample T-Test on Sample Data only.
(assuming the sample size is large enough !)
12.
Can we trustP-Value ?!
Can we trust our two-sample T-Test ?!
Can we trust the assumption made by our two-sample T-Test ?!
Is our sample size really large enough?
Power Analysis!
13.
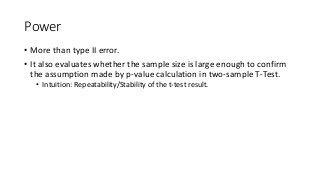
Power
• More thantype II error.
• It also evaluates whether the sample size is large enough to confirm
the assumption made by p-value calculation in two-sample T-Test.
• Intuition: Repeatability/Stability of the t-test result.
14.
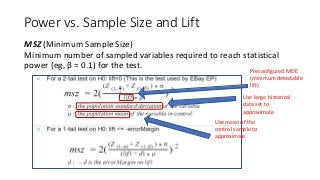
Power vs. SampleSize and Lift
MSZ (Minimum Sample Size)
Minimum number of sampled variables required to reach statistical
power (eg, β = 0.1) for the test.
Use large historical
data set to
approximate
Use mean of the
control sample to
approximate
Preconfigured MDE
(minimum detectable
lift)
15.
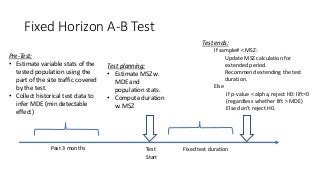
Fixed Horizon A-BTest
Test
Start
Pre-Test:
• Estimate variable stats of the
tested population using the
part of the site traffic covered
by the test.
• Collect historical test data to
infer MDE (min detectable
effect)
Test planning:
• Estimate MSZ w.
MDE and
population stats.
• Compute duration
w. MSZ
Test ends:
If sample# < MSZ:
Update MSZ calculation for
extended period.
Recommend extending the test
duration.
Else
If p-value < alpha, reject H0: lift=0
(regardless whether lift > MDE)
Else don’t reject H0.
Past 3 months Fixed test duration
16.
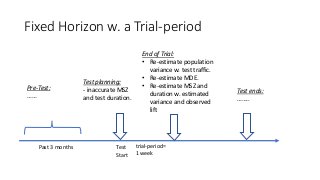
Fixed Horizon w.a Trial-period
Test
Start
Pre-Test:
……
Test planning:
- inaccurate MSZ
and test duration.
trial-period=
1 week
End of Trial:
• Re-estimate population
variance w. test traffic.
• Re-estimate MDE.
• Re-estimate MSZ and
duration w. estimated
variance and observed
lift
Test ends:
……..
Past 3 months
17.
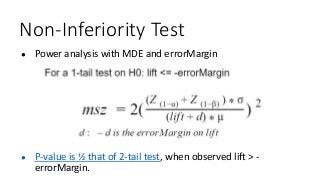
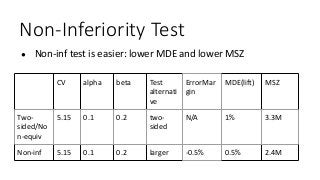
Non-Inferiority Test
● P-valueis ½ that of 2-tail test, when observed lift > -
errorMargin.
● Power analysis with MDE and errorMargin
18.
Non-Inferiority Test
● Non-inftest is easier: lower MDE and lower MSZ
CV alpha beta Test
alternati
ve
ErrorMar
gin
MDE(lift) MSZ
Two-
sided/No
n-equiv
5.15 0.1 0.2 two-
sided
N/A 1% 3.3M
Non-inf 5.15 0.1 0.2 larger -0.5% 0.5% 2.4M
19.
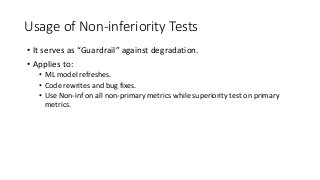
Usage of Non-inferiorityTests
• It serves as “Guardrail” against degradation.
• Applies to:
• ML model refreshes.
• Code rewrites and bug fixes.
• Use Non-inf on all non-primary metrics while superiority test on primary
metrics.
20.
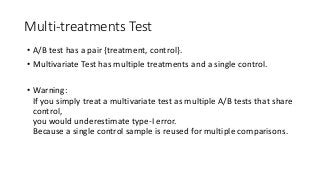
Multi-treatments Test
• A/Btest has a pair {treatment, control}.
• Multivariate Test has multiple treatments and a single control.
• Warning:
If you simply treat a multivariate test as multiple A/B tests that share
control,
you would underestimate type-I error.
Because a single control sample is reused for multiple comparisons.
21.
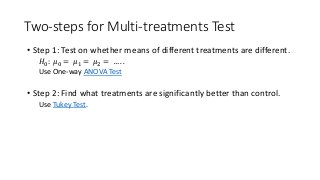
Two-steps for Multi-treatmentsTest
• Step 1: Test on whether means of different treatments are different.
𝐻0: 𝜇0 = 𝜇1 = 𝜇2 = … . .
Use One-way ANOVA Test
• Step 2: Find what treatments are significantly better than control.
Use Tukey Test.
22.
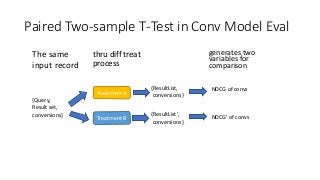
Paired Two-sample T-Testin Conv Model Eval
The same
input record
{Query,
Result set,
conversions}
Treatment A
Treatment B
{ResultList,
conversions}
{ResultList’,
conversions}
NDCG of convs
NDCG’ of convs
thru diff treat
process
generates two
variables for
comparison
23.
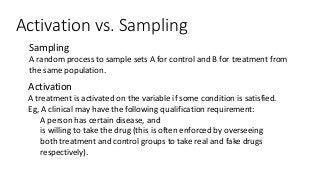
Activation vs. Sampling
●Sampling
A random process to sample sets A for control and B for treatment from
the same population.
● Activation
A treatment is activated on the variable if some condition is satisfied.
Eg, A clinical may have the following qualification requirement:
● A person has certain disease, and
● is willing to take the drug (this is often enforced by overseeing
both treatment and control groups to take real and fake drugs
respectively).
24.
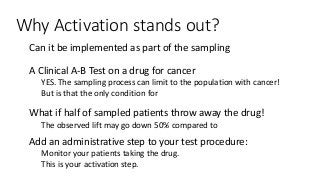
Why Activation standsout?
● Can it be implemented as part of the sampling process?
● A Clinical A-B Test on a drug for cancer
● YES. The sampling process can limit to the population with cancer!
● But is that the only condition for “activation”
● What if half of sampled patients throw away the drug!
● The observed lift may go down 50% compared to the expected.
● Add an administrative step to your test procedure:
● Monitor your patients taking the drug.
● This is your activation step.
25.
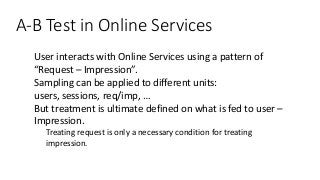
A-B Test inOnline Services
● User interacts with Online Services using a pattern of
“Request – Impression”.
● Sampling can be applied to different units:
users, sessions, req/imp, …
● But treatment is ultimate defined on what is fed to user –
Impression.
● Treating request is only a necessary condition for treating
impression.
26.
Activation in OnlineService A-B Test
● Activation
● Is not checking whether treatment is applied in request processing.
● Is checked on impressions.
● A refreshed ranking model for a search engine
● Every request is processed differently by it than the base model. But
only a small percentage of user impressions (SRPs) are actually
different and hence treated at all.
27.
Test Boundaries inOnline Services
● A component view
● An Online Application has frontend, backend, data store, etc.
● Each component is a self-contained subsystem and runs its own A-B
test.
● It is fine if you understand who your test subjects are
● If subjects are users,
regardless where you treat the requests,
the boundary of your test is the interaction between
application as a whole and users.
![Assumptions of T-Test
• Mean of the two populations being compared should follow a normal
distribution
• Implied by the assumption of Central Limit Theorem:
sum/mean of large number of IID (independent and identical distributed)
variables tend to follow Normal Distribution.
• The two populations being compared should have the same variance
• Implied by the assumption that treatment only changes mean of the
population.
• Variables are sampled independently
• This implies that the metric computation has to be consistent with the serving
time treatment assignment [session scope metrics is not consistent with
assigning guids to treatments].](https://image.slidesharecdn.com/onlineabtest-stats-200301054755/85/Online-A-B-Tests-Part-1-Applied-Statistics-9-320.jpg?cb=1583041934)