1. Introduction:
Teen pregnancy is a problem that persists in this country. What is its cause? Indeed, many things
contribute to this problem including; quality of sex education classes, the general acceptability of sex as a
teenager, location of individuals, social status, income, availability of prophylactics, and many others.
Could it be that religious Republicans are partially the cause of this problem of teen pregnancy? This
could be true due to their inhibition of liberal social policy implementation.
General Model:
It is known that conservatives are the ones to impede more socially liberal policies such as gay
marriage, the rights for minorities, and more open sexual education policies. This inhibition causes many
to continue their life in ignorance of the dangers of engaging in sexual intercourse without the proper
barriers in place, or before one is truly ready to become a parent.
Many factors affect teen pregnancy rate including the amount parents invest in their children, how
educated the parents are, whether or not the children stay in school, where the children live, and what
kind of sex education program they went through. These factors are extremely difficult to capture and
quantify, so instead gathered are variables easier measured that capture most of those quantified with
less ease like Religiosity of a state, the percentage of Republicans in a state, the unemployment rate, the
school dropout rate, the child poverty rate, median income, the percentage of single parents in a given
state, and parent’s education level.
Religiosity is the closest measure this paper has available to quantify the conservativeness of a
state, and an indicative measure of the social acceptability of more socially liberal policies. This means
the more religious a place, the more socially abhorrent is liberal social policy. Religiosity is expected to
inhibit the socially liberal policies, exacerbating teen pregnancy the more religious a state is. Similarly, the
percentage of Republicans in a state is another measure of conservativeness, hopefully capturing what
was not by religion.
Unemployment affects teen pregnancy rates. The relationship between these two aspects is
predicted to be positive. When the unemployment rate increases, this means more people are without
work, decreasing the income of the family. This causes them to live in worse neighborhoods which
generally have less quality schools, meaning worse sex ed. programs.
Another determinant of Teen pregnancy rates is the dropout rate. When children drop out of
school and join the workforce, they could believe they are supposed to assume all responsibilities of an
adult, this includes having sex. This dramatically increases the likelihood of teen pregnancies, because
the more unprotected sex one has, the more likely is the conception of a child.
The child poverty rate is another determinant of teen pregnancy rates. This is because, when you
grow up in poverty, you likely have less of an emphasis on education in the home. This causes teenagers
to continue their life in ignorance to the world. With that, they are unaware of the dangers of sexual
intercourse. This leads to higher teen pregnancy rates. This is explained in large part by the parents
education.
Median income is a strong indicator of parents’ education. When the parents education is greater
their income increases due to the increased investment in human capital. This increase is predicted to be
inversely related to teen pregnancy rates due to the parents’ higher income causing the family to live in a
nicer neighborhood with better schools and thus, better sex education programs.
In a single parent household the parents’ time is divided between caring for the child and keeping
the family solvent. When a single parent needs to support children they take more time to work to
increase income because they are not only responsible for their life, but their child’s too. This causes
them to spend less time with their children. The opportunity cost of being a parent is greater in situations
like these. This causes higher teen pregnancy rates.
Econometric Model:
Below is the first proposed econometric model,
Tpregrt=β0 + β1drprt + β2reppct + β3relig + β4unemp + β5paredu + β6singpar + u
The reason for not including the child poverty rate and median income is the causational
relationship from parents’ education.
Regressions drprt reppct relig unemp paredu Singpar R2
1 5.4846 0.4683
2. (.8435)
2 5.9450
(.8377)
-0.4046
(.1833)
0.5182
3 4.8944
(.8787)
-0.5686
(0.1827)
0.4120
(0.1531)
0.5837
4 4.2884
(1.0184)
-0.4658
(0.2023)
0.3726
(0.1562)
0.4504
(0.3870)
0.5959
5 4.8145
(1.0198)
-0.3035
(0.2118)
0.4723
(0.1591)
0.7517
(0.4034)
0.8704
(0.4329)
0.6299
6 4.2450
(1.2281)
-0.1923
(0.2505)
0.3881
(0.1885)
0.5497
(0.4711)
0.8081
(0.4407)
0.4588
(0.5471)
0.6358
After testing singpar the determined P value is .8386. The reason for testing only this variable and
not unemp is because an F test on unemp and reppct gives us a P value of .007. In regression 6 the
addition of the variable singpar caused all other previously significant variables to become insignificant, or
greatly decreased the statistical significance.
Second regression (interaction):
Tpregrt=β0 + β1reppct + β2relig + β3reppct*relig + β4drprt + β5pareduc+u
Regression reppct relig Reppct*relig drprt pareduc R2
1 -0.0806
(0.2529)
0.002115
2 -0.5054
(0.2335)
0.7909
(0.1756)
0.303009
3 2.0962
(1.3096)
3.0020
(1.1094)
-0.0501
(0.0249)
0.359633
4 0.5625
(1.0970)
1.3903
(0.9480)
-0.0217
(0.0208)
4.6386
(0.9112)
0.593638
5 0.8679
(1.0977)
1.6879
(0.9527)
-0.0263
(0.0207)
5.2755
(0.9859)
0.6451
(0.4142)
0.614868
Practical significance is lacking in the interaction term, for every ten percentage points
Republicans changes, the teen pregnancy rate changes by 2 pregnancies per thousand. Now the
interaction term has been dropped from the next regression.
Third Regression:
Tpregrt = β0 + β1drprt + β2reppct + β3relig + β4unemp + β5educ + u
regression drprt reppct relig unemp educ R2
1 5.4847
(0.8435)
0.468328
2 5.9450
(0.8378)
-0.4047
(0.1834)
0.518249
3 4.8944
(0.8787)
-0.5686
(0.1827)
0.4120
(0.1531)
0.583763
4 4.2884
(1.0185)
-0.4659
(0.2023)
0.3727
(0.1562)
0.4505
(0.3871)
0.595924
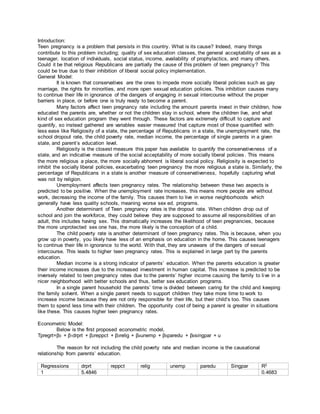
5 4.8145 -0.3035 0.4723 0.7517 0.8704 0.629924
3. (1.0199) (0.2118) (0.1591) (0.4034) (0.4329)
WLS 4.6277
(1.1797)
-0.3443
(0.1744)
0.4419
(0.1753)
1.2373
(0.3871)
0.9005
(0.3952)
0.712837
Data:
The data used was gathered from the United States Census, The Campaign to Stop Teen Pregnancy and
Pew Research Group. All of these are reputable sources.
The Campaign to Stop Teen Pregnancy is staffed by many advisors of executive elected officials.
Their data has been gathered through similar means as the census, their goal is to decrease teen
pregnancy rates in the United States. Their goal is to have the most comprehensive data on teen
pregnancy rates so they can determine how to better prevent it.
Pew Research Center is a nonpartisan "fact tank" with seven different departments focused on
different areas of data. Their goal is to provide the information without the bias that many other sources
have. This has made them a valuable source for many eminent policy-makers, journalists, and
academics.
Some potential problems with this data are the fact that it is comprised of all state averages. This
has potential to be a large problem because when averages are taken of a data set, if there are factions
that are at the two extremes the average falls where no points truly lie. This possibly causes inaccuracies
in the regression. To counteract this we ran a Whites Test for Heteroskedasticity. Finding little evidence
for the presence of heteroskedasticity, no problems were found.
Whites Heteroskedasticity Test found no sign of heteroskedasticity in the data, but since the data
is in aggregates Weighted Least Squares was used for the final regression. This regression now has
complete statistical significance, no variables are statistically insignificant.
Conclusion:
Teen pregnancy rates are not linked to the percentage of republicans in a state, instead they are
positively correlated with the percentage of religious people in a state. This disproves the hypothesis that
it is the religious Republicans who cause the teen pregnancy rates to increase. Instead it is the increased
social conservativeness, measured by religiosity, which causes teen pregnancy rates to increase.
OLS:
DependentVariable:TPRGRT
Method: LeastSquares
Date: 11/20/12 Time:12:14
Sample:1 50
Included observations:50
Variable Coefficient Std. Error t-Statistic Prob.
DRPRT 4.814516 1.019854 4.720791 0.0000
RPPCT -0.303597 0.211801 -1.433406 0.1588
RELIG 0.472334 0.159121 2.968392 0.0048
UNEMP 0.751776 0.403495 1.863161 0.0691
EDUC 0.870473 0.432948 2.010574 0.0505
C -23.15630 27.64379 -0.837667 0.4067
R-squared 0.629924 Mean dependentvar 64.60000
Adjusted R-squared 0.587869 S.D. dependentvar 14.29000
S.E. of regression 9.173808 Akaike info criterion 7.382749
Sum squared resid 3702.985 Schwarz criterion 7.612191
Log likelihood -178.5687 Hannan-Quinn criter. 7.470122
F-statistic 14.97887 Durbin-Watson stat 1.520782