Michael's IUCRL Poster 2014 Close to Final with CDW edits
1. Correlations between Amot and AmotL2 amongst Oncogenes and Tumor
Suppressors in Breast Cancer
Michael Araya, Clark Wells and Lauren Bringman
Indiana University School of Medicine
Department of Biochemistry and Molecular Biology, Indiana University School of Medicine, Indianapolis, IN
Abstract
Approximately ninety percent of human cancers occur in epithelial cells. These cells,
when differentiated, are highly polarized into a lumen facing apical region and a
baso-lateral region that faces the stroma. This polarization is in part maintained by a
semipermeable barrier created by the tight junction which along with the adherence
junction forms the connection with neighboring cells. This differentiated organization
underlies a fundamental tumor suppressive mechanism that is mediated by the the
Hippo signaling pathway. HIPPO signaling is initiated by cell-cell contacts where the
core kinases MST1/2 and LATS1/2 are sequentially phosphorylated and thereby
activated. Phosphorylated LATS1/2 then phosphorylate the transcriptional co-
activator Yes-associated protein (YAP) which results in its cytosolic retention. The
adapter protein Amot binds and transports YAP to the nucleus; a process that is
inhibited by Hippo signaling. To understand the tumor types in which Amot and its
structurally related relative Amotl2 may contribute to tumor formation, we analyzed
their patterns of expression in the Cancer Genome Atlas. First, we used COX
analysis to determine the tumor types in which altered expression of Amot or AmotL2
indicated worse patient survival. This revealed that high levels of Amot transcript
associated with poor patient survival in breast cancer. Conversely, low transcript
levels of AmotL2 associates with poor survival of low-grade glioblastoma, melanoma
and thyroid cancers. We then defined the transcriptomes that co-varied with Amot
and AmotL2 in these contexts by computing their Spearman correlation co-efficients.
My project mainly involved defining the signaling pathways in which the proteins
encoded by these transcripts that co-varied with Amot and AmotL2 in breast and
thyroid cancer functioned. This revealed a novel signature of proteins known to
promote cancer that may indicate where YAP signaling drives highly lethal tumor
development.
Results
Methods
Introduction
References
1. Chan, Siew W. A Working Model for Diverse Regulatory
Mechanisms for TAZ and YAP. 2011.
Singapore. Http://www.imcb.a-
star.edu.sg/newsarchive/140211a.php. 11 Jan. 2011. Web. 17 July
2014.
2. Frank, Steven A. “Dynamics of Cancer: Incidence, Inheritance,
and Evolution. Princeton, NJ: Princeton UP, 2007. Print.
3. Goldman, Mary, and Brian Craft. “Nucleic Acids Research
Advance Access.” The UCSC Cancer Genomics Browser: Update
2013 (2012): n. pag. Web. 14 July 2014.
4. N.d. KEGG PATHWAY Database. Web. June 2014.
5. “Verteporfin Injection: MedlinePlus Drug Information.” U.S National
Library of Medicine. U.S. National Library of Medicine, n.d. Web.
15 July 2014.
Conclusion
Future Plans
Verteporfin is an FDA-approved drug that is
utilized in macular degeneration, however it has
been recently shown to inhibit cell growth
through disruption of the YAP-TEAD complex in
the nucleus, inhibiting neoplastic growth. We
want to identify patients with a similar gene
expression profile with Verteporfin. We are also
analyzing how Verteporfin may be used in
combination with current therapeutics to achieve
more efficacy and to potentially reduce drug
resistance.
I highly concordant signature of genes that directly correlates with Amot in breast cancer and that inversely
correlates with AmotL2 in thyroid cancer is highly enriched in transcripts of proteins that are strongly
associated with tumor growth, epithelial-mesenchymal transitions and tumor stem cells.
The Cancer Genome Atlas (TCGA) is a compilation of RNA sequencing data from 201 data
sets from 22 different cancers of tumors excised from patients. Transcriptome profiling,
through evaluation of the RNA sequencing data, is a critical step in understanding how these
tumors evade normal growth regulatory mechanisms as well as classifying them into
pertinent subgroups based on effective treatment strategy. Identifying these distinct tumor
subtypes allows pathologists to analyze an individual’s tumor and classify the type of tumor.
This then provides the DNA sequence and the prevalence of all RNA transcripts of that
patient’s tumor. This is now being used by researchers to better predict the most effective
drugs to offer the cancer patient. In our research we study the roles of the Amot family which
have been demonstrated by our laboratory to regulate cell growth. Using the covariance
analysis and the DAVID Bioinformatics database, I determined which signaling pathways co-
varied with Amot levels in these tumors which suggests that they are the most essential in
Amot associated malignant growth. Future research will directly test if this signature
associates with more malignant tumors and poor survival of people with breast and thyroid
cancers.
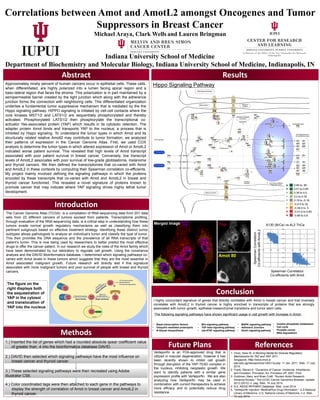
Hippo Signaling Pathway
1.) Inserted the list of genes which had a rounded absolute spear coefficient value
of greater than .4 into the bioinformatics database DAVID.
2.) DAVID then selected which signaling pathways have the most influence on
breast cancer and thyroid cancer.
3.) These selected signaling pathways were then recreated using Adobe
Illustrator CS6.
4.) Color coordinated tags were then attached to each gene in the pathways to
display the strength of correlation of Amot in breast cancer and AmotL2 in
thyroid cancer.
The figure on the
right displays both
the sequestration of
YAP in the cytosol
and translocation of
YAP into the nucleus
The following signaling pathways have shown significant usage in cell growth with increase in Amot:
• Basal transcription factors
• Ubiquitin mediated proteolysis
• N-Glycan biosynthesis
• Wnt signaling pathway
• TGF-beta signaling pathway
• Jak-STAT signaling pathway
• MAPK signaling pathway
• Adherens Junction
• Notch signaling pathway
• Inositol phosphate metabolism
• Cell cycle
• Prostate cancer
• RNA degradation
-0.8
-0.6
-0.4
-0.2
0
0.2
0.4
0.6
0.8
-0.6 -0.4 -0.2 0 0.2 0.4 0.6 0.8
A130 (BrCa) vs AL2 ThCa
SpearmanCorrelation
Co-efficientswithAmotL2
Spearman Correlation
Co-efficients with Amot
Yap
Amot 80
Merged Image