
Recommended
More Related Content
Featured
Featured (20)
IQ bell curve
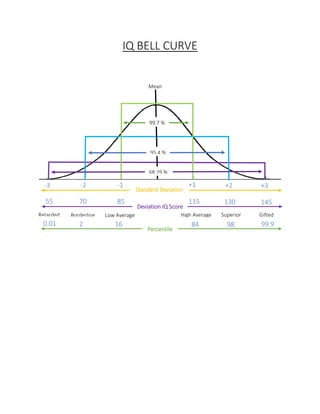
- 1. IQ BELL CURVE -3 -1 +2+1 +3-2 Standard Deviation 55 70 85 145130115 Mean Deviation IQ Score Retarded Borderline Low Average High Average Superior Gifted 99.7 % 95.4 % 68.29 % 0.01 2 16 99.99884 Percentile