Ranavirus: an emerging pathogen in amphibian, fish and reptile populations in...
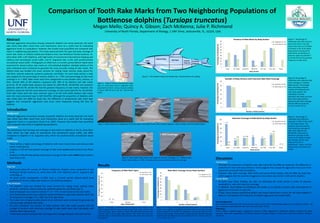
Mello_SMM 2011 Poster 9 (2)
1. 0
5
10
15
20
25
30
35
40
45
1 2 3 4 5
PercentageofIndividuals(%)
Number of Body Sections
Rake Mark Coverage Across Body Sections
St. Augustine (n=23)
St. Johns River (n=87)
0
10
20
30
40
50
60
70
New Obvious Faint
PercentageofIndividuals(%)
Type of Rake Mark
Frequency of Rake Mark Types
St. Augustine (n=23)
St. Johns River (n=87)
0
20
40
60
80
100
120
Head Ant. Body Dorsal Fin Mid Flank Ant. Ped. Post. Ped. Flukes
PercentageofIndividuals(%)
Body Section
Extensive Coverage of Rake Marks by Body Section
St. Augustine (n=23)
St. Johns River (n=87)
Comparison of Tooth Rake Marks from Two Neighboring Populations of
Bottlenose dolphins (Tursiops truncatus)
Megan Mello; Quincy A. Gibson; Zach McKenna; Julie P. Richmond
University of North Florida, Department of Biology, 1 UNF Drive, Jacksonville, FL, 32224, USA
Abstract
Although aggressive encounters among conspecific dolphins are rarely observed, the tooth
rake marks that often result from such interactions serve as a useful tool for evaluating
aggression levels in a population. However, few studies have quantified and compared rake
marks in neighboring populations. This study examined both the type and body coverage of
tooth rake marks on Atlantic bottlenose dolphins from two Northeast Florida locations: St.
Johns River (SJR; n=87 dolphins), with high levels of commercial (international shipping and
military) and recreational vessel traffic, and St. Augustine (SA; n=23), with predominantly
recreational vessel traffic. Photographs (n=356) from a 2-month period (March–April) were
examined for dorsal surface rake marks on 110 individual dolphins. Multiple photos of the
same individual were combined to generate the most accurate coding of rake marks. The
dolphin body was divided into seven sections for coding: head, anterior body, dorsal fin,
mid flank, anterior peduncle, posterior peduncle, and flukes. For each body section a code
was assigned for the percentage of section visible (> or < 75% ) and percentage of rake mark
coverage (> or < 50%). Rake marks were then categorized as new (broken skin), obvious, or
faint. Overall, 86% of SJR dolphins compared with 78% of SA dolphins had rake marks
(p=0.14). Of all visible body sections the dorsal fin (SJR=78.2%, SA=60.9%) and posterior
peduncle (SJR=64.7%, SA=66.7%) had the greatest frequency of rake marks; however, the
posterior peduncle had the most extensive coverage of rake marks (SJR=59.1%, SA=50.0%).
Faint rake marks were the most common type in SA (61.11%) while obvious rake marks
were the most prominent type in SJR (54.67%). Although the proportion of dolphins with
rake marks does not differ by study site, the difference in predominant rake mark type
suggests that conspecific aggression may occur more frequently among SJR than SA
dolphins.
Figure 3. Rake marks were categorized into three types: new (dark, broken skin), obvious (grayish, clearly visible), and faint (faded white).
Results
Discussion
Conclusions
• Although the proportion of dolphins with rake marks did not differ by study site, the difference in
predominant rake mark type (obvious > faint) suggests that conspecific aggression may occur more
frequently among SJR than SA dolphins.
• However, rake mark coverage, both within and across body sections, did not differ by study site,
which suggests that the severity of aggressive encounters was similar in SJR and SA dolphins.
Future Work
• To build upon these findings, we plan on extending the study period in order to examine
seasonality in rake mark type and coverage.
• In addition, focal follows of individuals will enable us to directly compare rates and patterns of
aggressive encounters at each site.
• Finally, future studies quantifying dolphin and vessel interactions at each site will help establish if
there is a link between the frequency of dolphin aggression and vessel traffic.
Methods
Data Set
• Boat-based photo-ID surveys of Atlantic bottlenose dolphins were conducted at two
Northeast Florida locations: St. Johns River (SJR; n=87 dolphins) and St. Augustine (SA;
n=23) (Fig. 1).
• All good quality photographs (n=356) from a 2-month period (March–April) were
examined for dorsal surface rake marks on 110 individual dolphins.
Data Analyses
• The dolphin’s body was divided into seven sections for coding: head, anterior body,
dorsal fin, mid flank, anterior peduncle, posterior peduncle, and flukes (Fig. 2).
• Each photograph was coded to indicate if > or < 75% of each body section was visible.
• Each visible body section was coded for presence/absence, type (new, obvious, faint; Fig.
3) and percent coverage (> or < 50%; Fig. 4) of rake marks.
• The codes from all good quality photos of an individual were combined to generate the
most accurate coding of rake marks.
• For each individual, the number of body sections with rake marks present and the
number of sections with extensive coverage of rake marks were then calculated, with
visibility taken into account.
• T-tests were used to compare rake mark type and coverage between sites (SJR and SA).
Figure 7. Percentage of
individuals with rake marks on
each body section. No rake
marks were seen on the flukes
of animals in SA. Of all visible
body sections the dorsal fin
(SJR=78.2%, SA=60.9%) and
posterior peduncle (SJR=64.7
%, SA=66.7%) had the greatest
frequency of rake marks
Figure 9. Percentage of
individuals with extensive
coverage (> 50%) of rake marks
in each body section. The
posterior peduncle had the
most extensive coverage of
rake marks (SJR=59.1%,
SA=50.0%). There was no
extensive coverage of rake
marks on the flukes at either
site. Sample sizes for each
body section are in
parentheses. *Note: In SA the
head of only one animal was
visible.
Dorsal fin
Head
Anterior Body
Mid-flank Anterior
Peduncle
Posterior
Peduncle Flukes
(68)
(5)
(42)
(22)
(18)
(1)
(12)
(14) (5)
(3)
(2)
(8)
(0)
(1) *
Acknowledgements:
We would like to thank the UNF Environmental Center and the UNF Coastal Biology program for funding this project. All
work conducted under NOAA GA LOC-14157 and UNF IACUC 10-013.
References:
Scott E, Mann J, Watson-Capps J, Sargeant B, Connor R. 2005. Aggression in bottlenose dolphin: evidence for sexual
coercion, male-male competition, and female tolerance through analysis of tooth-rake marks and behavior. Behavior.
142:21-44.
Figure 2. The dolphin’s body was divided into 7 dorsal sections for coding.
Figure 4. Each visible body section was coded for percent coverage (> or < 50%) of rake
marks. Rake marks on > 50% of a body section was considered extensive coverage.
Figure 1. Map of Florida showing both study
sites, St. Johns River and St. Augustine inlet,
separated by 50 km. Survey areas are shown
in green (SJR=40 km) and red (SA=24 km)
boxes.
New Obvious Faint
< 50% Coverage > 50% Coverage
Figure 5. Percentage of individuals with each type of rake mark. In cases
where a dolphin had more than one type of rake mark, it was coded as the
most recent type (New > Obvious > Faint). Faint rake marks were the most
common type in SA (61.11%) while obvious rake marks were the most
prominent type in SJR (54.67%). No new rake marks were seen during the
study period.
Introduction
Background
Although aggressive encounters among conspecific dolphins are rarely observed, the tooth
rake marks that often result from such interactions serve as a useful tool for evaluating
aggression levels in a population (Scott et al, 2005). However, few studies have quantified
and compared rake marks in neighboring populations.
Hypothesis
We hypothesize that the type and coverage of rake marks on dolphins in the St. Johns River
(SJR), which has high levels of commercial and recreational vessel traffic, will differ
compared to dolphins in St. Augustine (SA), which has predominantly recreational vessel
traffic.
Predictions
• There will be a higher percentage of dolphins with more recent (new and obvious) rake
marks in SJR than SA.
• Dolphins in SJR will have greater coverage of rake marks across body sections than those
in SA.
• Dolphins in SJR will have greater (extensive) coverage of rake marks within body sections
than those in SA.
Figure 6. Percentage of individuals with rake marks present on multiple body
sections. The majority of individuals had rake marks on at least one body
section (SJR=86.2%, SA=78.3%). No individuals in SA had rake marks on more
than four body sections. Mean number of body sections with rake marks per
individual did not differ by study site (t=0.09, P>.05, DF=1; means ± SD: SA =
1.4 ± 1.2, SJR = 1.9 ± 1.5).
Figure 8. Percentage of
individuals with extensive rake
mark coverage on multiple
body sections. Percentages
were calculated using the
number of individuals with
rake marks present. No
individuals in SA had
extensive rake marks on more
than three body sections.
Extensive rake mark coverage
did not differ by study site
(t=0.53, P>0.05, DF=1).
(0) (0)
0
10
20
30
40
50
60
1 2 3 4
PercentageofIndividuals(%)
Number of Body Sections
Number of Body Sections with Extensive Rake Mark Coverage
St. Augustine (n=18)
St. Johns River (n=75)
0
10
20
30
40
50
60
70
80
90
Head Ant. Body Dorsal Fin Mid Flank Ant. Ped. Post. Ped. Flukes
PercentageofIndividuals(%)
Body Section
Presence of Rake Marks by Body Section
St. Augustine (n=23)
St. Johns River (n=87)