Monthlypercenct July 2010
•
0 likes•93 views

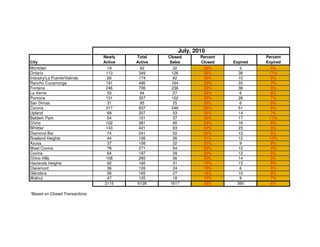
The document provides statistics on real estate sales in various cities in Southern California for July 2010. It shows the number of newly active listings, total active listings, closed sales, and percentages of closed sales and expired listings for each city. Overall, there were 2,115 newly active listings, 6,128 total active listings, and 1,617 closed sales across the cities listed, representing a 26% closure rate and 6% expiration rate on average.

Recommended
More Related Content
What's hot
What's hot (20)
Similar to Monthlypercenct July 2010
Similar to Monthlypercenct July 2010 (8)
More from MatthewABartlett
Monthlypercenct July 2010
- 1. July, 2010 Newly Total Closed Percent Percent City Active Active Sales Closed Expired Expired Montclair 19 62 32 52% 3 5% Ontario 113 349 126 36% 38 11% Industry/La Puente/Valinda 60 174 62 36% 10 6% Rancho Cucamonga 191 490 164 33% 33 7% Fontana 246 706 236 33% 38 5% La Verne 33 94 27 29% 6 6% Pomona 131 357 102 29% 26 7% San Dimas 31 95 25 26% 6 6% Corona 317 937 246 26% 51 5% Upland 69 207 53 26% 14 7% Baldwin Park 54 151 37 25% 17 11% Chino 102 281 65 23% 16 6% Whittier 143 421 93 22% 23 5% Diamond Bar 74 241 52 22% 12 5% Rowland Heights 44 126 26 21% 12 10% Azusa 37 108 22 20% 9 8% West Covina 78 271 54 20% 12 4% Covina 64 197 39 20% 12 6% Chino Hills 108 285 56 20% 14 5% Hacienda Heights 62 160 31 19% 13 8% Claremont 36 126 24 19% 6 5% Glendora 56 165 27 16% 10 6% Walnut 47 125 18 14% 9 7% 2115 6128 1617 26% 390 6% *Based on Closed Transactions