SlideShare a Scribd company logo
1 of 25
Download to read offline
1 University of Oregon Investment Group
December 5, 2014
Healthcare
Covering Analyst: Charles Pontrelli
Email: cpp@uoregon.edu
Investment Thesis
 BD’s acquisition of CareFusion Corporation (CFN) will increase the firm’s
position in the medication management industry through improvements in
healthcare worker safety, patient care, and medication administration
efficiency.
 Growth in emerging markets and increased standing in the US through the
acquisition of San Diego-based CareFusion will boost revenues
significantly.
 The implementation of the Patient Protection and Affordable Care Act
through 2020 and an aging population in the United States will increase
consumer demand and spending on healthcare products.
 Strong focus on the development on current products, as well as the
implementation of new products planned through 2017 will ensure growth
in all business segments.
Becton, Dickinson & Co.
Key Statistics
52 Week Price Range
50-Day Moving Average 127.99$
Estimated Beta 0.94
Dividend Yield 2.18%
Market Capitalization (mm) 27,083.52$
3-Year Revenue CAGR 1.73%
Trading Statistics
Diluted Shares Outstanding (mm) 192
Average Volume (3-Month) 1,519,640
Institutional Ownership 86.70%
Insider Ownership 0.33%
EV/EBITDA (LTM) 16.11x
Margins and Ratios
Gross Margin (LTM) 59.06%
EBITDA Margin (LTM) 20.21%
Net Margin (LTM) 15.08%
Debt to Enterprise Value 0.40x
$ 104.94 - 142.33
Ticker: BDX
Current Price: $141.06
Recommendation: Hold
Price Target: $165.97
One-Year Stock Chart
0
2000000
4000000
6000000
8000000
10000000
12000000
14000000
$0.00
$20.00
$40.00
$60.00
$80.00
$100.00
$120.00
$140.00
$160.00
Jun-13 Aug-13 Oct-13 Dec-13 Feb-14 Apr-14 Jun-14 Aug-14 Oct-14
Volume Adj Close 50-Day Avg 200-Day Avg
December 5, 2014
UOIG 2
University of Oregon Investment Group
53%
33%
14%
BD Medical BD Diagnostics BD Biosciences
Becton, Dickinson & Co. Business Overview
Maxwell W. Becton and Farleigh S. Dickinson founded Becton, Dickinson &
Co. (BD) in 1897. In 1906, BD incorporated in New Jersey, where their
headquarters are currently located in the city of Franklin Lakes. BD is a medical
technology and supply company that manufactures medical devices, software,
and instrument systems. The company went public in 1962, and 60% of their
sales currently come from over-seas markets. BD markets their products
through individual distribution channels and directly to customers by
independent sales representatives, and orders are received and filled on a current
basis. In October, 2014 BD announced its acquisition of CareFusion
Corporation for $12.2 billion in stock and cash. Business overviews of both
companies are given below in order to show how the acquisition will affect
BD’s operations. Currently, BD’s operations are separated into three business
segments: BD Medical, BD Diagnostics, and BD Biosciences, which are
explained below.
BD Medical
The BD Medical segment manufactures a wide array of medical products. Some
of the segment’s principal medical devices are prefilled IV flush syringes;
needles, syringes and intravenous catheters for the delivery of medication; self-
injection syringes and pen needles for the treatment of diabetes; regional
anesthesia needles and trays; and generic prefilled injectables. Hospitals,
clinics, pharmacies, public health agencies, and pharmaceutical companies are
the primary customers served by BD Medical. Once the acquisition of
CareFusion is closed, their operations will be consolidated into BD Medical,
which will be a large driver of revenue. CareFusion’s Infusion Systems and
Dispensing Technologies will complement BD’s product line in their Medical
Surgical Systems. Additionally, disposables and reusable surgical products can
be offered with the sale of BD’s disinfecting containers to establish long-term
revenue streams. BD Medical includes three subunits: Medical Surgical
Systems, Diabetes Care, and Pharmaceutical Systems.
Medical Surgical Systems
The Medical Surgical Systems unit is the largest driver of revenue for this
segment. This unit’s core products are anesthesia, infusion therapy, injection,
and sharps disposal products. Revenue growth in the past two years can be
attributed to the sales of the BD PhaSeal™, which resulted from the Carmel
Pharma, AB acquisition that occurred at the end of 2011. This business unit will
benefit greatly from the addition of certain CareFusion products, such as
CareFusion’s Alaris™ System, which can provide and manage multiple
medications and fluids to a patient simultaneously.
Diabetes Care
The Diabetes Care unit produces self-injection syringes and pen needles for the
treatment of diabetes, as well as pre-filled injectables. Revenue growth in this
unit has recently benefitted from strong sales of BD Ultra-Fine™ and BD
PentaPoint™ pen needles, which are self-injection systems to deliver insulin to
diabetes patients.
Pharmaceutical Systems
Revenue growth for the Pharmaceutical Systems was supplemented by the
acquisition of Safety Syringes in the first quarter of the fiscal year of 2013. This
unit produces primarily glass and plastic prefilled syringes for biotech drugs and
other pharmaceutical purposes.
Figure 1:
BD Revenue Breakdown for 2013
Source: BD 2013 10-K
Figure 2:
BD Medical Revenue Growth
Source: UOIG Spreads
Figure 3:
BD Nano™ 4mm Pen Needle
Source: bd.com
0
1000
2000
3000
4000
5000
6000
7000
8000
$Millions
December 5, 2014
UOIG 3
University of Oregon Investment Group
BD Diagnostics
BD Diagnostics manufactures products that detect infectious diseases,
healthcare-associated infections, and cancers, as well as products that allow for
the safe transport and collection of specimens. This segment works to improve
safety conditions for patients, healthcare workers, hospitals, laboratories, and
clinics. BD Diagnostics also aims to enhance laboratory efficiency and
productivity. BD Diagnostics consists of two units: Preanalytical Systems and
Diagnostic Systems.
Preanalytical Systems
For over 60 years, BD has enhanced the science of specimen collection and has
increased lab efficiency and productivity. BD’s Preanalytical Systems is an
industry leader in blood collection tubes and urine collection devices, such as
their BD Vacutainer™ Push Button Blood Collection Set. This unit has also
been helping customers in emerging markets, such as China and India, to
improve lab safety by providing education on global standards of lab safety and
proficiency testing.
Diagnostic Systems
This unit contains products that deal with disease and infection detection. The
Diagnostic Systems unit experienced recent revenue growth due to strong sales
of its automated diagnostic platforms, as well as its blood culture and TB
systems. Not only this, but revenues were boosted by a strong flu season
between 2013 and 2014.
BD Biosciences
BD Biosciences manufactures clinical and research products to assist in the
study of cells and their components, as well as to improve the understanding of
normal cell processes and diseased cell processes. This unit’s primary products
are cell sorters and analyzers, antibodies and kits for cell analysis, and reagent
systems for life science research. BD Biosciences’ largest customers are
research and clinical laboratories, academic institutions, biotech companies,
hospitals, and blood banks.
CareFusion Corporation Business Overview
CareFusion Corporation (CF) was incorporated in Delaware on January 14,
2009 as a spinoff of Cardinal Health, Inc. The spinoff was completed on August
31, 2009. CF was made of various clinical and medical product businesses that
were a part of Cardinal Health. On September 1, 2009 CF began publicly
trading on the New York Stock Exchange. They are currently headquartered in
San Diego, CA. CF focuses on healthcare safety through the prevention of
healthcare-associated infections and the reduction of medication errors. They
are composed of two business segments: Medical Systems and Procedural
Solutions. Both segments are further discussed below.
Medical Systems
The Medical Systems business segment focuses on the production of equipment
for the use of medical management, which includes their respiratory ventilation
and diagnostic technologies, infusion and medication dispensing technologies,
as well as supply management. These products are designed to improve patient
safety through the reduction of medication errors. CareFusion’s direct sales
force primarily sells these products, but third-party distributors are used as well.
The Medical Systems segment is divided into 3 separate units: Infusion Systems,
Dispensing Technologies, and Respiratory Technologies.
Figure 4:
BD Diagnostics Revenue Growth
Source: UOIG Spreads
Figure 5:
BD Biosciences Revenue Growth
Source: UOIG Spreads
Figure 6:
CF Revenue Breakdown for 2013
Source: CF 2013 10-K
0
500
1000
1500
2000
2500
3000
3500
4000
0
200
400
600
800
1000
1200
1400
1600
$Millions$Millions
66%
34%
Medical Systems Procedural Solutions
December 5, 2014
UOIG 4
University of Oregon Investment Group
Infusion Systems
CareFusion’s infusion systems deliver medications and various fluids to patients
in precise amounts over a wide range of infusion rates. They are the leader
when it comes to the design, development and marketing of IV infusion systems.
One of their key products is their Alaris™ System, which is a pump system that
simultaneously delivers medications and fluids from multiple delivery modules
while also monitoring a patient’s vital signs. The Alaris™ System also only uses
CareFusion disposables, allowing for a long-term revenue stream associated
with the refilling of these disposables when needed.
Dispensing Technologies
This unit focuses on the production of automated dispensing systems for
medications and supplies. These products are usually supplied to hospitals and
other healthcare facilities inside the United States. CareFusion manufactures
these dispensing systems in order to reduce medical error and increase
efficiency in hospitals. Their Pyxis products automate the management of
medications from the pharmacy to the nursing unit, as well as the medication
management inside operating rooms. These products ultimately decrease order
turnaround time and reduce transcription errors.
Respiratory Technologies
CareFusion’s Respiratory Technologies unit develops, manufactures, and
markets mechanical ventilators and other consumables for patients with
respiratory disorders. Respiratory disorders are among the highest cost, highest
risk, and largest growing hospital populations. Their products provide both
invasive and noninvasive respiratory support, and accommodate both pediatric
and adult patients. Their AVEA and VELA ventilator systems are versatile units
for the use in both acute care and alternate care settings.
Procedural Solutions
The Procedural Solutions business segment revolves around the production of
disposable products and reusable surgical instruments. The majority of these
products are used in the preparation of patients for the operating room, or in the
operating room itself. A combination of CareFusion’s direct sales force and
third-party distributors are used to sell these products. This segment is separated
into three units: Infection Prevention, Medical Specialties, and Specialty
Disposables.
Infection Prevention
This unit consists largely of single-use products for the preparation of surgical
and vascular procedures. This includes their line of ChloraPrep single-use
sterile applicators, IV infusion valves, and Chemo Safety System, which delivers
chemotherapy drugs to patients without exposing healthcare personnel to the
hazardous drugs.
Medical Specialties
CareFusion’s Medical Specialties business unit produces specialty medical
devices, such as reusable surgical instruments and devices used in interventional
care. They provide over 25,000 unique surgical instruments, as well as surgical
instrument tracking and sterilization container systems. While most of these
products are used in hospitals and clinics, the Medical Specialties unit also
manufactures their PleurX drainage system, which is used in the home
management of diseases and infections.
Specialty Disposables
0
500
1000
1500
2000
2500
3000
3500
Figure 7:
CF Medical Systems Revenue Growth
Source: UOIG Spreads
0
500
1000
1500
2000
2500
Figure 8:
CF Procedural Systems Revenue Growth
Source: UOIG Spreads
Figure 9:
CF ChloraPrep Applicator
Source: Google Images
$Millions$Millions
December 5, 2014
UOIG 5
University of Oregon Investment Group
The Specialty Disposables unit is organized around the marketing and
manufacturing of respiratory consumable products that work with CareFusion’s
range of ventilators, such as ventilator circuits and oxygen masks. In December
2013 CareFusion acquired Vital Signs, which manufactures single-use
respiratory care and anesthesiology consumables.
Industry
Overview
BD operates in the Medical Instrument & Supply Manufacturing industry. This
industry researches, develops, and manufactures surgical, medical, dental, and
veterinary products. With over 15,429 businesses in this industry, it is
considered quite large. The company with the largest market share in this is
Johnson & Johnson, with an 8.4% market share. BD has the third largest market
share at 3.2%.
Companies in this industry have moderate fixed capital expenses. A large
variety of products are made in this industry for highly specialized applications,
so not all products can be made on an automated manufacturing line. Skilled
employees are needed to make many of these products, and these companies
usually receive salaries that are above the average for the manufacturing sector.
For every $1 spent on capital, approximately $0.17 is spent on wages for
employees.
Larger companies in this industry have a few advantages, one being economies
of scale. They are able to significantly reduce the costs of the production of
goods. Not only this, but their greater revenues allow them to spend more on
research and development, which is critical in this industry. Larger companies
are also able to use their large financial resources to acquire the smaller
companies. The smaller companies are usually more innovative, so these
acquisitions greatly benefit companies such as Johnson & Johnson and Becton,
Dickinson & Co. If current trends continue, the industry will consolidate and
the market shares of larger companies will grow.
Growth potential for this industry is moderate. While the industry is mature and
has many large, established companies, the possibilities of growth for companies
such as BD are great due to the availability of small, innovative companies that
can be acquired. Also, with the rate at which medical technology is advancing
there is great potential for growth. Not only this, but there are many favorable
macroeconomic factors that will assist in the growth of this industry.
Macroeconomic Factors
Aging Adult Population
In the past few years, the percentage of the adult population aged 65 and older
has increased significantly. This is mostly due to baby boomers (adults born
between the years 1945 and 1964). The growth rate of this population over the
last 5 years has been about 3.1%, compared to a growth rate of 0.8% between
the years of 1995 and 2000. This growth rate is expected to increase to 3.3%
between 2014 and 2019. This is due to the majority of baby boomers that still
remain that have not crossed the 65 year threshold.
In the US in 2019, senior adults (age 65 or over) are expected to make up
approximately 16.4% of the population, compared to 14.5% currently. In most
cases, as people age they require more medical care. This increase in medical
Figure 10:
% Change of People with Health Insurance
Source: IBIS World
%Change
Figure 11:
Healthcare Sector vs. Medical Instrument and
Supply Manufacturing Industry Costs
Source: IBIS World
0
1
2
3
4
5
1991 1996 2001 2006 2011 2016
Source: IBIS World
Figure 12:
% Change of Adults over the Age of 65
%ChangePercentage
-4
-3
-2
-1
0
1
2
3
4
17.4 19.2
3 31.2
1.62.5
3
59
45.5
10.3
17.2
6.6
10.5
0
10
20
30
40
50
60
70
80
90
100
Average Costs of all Industries in
Sector
Industry Costs
Other Rent & Utilities Marketing Depreciation
Purchases Wages Profit
December 5, 2014
UOIG 6
University of Oregon Investment Group
care will lead to an increase in demand for medical supplies. An increase in
healthcare expenditure is one indicator of healthcare industry performance.
Patient Protection and Affordable Care Act
The passing of Patient Protection and Affordable Care act by President Obama
and his administration has changed the US healthcare market, and will therefore
affect BD. The goal of the PPACA is to increase the quality and affordability of
health insurance by expanding private and public health insurance coverage. It
requires all insurance companies to cover all people who apply for insurance
within new standards. Not only this, but it requires insurance companies to offer
the same rates regardless of pre-existing conditions or sex.
One adverse effect that comes from the PPACA is the enactment of a 2.3%
medical excise tax on sales of certain medical products within the US. In 2013
this tax was $40 million for BD. This tax could arguably stifle innovation and
cut into research and development. Another adverse effect of the PPACA is that
it reduces Medicaid and Medicare payments to hospitals, clinical laboratories,
and pharmaceutical companies. This could reduce the amount of medical
procedures performed, which, in turn, would reduce the demand for medical
supplies. Finally, the PPACA could lower the reimbursement rates for BD’s
products, therefore reducing sales.
However, the PPACA will at the same time affect BD favorably through the
expansion of healthcare. Healthcare expenditures will undoubtedly increase
substantially, with an estimated 32 million people gaining healthcare by 2019.
Even though there are possible adverse effects, as listed above, it can be
expected that there will be a net benefit from the PPACA.
Product Regulation
The Medical Instrument and Supply Manufacturing industry is extremely
regulated by the Food and Drug Administration (FDA) and other agencies. The
approval of the sale of a product by the FDA takes at least 90 days, with the
majority taking much longer than that. Any change to a device that has already
been cleared must be refiled with the FDA. Even after a device is cleared, there
is extensive product testing that occurs. There are many regulatory
requirements, such as medical device reporting (MDR), Quality System
Regulation (QSR), and labelling regulations. All of these are time-intensive
and, if not passes, can result in a long delay of the product or a serious fine.
While these regulations are substantial, they also lead to the securing of patents,
because of how long it takes to get approved. Small firms with these patents are
seen as lucrative acquisitions by larger companies because of the new and
innovative products they can acquire.
Globalization
Expansion into international markets, especially emerging markets like China
and South America, pose promising opportunities for companies in the
healthcare industry. China, for example, is having an enormous boost in
population and healthcare expansion. Companies such as BD will be competing
to obtain market shares in these emerging markets because of their opportunities
for growth. However, with expansion into global markets comes foreign
currency exchange risk. BD conducts a large portion of its business outside the
United States, and is therefore subject to this foreign currency exchange risk.
While BD participates in hedging activities to reduce this risk, it will never
completely remove these risks.
Figure 13:
The Patient Protection and Affordable Care
Act Logo
Source: Google Images
Figure 14:
% Change of Number of Physician Visits
Source: IBIS World
%Change
Figure 15:
FDA Logo
Source: Google Images
Figure 16:
Industry Barriers to Entry
Source: IBIS World
Barriers to Entry Checklist Level
Competition Medium
Concentration Low
Life Cycle Stage Mature
Capital Intensity Medium
Technology Change High
Regulation & Policy Heavy
Industry Assistance Medium
-10
-5
0
5
10
15
December 5, 2014
UOIG 7
University of Oregon Investment Group
Competition
The Medical Instrument and Supply Manufacturing industry is considered
moderately competitive. Because of the amount of government regulation on
products and companies within the industry, competition can be limited. As
stated before, the regulation by organizations like the FDA can be a significant
barrier to entry.
However, the industry is fueled by innovation, so every company is looking for
how to improve and add to their line of products. Specialization is very
important in the medical industry, so this allows smaller companies to compete.
As stated before, these small companies are attractive targets of larger
companies for buyouts. While this rapid technological innovation has its
benefits, it also has some drawbacks. The constant change in technology means
that any one company is at risk at becoming obsolete.
Pricing power will become more important in the coming years, due to the price
concessions that healthcare providers and governments are pushing for.
Companies will need to cut costs and achieve economies of scale to be
competitive. These companies will therefore most likely turn to outsourcing,
increasing spending on acquisitions, and increasing research and development
costs to develop proprietary technology.
While there is a large amount of internal competition within the Medical
Instrument and Supply Manufacturing industry, there is traditionally little
external competition. However, this is changing with due to the advancements
of the biotechnology industry. Treatments from the biotech industry, such as
synthetic bone, organ, and tissue replacements can make some medical
instruments and supplies obsolete. Technology advancements in this industry
are therefore critical to the survival of a firm.
Strategic Positioning
Sales and Marketing
BD’s current sales and marketing strategy is to focus on capitalizing on
emerging markets such as China and India. Over the past few years China has
made many steps to increase the accessibility of healthcare for its citizens. This
creates a large opportunity for revenue growth for BD. To obtain positioning in
this market and other emerging markets, BD has been increasing brand equity
through customer-focused initiatives.
When possible, BD partners with various organizations across the globe to
volunteer in impoverished communities to raise awareness about diseases and
strengthen healthcare. For example, in 2005 BD launched their Service Trip
Program by collaborating with the Catholic Medical Mission Board in order to
address and combat HIV/AIDS in Zambia. BD also sends products as well as
employees to various countries to give their time and expertise in laboratories to
treat diseases and improve health standards.
The presence of BD in these emerging markets allows BD to leverage the trust it
has gained in order increase revenues and capitalize on these markets.
Customer Relationships
BD prides itself in its customer relations. Therefore, BD markets its products in
the US through independent distribution channels and directly to consumers
through their independent sales representatives. Because of these independent
distribution channels and sales representatives, BD is able to reduce order
Figure 17:
Industry Products and Services Segmentation
Source: IBIS World
Figure 18:
Net Income vs. SG&A Expense
Source: UOIG Spreads
$Millions
Figure 19:
CMMB Logo
Source: Google Images
0
500
1000
1500
2000
2500
3000
3500
4000
4500
5000
Net Income SG&A
23%
19%
15%
13%
11%
8%
6%
5%
Orthopedic Instruments Surgical Instruments
Diagnostic Apparatus Stents and Catheters
Other Syringes and Hypodermic Needles
Blood Transfusion and IV Equipment Dental Instruments
December 5, 2014
UOIG 8
University of Oregon Investment Group
backlog significantly. It allows BD to receive and fill orders on a current basis.
These independent channels are spread throughout their various geographic
regions to reach their customers. This allows BD to cater to a customer’s needs
more effectively by deciding what products need to be supplied where, or create
new products to meet those needs.
Also, none of BD’s customers account for more than 10% of BD’s revenues.
This allows BD to change its products to fit a variety of groups, and benefits BD
and its customer-focused strategy greatly.
Operational Efficiency
In recent years BD has implemented an operation strategy by the name of
Project ReLoCo in order to cut costs. This project is a global, cross-functional
business initiative that is designed to reduce manufacturing costs through the
reduction of raw material costs and start-up costs. Management attributes the 80
bps growth of gross margin from 2012 to 2013 to the efforts of Project ReLoCo.
BD management is also incorporating a Lean Six Sigma operation into their
business. This operation aims to reduce manufacturing and operating costs by
analyzing how products are made and how efficiencies might be increased.
While the two above operations aim to cut costs and improve efficiency, the
acquisition of CareFusion may prevent costs from being reduced because of the
restructuring that will occur once deal is finalized. Also, CareFusion has a
higher percentage of cost of goods sold as a portion of revenue than BD has, so
this could affect BD’s costs in the near future.
Research and Development
As stated above, research and development is a key factor in the success of a
company in the medical instrument and supply manufacturing industry. Rapid
technological advancements in medical technology require firms to be on the
forefront of product innovation.
BD is focused on organic R&D spending in order to continually improve its
current products and develop new ones to supplement those already existing.
Management currently focuses a large portion of R&D spending on products
that are successful in high growth markets in order to increase revenue growth.
BD’s research and development is also spending resources on how to improve
efficiency and cut costs of current operations.
Acquisitions are also a very important of BD’s R&D strategy. By acquiring
companies BD is able to expand its product offerings. Acquisitions are
discussed in greater detail below.
Business Growth Strategies
Geographic Growth
BD’s current strategy is to expand both internationally and domestically in all of
its business segments. While in most recent years their focus has been on
international expansion, the acquisition of CareFusion will increase their
domestic revenues significantly.
Emerging Markets
Emerging markets have been a large focus of BD’s in the past due to the high
growth rates of healthcare offerings in these markets. New legislation in
countries such as China and Brazil that work to ensure healthcare worker safety
helped growth rates in 2013, and will continue to improve growth rates. Many
Figure 20:
Gross Margin Growth
Source: UOIG Spreads
Figure 21:
R&D Expense vs. Net Income
Source: UOIG Spreads
Figure 22:
R&D Expense vs. EBITDA
Source: UOIG Spreads
$Millions$Millions
50%
51%
52%
53%
54%
55%
56%
57%
0
500
1000
1500
2000
2500
R&D Net Income
0
500
1000
1500
2000
2500
3000
3500
4000
4500
R&D EBITDA
December 5, 2014
UOIG 9
University of Oregon Investment Group
emerging markets are focusing on improvements to healthcare safety and the
reduction of healthcare related infections. The products that CareFusion’s
Medical Segment offers will supplement BD’s current products and capitalize
on the need for medical safety supplies in these emerging markets.
As mentioned before, BD is increasing brand equity in these emerging markets
through their philanthropic work. By supporting private and public sector
partners and enhancing clinical expertise and training in laboratories and
hospitals, BD is able to establish a strong customer base. BD has been operating
in India and China since 1995, so they have a large amount of knowledge on
public policy and the healthcare changes occurring in Asia currently.
As of October 27, 2014 BD was ranked 10th
on the EPA’s Fortune 500®
Partners List. In countries such as China that are working to improve their
environmental impact, having BD as a player in the market is beneficial to their
image.
United States
The United States currently is responsible for the majority of BD’s sales. In the
macroeconomics factors section above, the PPACA was discussed. This could
ultimately be beneficial for revenue growth in the US due to the substantial
increase in healthcare offerings. With over 32 million Americans expected to
obtain healthcare by 2019, healthcare expenditures will almost certainly
increase. However, with the medical device excise tax, reductions in Medicare
and Medicaid payments to hospitals, and possible cuts to reimbursements of
BD’s products, the PPACA could also cause significant adverse effects to
revenue growth.
BD’s acquisition of CareFusion, a US based company, should improve domestic
growth rates. With almost 77% of its revenue generated from domestic sales,
CareFusion could increase domestic revenues for BD’s Medical segment
significantly. This acquisition will be discussed in greater detail in the
acquisitions section.
New Product Growth
While BD has concentrated their focus away from a product-focused strategy to
a customer-focused strategy in the past few years, R&D expenses have increased
to further the development of innovative products. With their customer-focused
strategy, BD needs to be able to cater to all customers’ needs, so they need a
wide variety of products, especially those in emerging markets. Between 2015
and 2017 BD plans to release over 14 new products in the US and
internationally in order to increase sales and provide a greater selection to its
customer base. Through Q3 of 2014, new products have accounted for
approximately 11% of revenues, while for the 2013 fiscal year new products
only accounted for about 8% of revenue. This shows the effectiveness of BD’s
R&D department and its innovating capabilities. BD’s acquisition of
CareFusion will also introduce a large amount of new products into its offerings.
More on this will be discussed in the acquisitions section.
Organic Growth
Funding for organic growth is planned to increase in the coming years. This is
due to the Project ReLoCo and Lean Six Sigma strategies to cut costs across all
business segments and increase operational efficiencies. BD continues to
allocate more funding towards R&D to develop current product lines, such as
the BD Max™ product line, which is one of BD Diagnostics’ revenue drivers.
This past year alone 3 new products were released for the BD Max system.
Figure 23:
EPA Logo
Source: Google Images
Figure 24:
CareFusion Corporation Logo
Source: Google Images
Figure 25:
BD Max™ System
Source: Google Images
December 5, 2014
UOIG 10
University of Oregon Investment Group
Also, the expansion of distribution channels domestically and internationally is
expected to increase organically in order expand BD’s customer base, as well as
fulfill the needs of pre-existing customers.
Acquisitions
Being in the medical instrument and supply manufacturing industry, acquisitions
are essential to being competitive because of the rapid technology advancements
and the introduction of many new products every year. BD acquires companies
that it believes can fill “gaps” in its operations by supplementing already
existing products. For example, on March 11, 2013 BD acquired Cato Software
Solutions (“Cato”). Cato provides a suite of medication safety solutions for IV
medication preparation, as well as physician therapy planning and bedside
documentation. This acquisition helped BD’s strategy by helping healthcare
workers eliminate medication errors and streamline workflows. Additionally, it
increases BD’s presence in the hospital pharmacy space.
BD management says that no company is acquired unless it can deliver tangible
and significant benefits to BD’s products that BD cannot do on its own
otherwise.
CareFusion Corporation
On October 5, 2014 Becton, Dickinson & Co. announced that would acquire
CareFusion Corporation. This acquisition was agreed on unanimously by the
Boards of both companies. The deal states that CareFusion shareholders will
receive approximately $49 in cash and .0777 of a share of BD for every share of
CareFusion. The agreement is expected to close in the middle of 2015, with BD
shareholders owning approximately 92% of the combined company and
CareFusion shareholders owning approximately 8%. To finance the acquisition,
BD acquired a loan of $9.1 billion from Goldman Sachs.
CareFusion will add a variety of products that will complement BD’s through
expansion in the medication management industry. This acquisition also aligns
with BD’s new customer-focused strategy by increasing patient safety through
CareFusion’s automated medication dispensing systems, IV infusion systems,
and their patient preparation products. BD will also be able to provide
CareFusion products to a wider customer base through expansion in emerging
markets, such as China and Brazil. This will enhance emerging market growth
opportunities. The combinations of the two companies’ product portfolios will
help to increase efficiencies and reduce safety issues in hospitals and hospital
pharmacies.
BD will attempt to mitigate restructuring costs through a detailed execution plan
that they have in place to ensure a seamless integration. Upon the closing of the
acquisition, CareFusion will be integrated in to BD’s Medical segment. The
cost of producing goods sold may increase marginally due to CareFusion having
a larger percentage cost of goods sold that make up their revenue than BD.
However, BD management maintains that gross margins will stay approximately
the same. Also, CareFusion management maintains its financial guidance of 5
to 7 percent for the 2015 fiscal year, while BD maintains its guidance of 4 to 5
percent.
While BD wants to expand CareFusion’s products to emerging markets,
management has stated they are committed to maintaining a presence in San
Diego, CA, the headquarters location of CareFusion. This will allow for
increased revenue growth in the US, which in most recent years has been
secondary to revenue growth in emerging markets. However, BD will be
Figure 26:
Cato Software Solutions
Source: Google Images
Figure 27:
CareFusion Alaris® with Guardrails® System
Source: Google Images
Source: carefusion.com
Figure 28:
CareFusion Genesis® Sterilization Containers
December 5, 2014
UOIG 11
University of Oregon Investment Group
focusing on the expansion of CareFusion’s product offerings in emerging
markets.
Management and Employee Relations
Vincent A. Forlenza—Chairman, Chief Executive Officer, and
President
Vincent Forlenza has been a part of BD since 1980. On January 1, 2009 he was
appointed President, and on October 1, 2011 was appointed Chief Executive
Officer. Mr. Forlenza was named Chairman on July 1, 2012, and has held the
position since. Prior to these positions, Mr. Forlenza was the Chief Operating
Officer of BD and has extensive experience with the BD Biosciences and BD
Diagnostics segments. He was also formerly the Chairman of AdvaMed Dx at
AdvaMed. Mr. Forlenza holds a Bachelor’s Degree in Chemical Engineering
from Lehigh University, as well as an MBA from the Wharton School of the
University of Pennsylvania.
Christopher R. Reidy—Chief Financial Officer and Executive
Vice President of Administration
Christopher R. Reidy has been the Executive Vice President of Administration
and Chief Financial Officer since July 15, 2013. Prior to being at BD, Mr.
Reidy served as the Chief Financial Officer and Corporate Vice President of
Automatic Data Processing Inc. (ADP) from October 2, 2006 to November 5,
2012. Mr. Reidy also served as the Chief Financial Officer at the National
Basketball Association. He holds a BS in Accounting from St. Francis College,
as well as a MBA from Harvard University.
William A. Kozy—Chief Operating Officer and Executive Vice
President
William Kozy has been an Executive Vice President since June 2006, and was
appointed Chief Operating Officer in November of 2012. Mr. Kozy previously
served as the President of BD Diagnostics from November 2003 to June 2006.
He has been with BD since 1974 when he took on a sales job. He has a BA in
English from Kenyon College in Ohio.
Gary M. Cohen—Executive Vice President
Gary Cohen has been an Executive Vice President of BD since 2006. Prior to
his position as Executive Vice President, Mr. Cohen has held various capacities
at BD. He served as the President of BD Medical from May 1999 to June 2006.
Mr. Cohen also served as the Chairman of the Center for Disease Control and
Prevention Foundation from 2010 to 2014. He holds a BA and MBA from
Rutgers University.
Management Guidance
Management provides guidance on EPS, revenues, and net income for the fiscal
year of 2014 for their three business segments. The revenue model below is in
line with their management guidance for coming year. Q3 of 2014 was in line
with management guidance from Q2. Management expects that for the fiscal
year of 2014 there will be an estimated revenue growth between 4 and 5 percent,
and attain this growth by the end of the fiscal year. Guidance also expects an
EPS between $6.12 and $6.22 for 2014, which represents a growth of between 6
and 7 percent from 2013. At the beginning of the fiscal year, management
announced guidance for revenue growth for BD Medical, BD Diagnostics, and
Figure 29:
BD Headquarters
Source: bd.com
Figure 30:
BD Management Compensation vs. Revenue
$10,700.00
$10,800.00
$10,900.00
$11,000.00
$11,100.00
$11,200.00
$11,300.00
$11,400.00
$11,500.00
$11,600.00
$11,700.00
$0.00
$1,000,000.00
$2,000,000.00
$3,000,000.00
$4,000,000.00
$5,000,000.00
$6,000,000.00
$7,000,000.00
$8,000,000.00
$9,000,000.00
$10,000,000.00
2011 2012 2013
V. Forlenza C. Reidy W. Kozy G. Cohen Revenues ($ Millions)
Source: bd.com
$2,500.00
$2,600.00
$2,700.00
$2,800.00
$2,900.00
$3,000.00
$3,100.00
$3,200.00
$3,300.00
$3,400.00
$0.00
$1,000,000.00
$2,000,000.00
$3,000,000.00
$4,000,000.00
$5,000,000.00
$6,000,000.00
$7,000,000.00
$8,000,000.00
$9,000,000.00
$10,000,000.00
2011 2012 2013
V. Forlenza C. Reidy W. Kozy G. Cohen EBITDA ($ Millions)
Source: bd.com
Figure 31:
BD Management Compensation vs. EBITDA
Source: Google Images
December 5, 2014
UOIG 12
University of Oregon Investment Group
BD Biosciences to be 5.5 to 6 percent, 3 to 3.5 percent, and 4 to 5 percent,
respectively. For the year-to-date, all segments are in line with their guidance.
It should be noted that, historically, management has not given beatable
guidance. Actual growth percentages usually fall in line with the guidance that
management gives at the beginning of the fiscal year.
Portfolio Strategy
Becton, Dickinson & Co. is currently held by the Investment Group in both the
Svigals’ and Tall Firs Portfolios. As of November 26, 2014 BD represented
3.20% of the Svigals’ Portfolio and 3.29% of the Tall Firs Portfolio. With its
consistent revenues and dividends, BD is a strong value play, and is therefore a
great company to hold in both the Tall Firs (value tilt) and Svigals’
(value/growth blend) Portfolios. Additionally, Tall Firs is underweight in large-
cap stocks. Since purchase, BD has earned a 251.8% return on investment in the
Tall Firs Portfolio and 93.03% return on investment in the Svigals’ Portfolio.
Recent News
“Becton Dickinson & Co Files SEC form 10-K, Annual
Report”
Edgar Online—November 26, 2014
BD filed their 10-K with the SEC on November 26, 2014. EPS, net income, and
revenue growth all met management expectations. CEO Vince Forlenza gave
guidance for the 2015 fiscal year, with EPS having a growth rate between 8 and
9 percent and revenues having an estimated growth between 4.5 and 5 percent.
The announcement of the results in the 10-K caused a spike in the stock price on
the NYSE, going from a closing price of $134.73 the day prior to a closing price
of $136.79.
“BD Board Declares Dividend”
PR Newswire—November 25, 2014
The Board of Directors of Becton, Dickinson & Co. announced that for the
fourth quarter of 2014 is $0.60 per share, which is an increase of about 10%
from the previous quarter. Shareholders will receive the dividend on December
31, 2014. Management has set a guidance of $2.40 per share for fiscal year
2015. This announcement caused an increase in stock price, from $131.11 on
November 24 to $134.73 on November 25.
“Becton Dickinson to acquire CareFusion for $12.2 billion in
cash, stock”
Reuters—October 5, 2014
BD and CareFusion agreed upon the acquisition of CareFusion by BD for $12.2
billion in cash and stock. Goldman Sachs approved BD for a $9.1 billion loan to
finance the acquisition. BD also announces that, within the first full year of the
acquisition, they will experience double-digit earnings growth. The deal is
expected to close around Q2 of fiscal year 2015. More details on the acquisition
are included in the acquisitions section. The announcement of the deal caused a
stock price jump from $115.84 to $124.98.
Figure 32:
BD Three Month Stock Price
$100.00
$105.00
$110.00
$115.00
$120.00
$125.00
$130.00
$135.00
$140.00
$145.00
Source: Yahoo Finance
Figure 33:
BD Dividends per Quarter
Figure 34:
Goldman Sachs Group Inc. Logo
Source: BD 10-K
Source: Google Images
$-
$0.10
$0.20
$0.30
$0.40
$0.50
$0.60
First Quarter Second
Quarter
Third Quarter Fourth
Quarter
2012 2013 2014
Source: Yahoo Finance
December 5, 2014
UOIG 13
University of Oregon Investment Group
Catalysts
Upside
 The large acquisition of CareFusion Corporation will increase revenues
and positioning in the medication management industry significantly,
as well as supplement BD’s current products.
 The PPACA will benefit BD through the expansion of healthcare
offerings in the US, which will increase the amount of people with
health insurance, hospital and clinic visits, as well as total health
expenditure, which will boost BD sales.
 The rapid growth in the adult population age 65 and over will increase
demand for BD product, since this population, on average, requires
more medical care.
 Strategies to cut costs in the manufacturing of products and increased
focus on research and development will increase organic growth.
Downside
 There is strong competition in the Medical Instrument and Supply
Manufacturing industry, such as Johnson & Johnson and Baxter
International.
 Reduced reimbursements of BD’s products, the medical device excise
tax, as well as reductions in payments from Medicare and Medicaid to
hospitals from the PPACA could adversely affect BD’s sales.
 The rapid advancements in medical technology could make some of
BD’s products obsolete if planned acquisitions and R&D developments
do not benefit the company as expected.
 Because of its international operations, BD is subject to foreign
currency exchange fluctuations and local economic factors, which
could adversely affect sales.
Comparable Analysis
Comparable companies were screened for estimated growth rates for EPS, beta,
D/E, as well as gross profit margins. Other metrics considered were industry,
sector, company size, market capitalization, and headquarter location. All
comparable companies, except for Covidien Plc are based in the United States.
Projected revenue growth for the comparable companies is very similar to that
of BDX, and is a good indicator of performance. Finally, companies were also
screened for their product offerings and exposure to international markets.
Initially, 10 large market capitalization companies in the Healthcare sector were
considered. This was reduced to 5 after using the metrics mentioned above.
The comparable analyses are below.
Boston Scientific Corporation (BSX)—35%
Boston Scientific Corporation develops, manufactures, and markets medical
devices for use in various interventional medical specialties worldwide. The
company operates in three segments: Cardiovascular, Rhythm Management, and
MedSurg. It offers interventional cardiology products, stents, balloon catheters,
as well as cardiac rhythm management devices.—Yahoo Finance
Boston Scientific Corporation was chosen because it has the closest revenue
growth than any of the other companies, its net margin was very close to BD’s,
Johnson & Johnson 8.40%
Stryker 4.90%
Becton, Dickinson & Co. 3.20%
Baxter International 2.10%
Boston Scientific Corp. 1.90%
Covidien PLC 1.30%
Other 78.20%
Figure 36:
Estimated Industry Market Share
Source: IBIS World
Figure 37:
Boston Scientific Corporation Logo
Source: Google Images
Figure 35:
BD Vacutainer™ Tubes
Source: bd.com
December 5, 2014
UOIG 14
University of Oregon Investment Group
and it had a very similar debt to equity ratio. Not only this, but it has a very
close EV/EBITDA ratio, which is a good indicator of cash flow. It was
weighted higher than Covidien Plc because, while Covidien has similar metrics
to both Boston Scientific Corporation and BD, Boston Scientific Corporation is
has a greater market share in the Medical Instrument and Supply Manufacturing
Industry.
Covidien Plc (COV)—25%
Covidien plc develops, manufactures, and sells healthcare products for use in
clinical and home settings worldwide, and markets its products through a direct
sales force and third-party distributors. The company operates through Medical
Devices and U.S. Medical Supplies segments. It sells advanced surgical
solutions, general surgical solutions, and access and delivery products to support
procedures.—Yahoo Finance
Covidien Plc showed very similar revenue growth rates to that of BD. Their
gross margins are also similar, as well as their betas. However, it was
announced in mid-2014 that Covidien would be acquired by medical device
manufacturer Medtronic Inc. Therefore, this acquisition, combined with the fact
that it has a lower market share in the industry than Boston Scientific
Corporation, is the reason it was weighted lower.
Thermo Fisher Scientific, Inc. (TMO)—15%
Thermo Fisher Scientific Inc. provides analytical instruments, equipment,
reagents and consumables, software, and services for research, manufacturing,
analysis, discovery, and diagnostics in the United States and internationally. It
operates in three segments: Analytical Technologies; Specialty Diagnostics; and
Laboratory Products and Services. It serves pharmaceutical, biotechnology,
academic, government, environmental, and other research and industrial
markets.—Yahoo Finance
Thermo Fisher Scientific Inc. was chosen as a comparable company because of
its similar gross margin, expected revenue growth, and EBITDA margin. It also
operates in the same industry as BD. However, its market capitalization and
enterprise value are much larger than BD’s, and its beta is a good deal higher
than BD’s.
CR Bard Inc. (BCR)—15%
C. R. Bard, Inc. designs, manufactures, packages, distributes, and sells medical,
surgical, diagnostic, and patient care devices worldwide. It offers vascular
products, urology products, surgical specialty products, as well as catheter
stabilization devices. It sells its products directly to hospitals, individual
healthcare professionals, extended care facilities, and alternate site facilities.—
Yahoo Finance.
CR Bard Inc. has similar estimated sales growth rates to BD for 2014-2016. Net
margin, as well as gross margin, were similar, indicating similar cost structures.
However, it has significantly a smaller market capitalization and enterprise
value than BD, hence the lower weighting.
Baxter International, Inc. (BAX)—10%
Baxter International Inc. manufactures, develops, and markets products for
people with hemophilia, immune disorders, infectious diseases, kidney diseases,
trauma, and other chronic and acute medical conditions. Baxter International is
organized into two business segments: Medical Products and Bioscience. It sells
its products through its direct sales force, independent distributors, drug
Figure 38:
Covidien Plc Logo
Source: Google Images
Figure 39:
Thermo Fisher Scientific, Inc. Logo
Source: Google Images
Figure 40:
CR Bard Inc. Logo
Source: Google Images
December 5, 2014
UOIG 15
University of Oregon Investment Group
wholesalers, and specialty pharmacies or other alternate site providers to
hospitals. It operates domestically and internationally.—Yahoo Finance
Baxter International, Inc. has a very similar business model as BD. Two of
BD’s business segments are even the same as Baxter’s. However, estimated
revenue and EPS growth between 2014 and 2016 differ between the companies.
BD also has a higher gross margin than Baxter International. Even though it is a
direct competitor to BD, Baxter International is weighted the lowest due to the
reasons stated above.
Discounted Cash Flow Analysis
The discounted cash flow analysis of BD was took into account both BD’s
historical financial data and CareFusion’s. This is because the acquisition of
CareFusion is so large that will have a significant impact on future performance.
Therefore, all historical data was combined in their respective categories, and
then forecasted together. A percentage of revenue method was used to predict
future financial data. Management guidance, industry expectations, historical
trends, and analyst expectations for both companies was taken into account
when forecasting data. In the final price target, the discounted cash flow
analysis was weighted higher than the comparable analysis because the
discounted cash flow analysis will be a better representative of future
performance than the comparable analysis.
Revenue Model
The revenue model was created by breaking out both companies into their
respective business segments and, if applicable, then the segments’ smaller
organizational units. Financial data from 2009 until 2013 (2014 for CareFusion
because their fiscal year ended June 30) was used, and then projected out until
2023, which was the terminal year for analysis.
Factors that influenced BD revenue growth rates were the aging adult
population, increases in healthcare expenditures, planned new product releases,
and synergies created through the acquisition of CareFusion. CareFusion
revenue growth rates were affected by management guidance and historical
trends.
Once both companies were forecasted out individually, their historical and
projected revenues were combined into one revenue model, to show how
CareFusion will increase BD’s revenues substantially, and how the combined
company’s sales will trend in the future.
Beta
Beta was calculated using a variety of methods. First, the 1, 3, and 5 year daily
betas were calculated for both BD and CareFusion by regressing their historical
stock prices against those of the S&P 500. The 3 and 5 year weekly betas were
then calculated for both companies. Weighted betas for the 1, 3, and 5 year
daily and 3 and 5 year weekly were then calculated by weighting a companies’
beta according to its market capitalization size.
Vasicek and Hamada betas were calculated using both a blend of comparable
companies and an ETF specific to the Medical Instrument and Supply
Manufacturing Industry. The Vasicek and Hamada betas were weighted higher
than the 1 year and 3 year daily weighted mix betas because of the large change
that is occurring through the acquisition of CareFusion by BD. These betas
were also used because of consolidation within the industry, and BD will move
Figure 41:
CR Bard Inc. Logo
Source: Google Images
Figure 42:
Projected Revenues Through 2023
Source: UOIG Spreads
$Millions
Figure 43:
Beta
Source: UOIG Spreads
Beta SE Weighting
1 Year Daily-BDX 0.79 0.08 0.00%
3 Year Daily-BDX 0.75 0.03 0.00%
5 Year Daily-BDX 0.71 0.02 0.00%
3 Year Weekly-BDX 0.72 0.08 0.00%
5 Year Weekly-BDX 0.66 0.05 0.00%
1 Year Daily-CFN 0.82 0.16 0.00%
3 Year Daily-CFN 0.84 0.06 0.00%
5 Year Daily-CFN 0.88 0.04 0.00%
3 Year Weekly-CFN 0.58 0.16 0.00%
5 Year Weekly-CFN 0.70 0.09 0.00%
1 Year Daily-Weighted Mix 0.80 10.00%
3 Year Daily-Weighted Mix 0.78 10.00%
5 Year Daily-Weighted Mix 0.76 0.00%
3 Year Weekly-Weighted Mix 0.68 0.00%
5 Year Weekly-Weighted Mix 0.67 0.00%
3 Year Daily Vasicek - Comps 0.81 20.00%
3 Year Daily Vasicek - ETF 1.04 20.00%
3 year Daily Hamada - Comps 0.87 20.00%
3 Year Daily Hamada - ETF 1.18 20.00%
Becton, Dickinson & Co. Beta 0.94
$-
$2,000.00
$4,000.00
$6,000.00
$8,000.00
$10,000.00
$12,000.00
$14,000.00
$16,000.00
$18,000.00
December 5, 2014
UOIG 16
University of Oregon Investment Group
toward the industry average over time. Also, the weighted mix betas were used
instead of the individual betas of the companies because they will be better
indicators of future performance.
After assigning weightings to each of the betas, a final beta of .94 was reached.
Cost of Goods Sold
The cost of goods sold was projected for the combined company. Cost of goods
sold as a percentage of revenue was projected to decrease because of BD’s
Project ReLoCo and Lean Six Sigma projects. These two projects will drive
down the cost of manufacturing goods and increase efficiencies.
Selling, General and Administrative
Growth in Selling, General and Administrative is due to increases in rent
payments, salary expenditure, and other payments for operations. In 2013
SG&A was higher due to an unfavorable litigation against BD that resulted in a
$341 million charge. SG&A projections were based off historical percentages
of revenue, and are predicted to gradually increase.
Research and Development
Research and Development is projected to increase as a percentage of revenue
going through 2023. R&D is critical to the success of firms like BD, so as BD
continues their cost cutting strategies into the future, some of the savings will be
directed towards research and development.
Depreciation and Amortization
Depreciation and Amortization was projected to increase as a percentage of Net
PP&E Beginning through the terminal year. This is because of plans to continue
expanding operations into emerging markets, as well as a continued strategy of
small acquisitions to fill “gaps” in BD’s product line. Historical data for both
BD and CareFusion were combined and projected into the terminal year
together.
Net Working Capital
Projections for Net Working Capital were primarily based off of historical
trends. Both companies’ historical data were added together and then projected
together. They were projected forward as a percentage of revenue.
Capital Expenditures
Capital Expenditures, like Net Working Capital, were also projected using a
percentage of revenue method. Both BD’s and CareFusion’s historical data was
combined, and then the combined company’s Capital Expenditures were
projected. Projection growth rates increase year to year because of the
expectations to expand operations, therefore increasing capital expenditures.
Cost of Debt
Cost of Debt was calculated by combining both BD’s debt and CareFusion’s
debt together. This is because, after the merger, BD will take on all of
CareFusion’s short term and long term debt. Also, BD’s loan of $9.1 billion
from Goldman Sachs was factored into Cost of Debt because of its significant
value. The resulting Cost of Debt is 3.8%
Tax Rate
The tax rate calculated was for the combined company through the terminal
year. It was based off both BD’s and CareFusion’s historical tax rates. Also,
Figure 45:
Beta Sensitivity Table
Source: UOIG Spreads
Figure 46:
Beta Sensitivity Table
ImpliedPrice Undervalued/(Overvalued)
Terminal Growth Rate Terminal Growth Rate
158 2.0% 2.5% 3.0% 3.5% 4.0%
0.74 156.30 183.96 221.79 276.65 363.39
0.84 134.77 156.70 185.72 225.93 285.37
0.94 116.83 134.54 157.38 187.92 230.85
1.04 101.64 116.18 134.52 158.36 190.60
1.14 88.62 100.72 115.70 134.72 159.67
AdjustedBeta
Undervalued/(Overvalued)
Terminal Growth Rate
0 2.00% 2.50% 3.00% 3.50% 4.00%
0.74 10.80% 30.41% 57.23% 96.12% 157.61%
0.84 (4.46%) 11.09% 31.66% 60.17% 102.30%
0.94 (17.18%) (4.62%) 11.57% 33.22% 63.65%
1.04 (27.95%) (17.64%) (4.64%) 12.26% 35.12%
1.14 (37.18%) (28.60%) (17.98%) (4.50%) 13.19%
AdjustedBeta
Figure 44:
Cost of Goods Sold
Source: UOIG Spreads
42.80%
43.00%
43.20%
43.40%
43.60%
43.80%
44.00%
44.20%
44.40%
44.60%
December 5, 2014
UOIG 17
University of Oregon Investment Group
tax rates of comparable companies were taken into account. As mentioned
previously, a 2.3% medical device excise tax was enacted on January 1, 2013.
However, this tax was factored into operating expenses and was not factored
into the effective tax rate. An effective tax rate of 21.63% was calculated for the
terminal year.
Recommendation
I recommend a hold for both the Tall Firs Portfolio and the Svigals’ Portfolio.
The acquisition of CareFusion will increase BD’s sales significantly through
CareFusion’s complementary product line. Not only this, but BD will be able to
offer CareFusion’s products to a larger customer base through their independent
distribution channels in emerging markets. Additionally, BD’s development of
their already superior products, their effort to strengthen their brand equity, and
their ability to cut costs through economies of scale will bolster organic growth.
With an undervaluation of 17.66%, Becton, Dickinson & Co. is a strong hold for
both portfolios.Source: UOIG Spreads
Method: Price Objective Weighting
DCF Analysis $158.17 60%
Comparable Analysis $177.68 40%
Price Target $165.97
Current Price $141.06
Undervalued 17.66%
Final Price Target
Figure 47:
Final Implied Price
UOIG 18
December 5, 2014University of Oregon Investment Group
Appendix 1 – Relative Valuation
Comparables Analysis BDX BSX COV TMO BCR BAX
($ in millions)
Becton,
Dickinson & Co.
Boston Scientific
Corporation Covidien Plc
Thermo Fisher
Scientific, Inc. CR Bard Inc.
Baxter
International
Stock Characteristics Max Min Median Weight Avg. 35.00% 25.00% 15.00% 15.00% 10.00%
Current Price $171.27 $12.94 $115.31 $33.03 $141.06 $12.94 $101.62 $129.00 $171.27 $73.44
Beta 1.19 0.76 0.96 1.03 0.94 1.17 0.99 1.19 0.79 0.76
Size
Short-TermDebt 3,088.00 - 300.00 755.20 208.00 3.00 1,007.00 3,088.00 - 392.00
Long-TermDebt 14,856.00 1,403.00 6,562.50 5,303.90 14,856.00 4,249.00 4,042.00 11,388.00 1,403.00 8,876.00
Cash and Cash Equivalent 4,380.00 246.00 1,100.00 828.30 4,380.00 246.00 1,228.00 544.00 972.00 2,078.00
Non-Controlling Interest - - - - - - - - - -
Preferred Stock - - - - - - - - - -
Diluted Basic Shares 1,326.00 75.00 426.00 702.55 192.00 1,326.00 452.00 400.00 75.00 542.00
Market Capitalization 51,600.00 12,845.25 33,444.00 31,135.75 27,083.52 17,158.44 45,932.24 51,600.00 12,845.25 39,804.48
Enterprise Value 65,532.00 13,276.25 42,381.00 36,366.55 37,767.52 21,164.44 49,753.24 65,532.00 13,276.25 46,994.48
Growth Expectations
% Revenue Growth 2015E 3.83% .39% 0.04 3.37% 3.41% 3.77% 3.52% 3.71% 3.83% .39%
% Revenue Growth 2016E 4.59% 3.75% 0.04 4.10% 4.12% 3.97% 4.26% 3.91% 4.59% 3.75%
% EBITDA Growth 2015E 8.91% (9.09%) 0.05 5.60% (9.09%) 7.67% 3.72% 8.91% 5.51% (1.78%)
% EBITDA Growth 2016E 7.46% 4.92% 0.06 6.35% 4.92% 6.34% 5.73% 7.46% 6.19% 6.54%
% EPS Growth 2015E 11.58% (3.89%) 0.09 7.46% 9.01% 9.64% 4.58% 11.58% 10.63% (3.89%)
% EPS Growth 2016E 10.99% 5.12% 0.09 9.98% 5.12% 10.99% 9.22% 10.77% 9.40% 8.10%
Profitability Margins
Gross Margin 70.41% 48.89% 0.59 61.17% 59.06% 70.41% 59.58% 48.89% 61.71% 50.43%
EBIT Margin 24.52% 14.23% 0.22 19.78% 20.21% 14.23% 22.81% 22.00% 24.52% 21.17%
EBITDA Margin 29.59% 23.75% 0.27 26.10% 26.65% 23.75% 28.24% 24.33% 29.59% 26.39%
Net Margin 17.76% 15.03% 0.16 16.39% 15.84% 15.03% 17.76% 16.58% 17.33% 16.07%
Credit Metrics
Interest Expense $433.00 $45.00 211.50 $215.05 $232.00 $219.00 $204.00 $433.00 $45.00 $157.00
Debt/EV 0.40 0.10 0.20 0.16 0.40 0.20 0.10 0.22 0.11 0.20
Leverage Ratio 4.57 1.43 2.27 2.22 4.57 2.42 1.68 3.54 1.43 2.12
Interest Coverage Ratio 27.87 8.03 14.49 13.97 14.22 8.03 14.75 9.43 21.78 27.87
Operating Results
Revenue $16,787.00 $3,312.00 11,519.00 $9,929.25 $12,379.00 $7,405.00 $10,659.00 $16,787.00 $3,312.00 $16,579.00
Gross Profit $8,360.00 $2,044.00 6,831.00 $5,786.45 $7,311.00 $5,214.00 $6,351.00 $8,208.00 $2,044.00 $8,360.00
EBIT $3,693.00 $812.00 2,466.50 $2,003.40 $2,502.00 $1,054.00 $2,431.00 $3,693.00 $812.00 $3,510.00
EBITDA $4,376.00 $980.00 3,154.50 $2,565.35 $3,299.00 $1,759.00 $3,010.00 $4,084.00 $980.00 $4,376.00
Net Income $2,783.00 $574.00 1,926.86 $1,632.85 $1,960.72 $1,113.00 $1,893.00 $2,783.00 $574.00 $2,665.00
Capital Expenditures $1,810.00 $96.00 405.00 $450.05 $674.00 $267.00 $397.00 $413.00 $96.00 $1,810.00
Multiples
EV/Revenue 4.67x 2.83x 3.48x 3.64x 3.05x 2.86x 4.67x 3.90x 4.01x 2.83x
EV/Gross Profit 7.98 4.06 6.06 6.11 5.17 4.06 7.83 7.98 6.50 5.62
EV/EBIT 20.47 13.39 17.05 18.60 15.09 20.08 20.47 17.74 16.35 13.39
EV/EBITDA 16.53 10.74 12.79 13.86 11.45 12.03 16.53 16.05 13.55 10.74
EV/(EBITDA-Capex) 19.04 14.19 16.43 16.49 14.39 14.19 19.04 17.85 15.02 18.31
Market Cap/Net Income = P/E 24.26 13.81 16.98 19.09 13.81 15.42 24.26 18.54 22.38 14.94
Multiple Implied Price Weight
EV/Revenue 178.88 15.00%
EV/Gross Profit 177.13 20.00%
EV/EBIT 186.71 15.00%
EV/EBITDA 182.44 20.00%
EV/(EBITDA-Capex) 169.76 30.00%
Market Cap/Net Income = P/E 194.98 0.00%
Price Target $177.68
Current Price 141.06
Undervalued 25.96%
UOIG 19
December 5, 2014University of Oregon Investment Group
Appendix 2 – Discounted Cash Flows Valuation
DiscountedCash FlowAnalysis Q1 Q2 Q3 Q4
($ in millions) 2009A 2010A 2011A 2012A 2013A 12/31/2013A 03/31/2014A 06/30/2014A 09/30/2014E 2014E 2015E 2016E 2017E 2018E 2019E 2020E 2021E 2022E 2023E
Total Revenue $10,066.00 $10,502.00 $11,023.00 $11,306.00 $11,604.00 $2,937.00 $3,039.00 $3,279.00 $3,124.00 $12,379.00 $12,800.59 $13,327.48 $13,865.51 $14,412.36 $14,958.39 $15,494.61 $16,022.46 $16,538.32 $17,038.35
% YoY Growth .97% 4.33% 4.96% 2.57% 2.64% 6.05% 3.55% 5.07% 4.81% 6.68% 3.41% 4.12% 4.04% 3.94% 3.79% 3.58% 3.41% 3.22% 3.02%
Cost of Goods Sold 4517.00 4456.00 4123.00 4840.00 4307.00 1201.00 1202.00 1285.00 1380.00 $5,068.00 $5,677.06 $5,872.09 $6,080.03 $6,302.53 $6,529.34 $6,743.25 $6,961.76 $7,175.98 $7,384.42
% Revenue 44.87% 42.43% 37.40% 42.81% 37.12% 40.89% 39.55% 39.19% 44.17% 40.94% 44.35% 44.06% 43.85% 43.73% 43.65% 43.52% 43.45% 43.39% 43.34%
Gross Profit $5,549.00 $6,046.00 $6,900.00 $6,466.00 $7,297.00 $1,736.00 $1,837.00 $1,994.00 $1,744.00 $7,311.00 $7,123.53 $7,455.39 $7,785.49 $8,109.84 $8,429.06 $8,751.36 $9,060.70 $9,362.34 $9,653.93
Gross Margin 55.13% 57.57% 62.60% 57.19% 62.88% 59.11% 60.45% 60.81% 55.83% 59.06% 55.65% 55.94% 56.15% 56.27% 56.35% 56.48% 56.55% 56.61% 56.66%
Selling General and Administrative Expense 2736.00 2781.00 2891.00 2956.00 3402.00 788.00 789.00 826.00 826.00 3,229.00 3,360.16 3,507.79 3,653.56 3,801.98 3,952.01 4,098.32 4,241.15 4,381.00 4,516.87
% Revenue 27.18% 26.48% 26.23% 26.15% 29.32% 26.83% 25.96% 25.19% 26.44% 26.08% 26.25% 26.32% 26.35% 26.38% 26.42% 26.45% 26.47% 26.49% 26.51%
Depreciation and Amortization 659.00 658.00 680.00 709.00 730.00 235.00 183.00 195.00 184.00 797.00 $805.88 $863.32 $920.11 $977.73 $1,036.24 $1,095.81 $1,155.53 $1,216.12 $1,276.20
% PP&E Beginning 19.60% 18.58% 18.58% 18.98% 18.79% 5.96% 4.63% 4.88% 4.49% 19.45% 19.67% 19.72% 19.77% 19.83% 19.88% 19.94% 19.98% 20.03% 20.07%
Research and Development 565.00 571.00 616.00 636.00 686.00 173.00 194.00 184.00 189.00 740.00 725.79 761.00 802.81 843.12 879.55 915.73 951.73 988.99 1,024.00
% Revenue 5.61% 5.44% 5.59% 5.63% 5.91% 5.89% 6.38% 5.61% 6.05% 5.98% 5.67% 5.71% 5.79% 5.85% 5.88% 5.91% 5.94% 5.98% 6.01%
Other Expense 72.00 3.00 51.00 33.00 59.00 10.00 8.00 8.00 17.00 43.00 38.40 39.98 41.60 43.24 44.88 46.48 48.07 49.61 51.12
% Revenue .72% .03% .46% .29% .51% .34% .26% .24% .54% .35% .30% .30% .30% .30% .30% .30% .30% .30% .30%
Earnings Before Interest & Taxes $1,517.00 $2,033.00 $2,662.00 $2,132.00 $2,420.00 $530.00 $663.00 $781.00 $528.00 $2,502.00 $2,193.30 $2,283.30 $2,367.40 $2,443.77 $2,516.38 $2,595.00 $2,664.23 $2,726.61 $2,785.75
% Revenue 15.07% 19.36% 24.15% 18.86% 20.85% 18.05% 21.82% 23.82% 16.90% 20.21% 17.13% 17.13% 17.07% 16.96% 16.82% 16.75% 16.63% 16.49% 16.35%
Interest Expense 141.00 156.00 163.00 222.00 214.00 55.00 60.00 53.00 64.00 232.00 256.01 259.89 249.58 252.22 254.29 255.66 256.36 256.34 255.58
% Revenue 1.40% 1.49% 1.48% 1.96% 1.84% 1.87% 1.97% 1.62% 2.05% 1.87% 2.00% 1.95% 1.80% 1.75% 1.70% 1.65% 1.60% 1.55% 1.50%
Interest (Income) (33.00) (35.00) (43.00) (50.00) (40.00) (14.00) (10.00) (12.00) (10.00) (46.00) (44.80) (46.65) (48.53) (50.44) (52.35) (54.23) (56.08) (57.88) (59.63)
% Revenue (.33%) (.33%) (.39%) (.44%) (.34%) (.48%) (.33%) (.37%) (.32%) (.37%) (.35%) (.35%) (.35%) (.35%) (.35%) (.35%) (.35%) (.35%) (.35%)
Earnings Before Taxes 1,409.00 1,912.00 2,542.00 1,960.00 2,246.00 489.00 613.00 740.00 474.00 2,316.00 1,982.09 2,070.06 2,166.35 2,241.99 2,314.44 2,393.57 2,463.95 2,528.15 2,589.81
% Revenue 14.00% 18.21% 23.06% 17.34% 19.36% 16.65% 20.17% 22.57% 15.17% 18.71% 15.48% 15.53% 15.62% 15.56% 15.47% 15.45% 15.38% 15.29% 15.20%
Less Taxes (Benefits) 464.00 577.00 543.00 489.00 390.00 122.00 106.00 123.00 98.00 449.00 436.06 454.58 474.86 490.32 505.24 521.56 535.66 548.36 560.18
TaxRate 32.93% 30.18% 21.36% 24.95% 17.36% 24.95% 17.29% 16.62% 20.68% 19.39% 22.00% 21.96% 21.92% 21.87% 21.83% 21.79% 21.74% 21.69% 21.63%
Loss fromdiscontinued operations (342.00) (226.00) (23.00) (70.00) (359.00) - - - (93.72) (93.72) (128.01) (133.27) (138.66) (144.12) (149.58) (154.95) (160.22) (165.38) (170.38)
% Revenue (3.40%) (2.15%) (.21%) (.62%) (3.09%) 0.00% 0.00% 0.00% (3.00%) (.76%) (1.00%) (1.00%) (1.00%) (1.00%) (1.00%) (1.00%) (1.00%) (1.00%) (1.00%)
Net Income $1,287.00 $1,561.00 $2,022.00 $1,541.00 $2,215.00 $367.00 $507.00 $617.00 $469.72 $1,960.72 $1,674.04 $1,748.75 $1,830.14 $1,895.79 $1,958.78 $2,026.96 $2,088.51 $2,145.18 $2,200.01
Net Margin 12.79% 14.86% 18.34% 13.63% 19.09% 12.50% 16.68% 18.82% 15.04% 15.84% 13.08% 13.12% 13.20% 13.15% 13.09% 13.08% 13.03% 12.97% 12.91%
Add Back: Depreciation and Amortization 659.00 658.00 680.00 709.00 730.00 235.00 183.00 195.00 184.00 797.00 805.88 863.32 920.11 977.73 1,036.24 1,095.81 1,155.53 1,216.12 1,276.20
Add Back: Interest Expense*(1-TaxRate) 94.57 108.92 128.18 166.61 176.84 41.28 49.62 44.19 50.77 187.02 199.69 202.81 194.87 197.06 198.78 199.95 200.63 200.74 200.29
Operating Cash Flow $2,040.57 $2,327.92 $2,830.18 $2,416.61 $3,121.84 $643.28 $739.62 $856.19 $704.49 $2,944.74 $2,679.60 $2,814.88 $2,945.13 $3,070.58 $3,193.80 $3,322.73 $3,444.66 $3,562.05 $3,676.50
% Revenue 20.27% 22.17% 25.68% 21.37% 26.90% 21.90% 24.34% 26.11% 22.55% 23.79% 20.93% 21.12% 21.24% 21.31% 21.35% 21.44% 21.50% 21.54% 21.58%
Current Assets 5,017.00 4,812.00 4,989.00 5,121.00 5,318.00 5,584.00 5,685.00 5,802.00 5,803.77 5,803.77 5,770.51 6,037.35 6,306.04 6,580.68 6,825.52 7,125.97 7,389.56 7,640.70 7,893.87
% Revenue 49.84% 45.82% 45.26% 45.29% 45.83% 190.13% 187.07% 176.94% 185.78% 46.88% 45.08% 45.30% 45.48% 45.66% 45.63% 45.99% 46.12% 46.20% 46.33%
Current Liabilities 2,486.00 2,425.00 2,442.00 2,911.00 2,722.00 3,069.00 3,090.00 3,288.00 2,719.13 2,719.13 2,598.52 2,721.47 2,846.59 2,968.95 3,099.38 3,225.98 3,351.90 3,479.66 3,607.02
% Revenue 24.70% 23.09% 22.15% 25.75% 23.46% 104.49% 101.68% 100.27% 87.04% 21.97% 20.30% 20.42% 20.53% 20.60% 20.72% 20.82% 20.92% 21.04% 21.17%
Net Working Capital $2,531.00 $2,387.00 $2,547.00 $2,210.00 $2,596.00 $2,515.00 $2,595.00 $2,514.00 $3,084.64 $3,084.64 $3,171.99 $3,315.88 $3,459.45 $3,611.74 $3,726.14 $3,899.99 $4,037.66 $4,161.04 $4,286.85
% Revenue 25.14% 22.73% 23.11% 19.55% 22.37% 85.63% 85.39% 76.67% 98.74% 24.92% 24.78% 24.88% 24.95% 25.06% 24.91% 25.17% 25.20% 25.16% 25.16%
Change in Working Capital $248.00 ($144.00) $160.00 ($337.00) $386.00 ($81.00) $80.00 ($81.00) $570.64 $488.64 $87.35 $143.89 $143.57 $152.29 $114.40 $173.86 $137.67 $123.38 $125.81
Capital Expenditures 704.00 665.00 653.00 596.00 677.00 117.00 134.00 149.00 274.00 674.00 692.51 725.02 758.44 795.56 833.18 869.25 906.87 942.68 979.71
% Revenue 6.99% 6.33% 5.92% 5.27% 5.83% 3.98% 4.41% 4.54% 8.77% 5.44% 5.41% 5.44% 5.47% 5.52% 5.57% 5.61% 5.66% 5.70% 5.75%
Acquisitions 41.00 505.00 492.00 253.00 136.00 473.00 57.00 42.00 8.00 580.00 394.26 414.48 438.15 464.08 486.15 514.42 536.75 560.65 584.42
% Revenue .41% 4.81% 4.46% 2.24% 1.17% 16.10% 1.88% 1.28% .26% 4.69% 3.08% 3.11% 3.16% 3.22% 3.25% 3.32% 3.35% 3.39% 3.43%
UnleveredFree Cash Flow $1,047.57 $1,301.92 $1,525.18 $1,904.61 $1,922.84 $134.28 $468.62 $746.19 ($148.15) $1,202.10 $1,505.48 $1,531.49 $1,604.96 $1,658.65 $1,760.07 $1,765.20 $1,863.37 $1,935.33 $1,986.58
DiscountedFree Cash Flow $1,421.05 $1,364.52 $1,349.78 $1,316.70 $1,318.85 $1,248.51 $1,244.03 $1,219.60 $1,181.68
UOIG 20
December 5, 2014University of Oregon Investment Group
Appendix 3—Revenue Model
Combined Revenue Model
Revenue Model Q1/Q2 Q2/Q3 Q3/Q4 Q4/Q1
($ in millions) 2009A 2010A 2011A 2012A 2013A 12/31/2013A 03/31/2014A 06/30/2014A 09/30/2014E 2014E 2015E 2016E 2017E 2018E 2019E 2020E 2021E 2022E 2023E
Becton, Dickinson and Co. 6986.00 7125.00 7583.00 7708.00 8054.00 2015.00 2071.00 2157.00 2202.00 8445.00 8798.38 9167.91 9551.26 9946.63 10344.43 10735.66 11121.80 11499.45 11865.37
% Growth 1.28% 1.99% 6.43% 1.65% 4.49% 6.05% 3.55% 5.07% 4.81% 4.85% 4.18% 4.20% 4.18% 4.14% 4.00% 3.78% 3.60% 3.40% 3.18%
% of Total Revenue 69.40% 67.84% 68.79% 68.18% 69.41% 68.61% 68.15% 65.78% 70.49% 68.22% 68.73% 68.79% 68.88% 69.01% 69.15% 69.29% 69.41% 69.53% 69.64%
CareFusion Corporation 3080.00 3377.00 3440.00 3598.00 3550.00 922.00 968.00 1122.00 922.00 3934.00 4002.22 4159.58 4314.26 4465.73 4613.97 4758.95 4900.66 5038.87 5172.98
% Growth .23% 9.64% 1.87% 4.59% (1.33%) 1.43% 7.44% 24.25% 11.08% 8.23% 4.17% 3.93% 3.72% 3.51% 3.32% 3.14% 2.98% 2.82% 2.66%
% of Total Revenue 30.60% 32.16% 31.21% 31.82% 30.59% 31.39% 31.85% 34.22% 29.51% 31.78% 31.27% 31.21% 31.12% 30.99% 30.85% 30.71% 30.59% 30.47% 30.36%
Total Revenue $10,066.00 $10,502.00 $11,023.00 $11,306.00 $11,604.00 $2,937.00 $3,039.00 $3,279.00 $3,124.00 $12,379.00 $12,800.59 $13,327.48 $13,865.51 $14,412.36 $14,958.39 $15,494.61 $16,022.46 $16,538.32 $17,038.35
% Growth .97% 4.33% 4.96% 2.57% 2.64% 4.56% 4.76% 10.93% 6.58% 6.68% 3.41% 4.12% 4.04% 3.94% 3.79% 3.58% 3.41% 3.22% 3.02%
Becton, Dickinson and Co.
Revenue Model Q1 Q2 Q3 Q4
($ in millions) 2009A 2010A 2011A 2012A 2013A 12/31/2013A 03/31/2014A 06/30/2014A 09/30/2014E 2014E 2015E 2016E 2017E 2018E 2019E 2020E 2021E 2022E 2023E
BD Medical 3556.00 3797.00 4007.00 4090.00 4306.00 1064.00 1116.00 1201.00 1193.00 4574.00 4767.90 4978.64 5206.44 5449.87 5699.50 5946.41 6193.50 6435.29 6671.46
% Growth 0.40% 6.75% 5.53% 2.07% 5.28% 8.24% 5.08% 5.35% 6.52% 6.22% 4.24% 4.42% 4.58% 4.68% 4.58% 4.33% 4.16% 3.90% 3.67%
% of Total Revenue 50.90% 53.29% 52.84% 53.06% 53.46% 52.80% 53.89% 55.68% 54.18% 54.16% 54.19% 54.31% 54.51% 54.79% 55.10% 55.39% 55.69% 55.96% 56.23%
BD Diagnostics 2226.00 2319.00 2480.00 2538.00 2646.00 672.00 653.00 679.00 708.00 2712.00 2827.79 2942.67 3055.34 3165.64 3273.61 3379.11 3480.94 3581.33 3677.72
% Growth 3.06% 4.18% 6.94% 2.34% 4.26% 3.07% (.91%) 3.66% 4.27% 2.49% 4.27% 4.06% 3.83% 3.61% 3.41% 3.22% 3.01% 2.88% 2.69%
% of Total Revenue 31.86% 32.55% 32.70% 32.93% 32.85% 33.35% 31.53% 31.48% 32.15% 32.11% 32.14% 32.10% 31.99% 31.83% 31.65% 31.48% 31.30% 31.14% 31.00%
BD Biosciences 1204.00 1009.00 1096.00 1080.00 1102.00 279.00 302.00 277.00 301.00 1159.00 1202.69 1246.59 1289.48 1331.13 1371.33 1410.13 1447.36 1482.82 1516.19
% Growth 0.75% (16.20%) 8.62% (1.46%) 2.04% 5.28% 8.24% 7.78% 8.66% 5.17% 3.77% 3.65% 3.44% 3.23% 3.02% 2.83% 2.64% 2.45% 2.25%
% of Total Revenue 17.23% 14.16% 14.45% 14.01% 13.68% 13.85% 14.58% 12.84% 13.67% 13.72% 13.67% 13.60% 13.50% 13.38% 13.26% 13.14% 13.01% 12.89% 12.78%
Total Revenue $6,986.00 $7,125.00 $7,583.00 $7,708.00 $8,054.00 $2,015.00 $2,071.00 $2,157.00 $2,202.00 $8,445.00 $8,798.38 $9,167.91 $9,551.26 $9,946.63 $10,344.43 $10,735.66 $11,121.80 $11,499.45 $11,865.37
% Growth 1.28% 1.99% 6.43% 1.65% 4.49% 6.05% 3.55% 5.07% 4.81% 4.85% 4.18% 4.20% 4.18% 4.14% 4.00% 3.78% 3.60% 3.40% 3.18%
Revenue Model Q1 Q2 Q3 Q4
($ in millions) 2009A 2010A 2011A 2012A 2013A 12/31/2013A 03/31/2014A 06/30/2014A 09/30/2014E 2014E 2015E 2016E 2017E 2018E 2019E 2020E 2021E 2022E 2023E
BD Medical
Medical Surgical Systems 1889.00 2010.00 2082.00 2105.00 2196.00 579.00 551.00 590.00 588.00 2308.00 2397.32 2493.69 2597.68 2707.30 2820.74 2932.16 3043.87 3151.93 3255.94
% Growth (5.79%) 6.41% 3.58% 1.10% 4.32% 8.02% 2.23% 5.17% 5.00% 5.10% 3.87% 4.02% 4.17% 4.22% 4.19% 3.95% 3.81% 3.55% 3.30%
% of Segment Revenue 53.12% 52.94% 51.96% 51.47% 50.99% 54.42% 49.37% 49.13% 49.29% 50.46% 50.28% 50.09% 49.89% 49.68% 49.49% 49.31% 49.15% 48.98% 48.80%
Diabetes Care 715.00 786.00 866.00 911.00 969.00 264.00 251.00 258.00 264.00 1037.00 1090.82 1149.40 1212.04 1278.94 1348.39 1418.24 1488.01 1556.61 1624.01
% Growth 3.03% 9.93% 10.18% 5.20% 6.37% 8.64% 8.19% 3.20% 8.20% 7.02% 5.19% 5.37% 5.45% 5.52% 5.43% 5.18% 4.92% 4.61% 4.33%
% of Segment Revenue 20.11% 20.70% 21.61% 22.27% 22.50% 24.81% 22.49% 21.48% 22.13% 22.67% 22.88% 23.09% 23.28% 23.47% 23.66% 23.85% 24.03% 24.19% 24.34%
Pharmaceutical Care 952.00 1001.00 1059.00 1074.00 1142.00 221.00 314.00 353.00 341.00 1229.00 1279.76 1335.56 1396.72 1463.63 1530.37 1596.02 1661.62 1726.75 1791.51
% Growth 1.06% 5.15% 5.79% 1.42% 6.33% 7.80% 7.90% 6.97% 7.91% 7.62% 4.13% 4.36% 4.58% 4.79% 4.56% 4.29% 4.11% 3.92% 3.75%
% of Segment Revenue 26.77% 26.36% 26.43% 26.26% 26.51% 20.77% 28.14% 29.39% 28.58% 26.87% 26.84% 26.83% 26.83% 26.86% 26.85% 26.84% 26.83% 26.83% 26.85%
Total Segment Revenue $3,556.00 $3,797.00 $4,007.00 $4,090.00 $4,307.00 $1,064.00 $1,116.00 $1,201.00 $1,193.00 $4,574.00 $4,767.90 $4,978.64 $5,206.44 $5,449.87 $5,699.50 $5,946.41 $6,193.50 $6,435.29 $6,671.46
% Growth 0.40% 6.78% 5.53% 2.07% 5.31% 8.24% 5.08% 5.35% 6.52% 6.20% 4.24% 4.42% 4.58% 4.68% 4.58% 4.33% 4.16% 3.90% 3.67%
Revenue Model Q1 Q2 Q3 Q4
($ in millions) 2009A 2010A 2011A 2012A 2013A 12/31/2013A 03/31/2014A 06/30/2014A 09/30/2014E 2014E 2015E 2016E 2017E 2018E 2019E 2020E 2021E 2022E 2023E
BD Diagnostics
Preanalytical Systems 1143.00 1198.00 1278.00 1301.00 1352.00 347.00 342.00 364.00 358.00 1411.00 1466.03 1520.86 1574.24 1626.03 1676.11 1725.23 1771.98 1817.52 1862.05
% Growth 1.69% 4.81% 6.68% 1.80% 3.92% 3.58% 3.64% 5.51% 4.68% 4.36% 3.90% 3.74% 3.51% 3.29% 3.08% 2.93% 2.71% 2.57% 2.45%
% of Segment Revenue 51.35% 51.66% 51.51% 51.26% 51.10% 51.64% 52.37% 53.61% 50.56% 52.03% 51.84% 51.68% 51.52% 51.37% 51.20% 51.06% 50.91% 50.75% 50.63%
Diagnostic Systems 1083.00 1121.00 1203.00 1237.00 1294.00 325.00 311.00 315.00 350.00 1301.00 1361.76 1421.81 1481.10 1539.60 1597.49 1653.88 1708.96 1763.82 1815.67
% Growth 4.54% 3.51% 7.31% 2.83% 4.61% 2.52% (5.47%) 1.61% 3.55% .54% 4.67% 4.41% 4.17% 3.95% 3.76% 3.53% 3.33% 3.21% 2.94%
% of Segment Revenue 48.65% 48.34% 48.49% 48.74% 48.90% 48.36% 47.63% 46.39% 49.44% 47.97% 48.16% 48.32% 48.48% 48.63% 48.80% 48.94% 49.09% 49.25% 49.37%
Total Segment Revenue $2,226.00 $2,319.00 $2,481.00 $2,538.00 $2,646.00 $672.00 $653.00 $679.00 $708.00 $2,712.00 $2,827.79 $2,942.67 $3,055.34 $3,165.64 $3,273.61 $3,379.11 $3,480.94 $3,581.33 $3,677.72
% Growth 3.06% 4.18% 6.99% 2.30% 4.26% 3.07% (.91%) 3.66% 4.27% 2.49% 4.27% 4.06% 3.83% 3.61% 3.41% 3.22% 3.01% 2.88% 2.69%
UOIG 21
December 5, 2014University of Oregon Investment Group
Revenue Model Q1 Q2 Q3 Q4
($ in millions) 2009A 2010A 2011A 2012A 2013A 12/31/2013A 03/31/2014A 06/30/2014A 09/30/2014E 2014E 2015E 2016E 2017E 2018E 2019E 2020E 2021E 2022E 2023E
BD Biosciences
Bioscences 1204.00 1009.00 1096.00 1080.00 1102.00 279.00 302.00 277.00 301.00 1159.00 1202.69 1246.59 1289.48 1331.13 1371.33 1410.13 1447.36 1482.82 1516.19
% Growth 0.75% (16.20%) 8.62% (1.46%) 2.04% 5.28% 8.24% 7.78% .33% 5.17% 3.77% 3.65% 3.44% 3.23% 3.02% 2.83% 2.64% 2.45% 2.25%
% of Segment Revenue 100.00% 100.00% 100.00% 100.00% 100.00% 100.00% 100.00% 100.00% 100.00% 100.00% 100% 100% 100% 100% 100% 100% 100% 100% 100%
Total Segment Revenue $1,204.00 $1,009.00 $1,096.00 $1,080.00 $1,102.00 $279.00 $302.00 $277.00 $301.00 $1,159.00 $1,202.69 $1,246.59 $1,289.48 $1,331.13 $1,371.33 $1,410.13 $1,447.36 $1,482.82 $1,516.19
% Growth 0.75% (16.20%) 8.62% (1.46%) 2.04% 5.28% 8.24% 7.78% 8.66% 5.17% 3.77% 3.65% 3.44% 3.23% 3.02% 2.83% 2.64% 2.45% 2.25%
CareFusion Corporation
Revenue Model Q1 Q2 Q3 Q4
($ in millions) 2009A 2010A 2011A 2012A 2013A 09/30/2013A 12/31/2013A 03/31/2014A 06/30/2014A 2014A 2015E 2016E 2017E 2018E 2019E 2020E 2021E 2022E 2023E
Medical Systems 2034.00 2071.00 2214.00 2439.00 2329.00 524.00 587.00 571.00 712.00 2394.00 2463.43 2529.69 2592.93 2652.83 2709.34 2762.71 2812.99 2859.97 2903.44
% Growth 0% 1.82% 6.90% 10.16% (4.51%) (4.90%) (2.49%) (2.23%) 20.27% 2.79% 2.90% 2.69% 2.50% 2.31% 2.13% 1.97% 1.82% 1.67% 1.52%
% of Total Revenue 66.04% 61.33% 64.36% 67.79% 65.61% 63.13% 63.67% 58.99% 63.46% 62.31% 61.55% 60.82% 60.10% 59.40% 58.72% 58.05% 57.40% 56.76% 56.13%
Procedural Solutions 1046.00 1306.00 1226.00 1159.00 1221.00 306.00 335.00 397.00 410.00 1448.00 1538.79 1629.89 1721.32 1812.90 1904.63 1996.24 2087.67 2178.90 2269.54
% Growth 0.00% 24.86% (6.13%) (5.46%) 5.35% 6.99% 9.12% 25.24% 31.83% 18.59% 6.27% 5.92% 5.61% 5.32% 5.06% 4.81% 4.58% 4.37% 4.16%
% of Total Revenue 33.96% 38.67% 35.64% 32.21% 34.39% 36.87% 36.33% 41.01% 36.54% 37.69% 38.45% 39.18% 39.90% 40.60% 41.28% 41.95% 42.60% 43.24% 43.87%
Total Revenue $3,080.00 $3,377.00 $3,440.00 $3,598.00 $3,550.00 $830.00 $922.00 $968.00 $1,122.00 $3,842.00 $4,002.22 $4,159.58 $4,314.26 $4,465.73 $4,613.97 $4,758.95 $4,900.66 $5,038.87 $5,172.98
% Growth .23% 9.64% 1.87% 4.59% (1.33%) (.84%) 1.43% 7.44% 24.25% 8.23% 4.17% 3.93% 3.72% 3.51% 3.32% 3.14% 2.98% 2.82% 2.66%
Appendix 3—Continued
UOIG 22
December 5, 2014University of Oregon Investment Group
Appendix 4 – Working Capital Model
Working Capital Model Q1/Q2 Q2/Q3 Q3/Q4 Q4/Q1
($ in millions) 2009A 2010A 2011A 2012A 2013A 12/31/2013A 03/31/2014A 06/30/2014A 09/30/2014E 2014E 2015E 2016E 2017E 2018E 2019E 2020E 2021E 2022E 2023E
Total Revenue $10,066.00 $10,502.00 $11,023.00 $11,306.00 $11,604.00 $2,937.00 $3,039.00 $3,279.00 $3,124.00 $12,379.00 $12,800.59 $13,327.48 $13,865.51 $14,412.36 $14,958.39 $15,494.61 $16,022.46 $16,538.32 $17,038.35
Current Assets
Accounts Receivable 1630.00 1598.00 1757.00 1691.00 1669.00 1564.00 1584.00 1778.00 1790.99 1790.99 1867.61 1959.14 2046.55 2137.35 2197.39 2316.44 2400.16 2482.40 2562.57
Days Sales Outstanding A/R 59.10 55.54 58.18 54.74 52.50 48.99 46.91 49.34 52.74 52.81 53.25 53.80 53.87 54.13 53.62 54.72 54.68 54.79 54.90
% of Revenue 16.19% 15.22% 15.94% 14.96% 14.38% 53.25% 52.12% 54.22% 57.33% 14.47% 14.59% 14.70% 14.76% 14.83% 14.69% 14.95% 14.98% 15.01% 15.04%
Inventory 1583.00 1488.00 1605.00 1631.00 1786.00 1900.00 1972.00 1994.00 1933.44 1933.44 1871.45 1960.47 2045.16 2128.71 2212.35 2294.75 2376.13 2455.94 2533.60
Days Inventory Outstanding 127.92 121.89 142.09 123.34 151.36 145.55 147.65 141.21 128.90 139.25 120.32 122.19 122.78 123.28 123.67 124.55 124.58 124.92 125.23
% of Revenue 15.73% 14.17% 14.56% 14.43% 15.39% 64.69% 64.89% 60.81% 61.89% 15.62% 14.62% 14.71% 14.75% 14.77% 14.79% 14.81% 14.83% 14.85% 14.87%
Deferred Taxes 398.00 427.00 656.00 540.00 653.00 682.00 711.00 678.00 688.53 688.53 633.63 659.71 693.28 727.82 762.88 797.97 833.17 859.99 894.51
Days Deferred Taxes Outstanding 53.10 56.04 82.82 66.86 70.06 79.62 81.10 74.69 76.69 77.83 68.83 68.83 69.26 69.87 70.46 71.26 71.70 71.65 72.28
% of Revenue 3.95% 4.07% 5.95% 4.78% 5.63% 23.22% 23.40% 20.68% 22.04% 5.56% 4.95% 4.95% 5.00% 5.05% 5.10% 5.15% 5.20% 5.20% 5.25%
Other Assets 1406.00 1299.00 971.00 1259.00 1210.00 1438.00 1418.00 1352.00 1390.80 1390.80 1397.82 1458.03 1521.05 1586.80 1652.90 1716.80 1780.10 1842.37 1903.18
Days COGS Outstanding 113.61 106.40 85.96 95.21 102.54 110.15 106.17 95.74 92.72 100.17 89.87 90.88 91.31 91.90 92.40 93.18 93.33 93.71 94.07
% of Revenue 13.97% 12.37% 8.81% 11.14% 10.43% 48.96% 46.66% 41.23% 44.52% 11.24% 10.92% 10.94% 10.97% 11.01% 11.05% 11.08% 11.11% 11.14% 11.17%
Total Current Assets $5,017.00 $4,812.00 $4,989.00 $5,121.00 $5,318.00 $5,584.00 $5,685.00 $5,802.00 $5,803.77 $5,803.77 $5,770.51 $6,037.35 $6,306.04 $6,580.68 $6,825.52 $7,125.97 $7,389.56 $7,640.70 $7,893.87
% of Revenue 49.84% 45.82% 45.26% 45.29% 45.83% 190.13% 187.07% 176.94% 185.78% 46.88% 45.08% 45.30% 45.48% 45.66% 45.63% 45.99% 46.12% 46.20% 46.33%
Long Term Assets
Net PP&E Beginning 3346.00 3362.00 3541.00 3660.00 3735.00 3885.00 3941.00 3954.00 3999.00 3885.00 4097.00 4359.77 4627.27 4891.86 5162.50 5428.83 5709.50 5997.13 6283.46
Capital Expenditures 704.00 665.00 653.00 596.00 677.00 117.00 134.00 149.00 274.00 674.00 692.51 725.02 758.44 795.56 833.18 869.25 906.87 942.68 979.71
% of Revenue 6.99% 6.33% 5.92% 5.27% 5.83% 3.98% 4.41% 4.54% 8.77% 5.44% 5.41% 5.44% 5.47% 5.52% 5.57% 5.61% 5.66% 5.70% 5.75%
Acquisitions 41.00 505.00 492.00 253.00 136.00 473.00 57.00 42.00 8.00 580.00 394.26 414.48 438.15 464.08 486.15 514.42 536.75 560.65 584.42
% of Revenue 0.41% 4.81% 4.46% 2.24% 1.17% 16.10% 1.88% 1.28% 0.26% 4.69% 3.08% 3.11% 3.16% 3.22% 3.25% 3.32% 3.35% 3.39% 3.43%
Depreciation and Amortization 659.00 658.00 680.00 709.00 730.00 235.00 183.00 195.00 184.00 797.00 824.00 872.00 932.00 989.00 1053.00 1103.00 1156.00 1217.00 1298.00
% PP&E Ending 19.60% 18.58% 18.58% 18.98% 18.79% 5.96% 4.63% 4.88% 4.49% 19.45% 18.90% 18.84% 19.05% 19.16% 19.40% 19.32% 19.28% 19.37% 19.82%
Net PP&E Ending 3362.00 3541.00 3660.00 3735.00 3885.00 3941.00 3954.00 3999.00 4097.00 4097.00 4359.77 4627.27 4891.86 5162.50 5428.83 5709.50 5997.13 6283.46 6549.58
Total Current Assets & Net PP&E $8,379.00 $8,353.00 $8,649.00 $8,856.00 $9,203.00 $9,525.00 $9,639.00 $9,801.00 $9,900.77 $9,900.77 $10,130.28 $10,664.62 $11,197.90 $11,743.19 $12,254.35 $12,835.47 $13,386.69 $13,924.16 $14,443.45
% of Revenue 83.24% 79.54% 78.46% 78.33% 79.31% 324.31% 317.18% 298.90% 316.93% 79.98% 79.14% 80.02% 80.76% 81.48% 81.92% 82.84% 83.55% 84.19% 84.77%
Current Liabilities
Accounts Payable 364.00 488.00 502.00 526.00 480.00 1940.00 2013.00 2094.00 542.33 542.33 560.67 586.41 611.47 635.59 662.66 687.96 714.60 739.26 763.32
Days Payable Outstanding 29.41 39.97 44.44 39.78 40.68 148.61 150.72 148.29 36.16 39.06 36.05 36.55 36.71 36.81 37.04 37.34 37.47 37.60 37.73
% of Revenue 3.62% 4.65% 4.55% 4.65% 4.14% 66.05% 66.24% 63.86% 17.36% 4.38% 4.38% 4.40% 4.41% 4.41% 4.43% 4.44% 4.46% 4.47% 4.48%
Accrued Charges 1081.00 1165.00 1149.00 1185.00 1459.00 468.00 418.00 535.00 1364.56 1364.56 1353.02 1411.38 1472.52 1534.92 1599.05 1661.02 1720.81 1782.83 1845.25
Days Charges Outstanding 144.21 152.90 145.07 146.72 156.54 54.64 47.68 58.94 151.99 154.25 146.97 147.26 147.11 147.36 147.69 148.34 148.10 148.54 149.11
% of Revenue 10.74% 11.09% 10.42% 10.48% 12.57% 15.93% 13.75% 16.32% 43.68% 11.02% 10.57% 10.59% 10.62% 10.65% 10.69% 10.72% 10.74% 10.78% 10.83%
Income Taxes Payable 102.00 111.00 78.00 66.00 70.00 0.00 0.00 0.00 93.72 93.72 99.84 107.95 116.47 122.51 130.14 137.90 145.80 153.81 161.86
Days Taxes Outstanding 80.24 70.22 52.43 49.40 65.51 0.00 0.00 0.00 87.98 76.19 84.35 87.28 90.02 91.65 94.70 97.06 99.37 102.41 106.36
% of Revenue 1.01% 1.06% .71% .58% .60% 0.00% 0.00% 0.00% 3.00% .76% .78% .81% .84% .85% .87% .89% .91% .93% .95%
Salaries, Wages and Related Items 406.00 454.00 477.00 478.00 504.00 0.00 0.00 0.00 532.30 532.30 538.90 563.75 589.28 616.85 644.71 670.92 700.18 729.34 754.80
% Revenue 4.03% 4.32% 4.33% 4.23% 4.34% 0.00% 0.00% 0.00% 17.04% 4.30% 4.21% 4.23% 4.25% 4.28% 4.31% 4.33% 4.37% 4.41% 4.43%
Current Portion of Long TermDebt 533.00 207.00 236.00 656.00 209.00 661.00 659.00 659.00 718.52 718.52 584.99 615.73 646.13 675.94 707.53 739.09 770.68 803.76 836.58
% of Revenue 5.30% 1.97% 2.14% 5.80% 1.80% 22.51% 21.68% 20.10% 23.00% 5.80% 4.57% 4.62% 4.66% 4.69% 4.73% 4.77% 4.81% 4.86% 4.91%
Total Current Liabilities $2,486.00 $2,425.00 $2,442.00 $2,911.00 $2,722.00 $3,069.00 $3,090.00 $3,288.00 $2,719.13 $2,719.13 $2,598.52 $2,721.47 $2,846.59 $2,968.95 $3,099.38 $3,225.98 $3,351.90 $3,479.66 $3,607.02
% of Revenue 24.70% 23.09% 22.15% 25.75% 23.46% 104.49% 101.68% 100.27% 87.04% 21.97% 20.30% 20.42% 20.53% 20.60% 20.72% 20.82% 20.92% 21.04% 21.17%
UOIG 23
December 5, 2014University of Oregon Investment Group
Appendix 5 – Discounted Cash Flows Valuation Assumptions
DiscountedFree Cash FlowAssumptions Considerations
TaxRate 21.63% Terminal Growth Rate 3.00%
Risk Free Rate 2.18% Terminal Value 59,277 Avg. Industry Debt / Equity 70.55%
Beta 0.94 PVof Terminal Value 33,768 Avg. Industry TaxRate 24.66%
Market Risk Premium 5.75% Sumof PVFree Cash Flows 11,665 Current Reinvestment Rate 3.85%
% Equity 64.58% FirmValue 45,433 Reinvestment Rate in Year 2019E 9.01%
% Debt 35.42% Total Debt 15,064 Implied Return on Capital in Perpetuity 33.31%
Cost of Debt 3.80% Cash & Cash Equivalents 4,380 Terminal Value as a % of Total 74.3%
CAPM 7.57% Market Capitalization 30,369 Implied 2014E EBITDA Multiple 13.8x
WACC 5.94% Fully Diluted Shares 192 Implied Multiple in Year 2023E 8.3x
Terminal Risk Free Rate 2.97% Implied Price $158.17 Free Cash Flow Growth Rate in Year 2023E 3%
Terminal CAPM 8.36% Current Price $141.06
Terminal WACC 6.45% Undervalued 12.13%
1564.12
Method: Price Objective Weighting
DCF Analysis $158.17 60%
Comparable Analysis $177.68 40%
Price Target $165.97
Current Price $141.06
Undervalued 17.66%
Final Price Target
UOIG 24
December 5, 2014University of Oregon Investment Group
Appendix 6 –Sensitivity Analysis
ImpliedPrice Undervalued/(Overvalued)
Terminal Growth Rate Terminal Growth Rate
158 2.0% 2.5% 3.0% 3.5% 4.0% 0 2.00% 2.50% 3.00% 3.50% 4.00%
0.74 156.30 183.96 221.79 276.65 363.39 0.74 10.80% 30.41% 57.23% 96.12% 157.61%
0.84 134.77 156.70 185.72 225.93 285.37 0.84 (4.46%) 11.09% 31.66% 60.17% 102.30%
0.94 116.83 134.54 157.38 187.92 230.85 0.94 (17.18%) (4.62%) 11.57% 33.22% 63.65%
1.04 101.64 116.18 134.52 158.36 190.60 1.04 (27.95%) (17.64%) (4.64%) 12.26% 35.12%
1.14 88.62 100.72 115.70 134.72 159.67 1.14 (37.18%) (28.60%) (17.98%) (4.50%) 13.19%
ImpliedPrice Undervalued/(Overvalued)
Terminal Growth Rate Terminal Growth Rate
158 1.50% 2.25% 3.00% 3.75% 4.50% 0 1.50% 2.25% 3.00% 3.75% 4.50%
0.04 109.1 131.7 164.1 214.6 303.8 0.04 (22.69%) (6.66%) 16.34% 52.11% 115.37%
0.05 106.0 128.6 161.0 211.5 300.7 0.05 (24.88%) (8.84%) 14.16% 49.92% 113.18%
0.06 103.1 125.7 158.1 208.6 297.8 0.06 (26.92%) (10.89%) 12.11% 47.88% 111.14%
0.07 100.4 123.0 155.5 205.9 295.1 0.07 (28.83%) (12.79%) 10.21% 45.97% 109.23%
0.08 97.9 120.5 152.9 203.4 292.6 0.08 (30.61%) (14.58%) 8.42% 44.19% 107.45%
ImpliedPrice Undervalued/(Overvalued)
Terminal Growth Rate Terminal Growth Rate
158 2.0% 2.5% 3.0% 3.5% 4.0% 12.13% 2.00% 2.50% 3.00% 3.50% 4.00%
1524.12 117.34 135.17 158.17 188.96 232.30 1524.12 (16.82%) (4.17%) 12.13% 33.96% 64.68%
1544.12 117.34 135.17 158.17 188.96 232.30 1544.12 (16.82%) (4.17%) 12.13% 33.96% 64.68%
1564.12 117.34 135.17 158.17 188.96 232.30 1564.12 (16.82%) (4.17%) 12.13% 33.96% 64.68%
1584.12 117.34 135.17 158.17 188.96 232.30 1584.12 (16.82%) (4.17%) 12.13% 33.96% 64.68%
1604.12 117.34 135.17 158.17 188.96 232.30 1604.12 (16.82%) (4.17%) 12.13% 33.96% 64.68%
ImpliedPrice Undervalued/(Overvalued)
Terminal Growth Rate Terminal Growth Rate
158 2.0% 2.5% 3.0% 3.5% 4.0% 0 2.0% 2.5% 3.0% 3.5% 4.0%
11.63% 111.52 128.09 149.28 177.34 216.24 11.63% (20.94%) (9.19%) 5.83% 25.72% 53.29%
16.63% 114.39 131.57 153.64 183.02 224.06 16.63% (18.91%) (6.73%) 8.92% 29.74% 58.84%
21.63% 117.34 135.17 158.17 188.96 232.30 21.63% (16.82%) (4.17%) 12.13% 33.96% 64.68%
26.63% 120.38 138.90 162.88 195.18 241.02 26.63% (14.66%) (1.53%) 15.47% 38.36% 70.86%
31.63% 123.52 142.75 167.78 201.69 250.24 31.63% (12.43%) 1.20% 18.94% 42.98% 77.40%
ImpliedPrice Undervalued/(Overvalued)
Terminal Growth Rate Terminal Growth Rate
158 2.0% 2.5% 3.0% 3.5% 4.0% 0 2.0% 2.5% 3.0% 3.5% 4.0%
1.80% 145.61 170.32 203.58 250.71 322.69 1.80% 3.22% 20.75% 44.32% 77.73% 128.76%
2.80% 130.54 151.43 178.90 216.64 271.74 2.80% (7.46%) 7.35% 26.82% 53.58% 92.64%
3.80% 117.35 135.18 158.19 188.98 232.33 3.80% (16.81%) (4.17%) 12.14% 33.97% 64.70%
4.80% 105.71 121.07 140.55 166.07 200.93 4.80% (25.06%) (14.17%) (.36%) 17.73% 42.44%
5.80% 95.36 108.70 125.37 146.78 175.32 5.80% (32.39%) (22.94%) (11.13%) 4.06% 24.29%
TerminalYear
Capexand
Acquisitions
TerminalYear
Capexand
Acquisitions
CostofDebt
CostofDebt
TaxRate
TaxRate
AdjustedBeta
AdjustedBeta
WACC
WACC
UOIG 25
December 5, 2014University of Oregon Investment Group
Appendix 8 – Sources
Becton Dickinson 10-K
Becton Dickinson Website
BD Third Quarter Earnings Conference Call
CareFusion First Quarter Earnings Conference Call
CareFusion 10-K
CareFusion Quarterly Reports
CareFusion Website
EPA Website
FactSet
Financial Visualizations Website
Google Images
IBIS World
Wall Street Journal
Yahoo Finance

More Related Content

What's hot

Pharma Uptoday Monthly Magazine Volume 13, Issue Apr - 2015
Pharma Uptoday Monthly Magazine Volume 13, Issue Apr - 2015Pharma Uptoday Monthly Magazine Volume 13, Issue Apr - 2015
Pharma Uptoday Monthly Magazine Volume 13, Issue Apr - 2015Sathish Vemula
 
Gui final referencing_approved _oct 2020
Gui final referencing_approved _oct 2020Gui final referencing_approved _oct 2020
Gui final referencing_approved _oct 2020Ajay B. Kumar
 
Data requirements for vet products
Data requirements for vet productsData requirements for vet products
Data requirements for vet productsMina Adly
 
Pharma Uptoday Monthly Magazine - Volume 11, Issue Feb 2015
Pharma Uptoday Monthly Magazine - Volume 11, Issue Feb 2015Pharma Uptoday Monthly Magazine - Volume 11, Issue Feb 2015
Pharma Uptoday Monthly Magazine - Volume 11, Issue Feb 2015Sathish Vemula
 
Pharma Uptoday Monthly Magazine Volume 5, Issue Aug 2014
Pharma Uptoday Monthly Magazine Volume 5, Issue Aug 2014Pharma Uptoday Monthly Magazine Volume 5, Issue Aug 2014
Pharma Uptoday Monthly Magazine Volume 5, Issue Aug 2014Sathish Vemula
 
Pharma Uptoday Monthly Magazine volume 4 issue jul 2014
Pharma Uptoday Monthly Magazine volume 4 issue jul 2014Pharma Uptoday Monthly Magazine volume 4 issue jul 2014
Pharma Uptoday Monthly Magazine volume 4 issue jul 2014Sathish Vemula
 
EU Market Overview Parson Q1 Dec 2010
EU Market Overview Parson Q1 Dec 2010EU Market Overview Parson Q1 Dec 2010
EU Market Overview Parson Q1 Dec 2010bpstat
 
Mercer Capital's Value Focus: Medical Device Industry | Q3 2016
Mercer Capital's Value Focus: Medical Device Industry | Q3 2016 Mercer Capital's Value Focus: Medical Device Industry | Q3 2016
Mercer Capital's Value Focus: Medical Device Industry | Q3 2016 Mercer Capital
 
Pharma Uptoday Monthly Magazine Volume 22; Issue Jan 2016
Pharma Uptoday Monthly Magazine Volume 22; Issue Jan 2016Pharma Uptoday Monthly Magazine Volume 22; Issue Jan 2016
Pharma Uptoday Monthly Magazine Volume 22; Issue Jan 2016Sathish Vemula
 
Pharma Uptoday Monthly Magazine Volume 7 issue Oct 2014
Pharma Uptoday Monthly Magazine Volume 7 issue Oct 2014Pharma Uptoday Monthly Magazine Volume 7 issue Oct 2014
Pharma Uptoday Monthly Magazine Volume 7 issue Oct 2014Sathish Vemula
 
Pharma Uptoday Monthly Magazine - Volume 10 issue Jan 2015
Pharma Uptoday Monthly Magazine  - Volume 10 issue Jan 2015Pharma Uptoday Monthly Magazine  - Volume 10 issue Jan 2015
Pharma Uptoday Monthly Magazine - Volume 10 issue Jan 2015Sathish Vemula
 
Guidance for Industry Patient-Reported Outcome Measures: Use in Medical Produ...
Guidance for Industry Patient-Reported Outcome Measures: Use in Medical Produ...Guidance for Industry Patient-Reported Outcome Measures: Use in Medical Produ...
Guidance for Industry Patient-Reported Outcome Measures: Use in Medical Produ...CRF Health
 
Pharma Uptoday Monthly Magazine - Volume 6 Issue Sep 2014
Pharma Uptoday Monthly Magazine - Volume 6 Issue Sep 2014Pharma Uptoday Monthly Magazine - Volume 6 Issue Sep 2014
Pharma Uptoday Monthly Magazine - Volume 6 Issue Sep 2014Sathish Vemula
 
Guidance for Industry and Food and Drug Administration Staff: Mobile Medical ...
Guidance for Industry and Food and Drug Administration Staff: Mobile Medical ...Guidance for Industry and Food and Drug Administration Staff: Mobile Medical ...
Guidance for Industry and Food and Drug Administration Staff: Mobile Medical ...CRF Health
 
Pharma Uptoday Monthly Magazine Volume 12; Issue Mar 2015
Pharma Uptoday Monthly Magazine Volume 12; Issue Mar 2015Pharma Uptoday Monthly Magazine Volume 12; Issue Mar 2015
Pharma Uptoday Monthly Magazine Volume 12; Issue Mar 2015Sathish Vemula
 
Industry News FDAs Science Based Approach To Nutrition Mar 2010
Industry News FDAs Science Based Approach To Nutrition Mar 2010Industry News FDAs Science Based Approach To Nutrition Mar 2010
Industry News FDAs Science Based Approach To Nutrition Mar 2010NutraceuticalMedicalResearch
 
Health Policy Supporting Innovation in Korean Medical Device Sector (July 11,...
Health Policy Supporting Innovation in Korean Medical Device Sector (July 11,...Health Policy Supporting Innovation in Korean Medical Device Sector (July 11,...
Health Policy Supporting Innovation in Korean Medical Device Sector (July 11,...Sung Yoon Bae
 
Hans van Bruggen | Semantic interoperability to manage medicinal data and exc...
Hans van Bruggen | Semantic interoperability to manage medicinal data and exc...Hans van Bruggen | Semantic interoperability to manage medicinal data and exc...
Hans van Bruggen | Semantic interoperability to manage medicinal data and exc...semanticsconference
 

What's hot (20)

Pharma Uptoday Monthly Magazine Volume 13, Issue Apr - 2015
Pharma Uptoday Monthly Magazine Volume 13, Issue Apr - 2015Pharma Uptoday Monthly Magazine Volume 13, Issue Apr - 2015
Pharma Uptoday Monthly Magazine Volume 13, Issue Apr - 2015
 
Gui final referencing_approved _oct 2020
Gui final referencing_approved _oct 2020Gui final referencing_approved _oct 2020
Gui final referencing_approved _oct 2020
 
Data requirements for vet products
Data requirements for vet productsData requirements for vet products
Data requirements for vet products
 
Pharma Uptoday Monthly Magazine - Volume 11, Issue Feb 2015
Pharma Uptoday Monthly Magazine - Volume 11, Issue Feb 2015Pharma Uptoday Monthly Magazine - Volume 11, Issue Feb 2015
Pharma Uptoday Monthly Magazine - Volume 11, Issue Feb 2015
 
Pharma Uptoday Monthly Magazine Volume 5, Issue Aug 2014
Pharma Uptoday Monthly Magazine Volume 5, Issue Aug 2014Pharma Uptoday Monthly Magazine Volume 5, Issue Aug 2014
Pharma Uptoday Monthly Magazine Volume 5, Issue Aug 2014
 
Pharma Uptoday Monthly Magazine volume 4 issue jul 2014
Pharma Uptoday Monthly Magazine volume 4 issue jul 2014Pharma Uptoday Monthly Magazine volume 4 issue jul 2014
Pharma Uptoday Monthly Magazine volume 4 issue jul 2014
 
EU Market Overview Parson Q1 Dec 2010
EU Market Overview Parson Q1 Dec 2010EU Market Overview Parson Q1 Dec 2010
EU Market Overview Parson Q1 Dec 2010
 
Mercer Capital's Value Focus: Medical Device Industry | Q3 2016
Mercer Capital's Value Focus: Medical Device Industry | Q3 2016 Mercer Capital's Value Focus: Medical Device Industry | Q3 2016
Mercer Capital's Value Focus: Medical Device Industry | Q3 2016
 
Pharma Uptoday Monthly Magazine Volume 22; Issue Jan 2016
Pharma Uptoday Monthly Magazine Volume 22; Issue Jan 2016Pharma Uptoday Monthly Magazine Volume 22; Issue Jan 2016
Pharma Uptoday Monthly Magazine Volume 22; Issue Jan 2016
 
Pharma Uptoday Monthly Magazine Volume 7 issue Oct 2014
Pharma Uptoday Monthly Magazine Volume 7 issue Oct 2014Pharma Uptoday Monthly Magazine Volume 7 issue Oct 2014
Pharma Uptoday Monthly Magazine Volume 7 issue Oct 2014
 
Pharma Uptoday Monthly Magazine - Volume 10 issue Jan 2015
Pharma Uptoday Monthly Magazine  - Volume 10 issue Jan 2015Pharma Uptoday Monthly Magazine  - Volume 10 issue Jan 2015
Pharma Uptoday Monthly Magazine - Volume 10 issue Jan 2015
 
Guidance for Industry Patient-Reported Outcome Measures: Use in Medical Produ...
Guidance for Industry Patient-Reported Outcome Measures: Use in Medical Produ...Guidance for Industry Patient-Reported Outcome Measures: Use in Medical Produ...
Guidance for Industry Patient-Reported Outcome Measures: Use in Medical Produ...
 
Medtronic valuation
Medtronic valuationMedtronic valuation
Medtronic valuation
 
Pharma Uptoday Monthly Magazine - Volume 6 Issue Sep 2014
Pharma Uptoday Monthly Magazine - Volume 6 Issue Sep 2014Pharma Uptoday Monthly Magazine - Volume 6 Issue Sep 2014
Pharma Uptoday Monthly Magazine - Volume 6 Issue Sep 2014
 
Guidance for Industry and Food and Drug Administration Staff: Mobile Medical ...
Guidance for Industry and Food and Drug Administration Staff: Mobile Medical ...Guidance for Industry and Food and Drug Administration Staff: Mobile Medical ...
Guidance for Industry and Food and Drug Administration Staff: Mobile Medical ...
 
Pharma Uptoday Monthly Magazine Volume 12; Issue Mar 2015
Pharma Uptoday Monthly Magazine Volume 12; Issue Mar 2015Pharma Uptoday Monthly Magazine Volume 12; Issue Mar 2015
Pharma Uptoday Monthly Magazine Volume 12; Issue Mar 2015
 
Ucm072331
Ucm072331Ucm072331
Ucm072331
 
Industry News FDAs Science Based Approach To Nutrition Mar 2010
Industry News FDAs Science Based Approach To Nutrition Mar 2010Industry News FDAs Science Based Approach To Nutrition Mar 2010
Industry News FDAs Science Based Approach To Nutrition Mar 2010
 
Health Policy Supporting Innovation in Korean Medical Device Sector (July 11,...
Health Policy Supporting Innovation in Korean Medical Device Sector (July 11,...Health Policy Supporting Innovation in Korean Medical Device Sector (July 11,...
Health Policy Supporting Innovation in Korean Medical Device Sector (July 11,...
 
Hans van Bruggen | Semantic interoperability to manage medicinal data and exc...
Hans van Bruggen | Semantic interoperability to manage medicinal data and exc...Hans van Bruggen | Semantic interoperability to manage medicinal data and exc...
Hans van Bruggen | Semantic interoperability to manage medicinal data and exc...
 

Similar to Becton dickinson company

Health 2.0 Quarterly Report (Q2 2016)
Health 2.0 Quarterly Report (Q2 2016) Health 2.0 Quarterly Report (Q2 2016)
Health 2.0 Quarterly Report (Q2 2016) health2dev
 
Health 2.0 Quarterly Report (Q3 2016)
Health 2.0 Quarterly Report (Q3 2016) Health 2.0 Quarterly Report (Q3 2016)
Health 2.0 Quarterly Report (Q3 2016) health2dev
 
Catalent (CTLT) Equity Report
Catalent (CTLT) Equity ReportCatalent (CTLT) Equity Report
Catalent (CTLT) Equity ReportLeon Stempert
 
Cook medical incorporated product pipeline analysis
Cook medical incorporated   product pipeline analysisCook medical incorporated   product pipeline analysis
Cook medical incorporated product pipeline analysisraja1233
 
The 10 companies booming in healthcare sector small
The 10 companies booming in healthcare sector  smallThe 10 companies booming in healthcare sector  small
The 10 companies booming in healthcare sector smallinsightscare
 
Accenture Transformative Power of Healthcare Technology M&A in Life Science 2015
Accenture Transformative Power of Healthcare Technology M&A in Life Science 2015Accenture Transformative Power of Healthcare Technology M&A in Life Science 2015
Accenture Transformative Power of Healthcare Technology M&A in Life Science 2015Arda Ural, MSc, MBA, PhD
 
World Top-10 CROs and Why?
World Top-10 CROs and Why?World Top-10 CROs and Why?
World Top-10 CROs and Why?ClinosolIndia
 
Taking The Pulse of Medtech innovation_Pitchbook, Dec, 2021
Taking The Pulse of Medtech innovation_Pitchbook, Dec, 2021Taking The Pulse of Medtech innovation_Pitchbook, Dec, 2021
Taking The Pulse of Medtech innovation_Pitchbook, Dec, 2021Levi Shapiro
 
In-Depth Healthcare Analysis of mHealth Trends & Metrics Q2, 2014
In-Depth Healthcare Analysis of mHealth Trends & Metrics Q2, 2014In-Depth Healthcare Analysis of mHealth Trends & Metrics Q2, 2014
In-Depth Healthcare Analysis of mHealth Trends & Metrics Q2, 2014Wearables Group
 
Prescription Medicines Costs in Context March 2022
Prescription Medicines Costs in Context March 2022Prescription Medicines Costs in Context March 2022
Prescription Medicines Costs in Context March 2022PhRMA
 
PatientKey Investor Update
PatientKey Investor UpdatePatientKey Investor Update
PatientKey Investor UpdateKurt Ludwig
 
OSU SIM Equity Research Report (McKesson)
OSU SIM Equity Research Report (McKesson)OSU SIM Equity Research Report (McKesson)
OSU SIM Equity Research Report (McKesson)Simon Wu
 
The 10 Companies Booming in Healthcare Sector
The 10 Companies Booming in Healthcare SectorThe 10 Companies Booming in Healthcare Sector
The 10 Companies Booming in Healthcare Sectorinsightscare
 
Medical Devices: Acquisitions Driving Growth
Medical Devices: Acquisitions Driving GrowthMedical Devices: Acquisitions Driving Growth
Medical Devices: Acquisitions Driving GrowthBruce Carlson
 

Similar to Becton dickinson company (20)

Health 2.0 Quarterly Report (Q2 2016)
Health 2.0 Quarterly Report (Q2 2016) Health 2.0 Quarterly Report (Q2 2016)
Health 2.0 Quarterly Report (Q2 2016)
 
Covid 19 - Year One
Covid 19 - Year OneCovid 19 - Year One
Covid 19 - Year One
 
Health 2.0 Quarterly Report (Q3 2016)
Health 2.0 Quarterly Report (Q3 2016) Health 2.0 Quarterly Report (Q3 2016)
Health 2.0 Quarterly Report (Q3 2016)
 
Catalent (CTLT) Equity Report
Catalent (CTLT) Equity ReportCatalent (CTLT) Equity Report
Catalent (CTLT) Equity Report
 
Cook medical incorporated product pipeline analysis
Cook medical incorporated   product pipeline analysisCook medical incorporated   product pipeline analysis
Cook medical incorporated product pipeline analysis
 
2008AR
2008AR2008AR
2008AR
 
2008AR
2008AR2008AR
2008AR
 
2008AR
2008AR2008AR
2008AR
 
The 10 companies booming in healthcare sector small
The 10 companies booming in healthcare sector  smallThe 10 companies booming in healthcare sector  small
The 10 companies booming in healthcare sector small
 
Accenture Transformative Power of Healthcare Technology M&A in Life Science 2015
Accenture Transformative Power of Healthcare Technology M&A in Life Science 2015Accenture Transformative Power of Healthcare Technology M&A in Life Science 2015
Accenture Transformative Power of Healthcare Technology M&A in Life Science 2015
 
World Top-10 CROs and Why?
World Top-10 CROs and Why?World Top-10 CROs and Why?
World Top-10 CROs and Why?
 
Taking The Pulse of Medtech innovation_Pitchbook, Dec, 2021
Taking The Pulse of Medtech innovation_Pitchbook, Dec, 2021Taking The Pulse of Medtech innovation_Pitchbook, Dec, 2021
Taking The Pulse of Medtech innovation_Pitchbook, Dec, 2021
 
In-Depth Healthcare Analysis of mHealth Trends & Metrics Q2, 2014
In-Depth Healthcare Analysis of mHealth Trends & Metrics Q2, 2014In-Depth Healthcare Analysis of mHealth Trends & Metrics Q2, 2014
In-Depth Healthcare Analysis of mHealth Trends & Metrics Q2, 2014
 
Prescription Medicines Costs in Context March 2022
Prescription Medicines Costs in Context March 2022Prescription Medicines Costs in Context March 2022
Prescription Medicines Costs in Context March 2022
 
Life Sciences Trends 2014
Life Sciences Trends 2014Life Sciences Trends 2014
Life Sciences Trends 2014
 
Mera medicare
Mera medicareMera medicare
Mera medicare
 
PatientKey Investor Update
PatientKey Investor UpdatePatientKey Investor Update
PatientKey Investor Update
 
OSU SIM Equity Research Report (McKesson)
OSU SIM Equity Research Report (McKesson)OSU SIM Equity Research Report (McKesson)
OSU SIM Equity Research Report (McKesson)
 
The 10 Companies Booming in Healthcare Sector
The 10 Companies Booming in Healthcare SectorThe 10 Companies Booming in Healthcare Sector
The 10 Companies Booming in Healthcare Sector
 
Medical Devices: Acquisitions Driving Growth
Medical Devices: Acquisitions Driving GrowthMedical Devices: Acquisitions Driving Growth
Medical Devices: Acquisitions Driving Growth
 

Recently uploaded

Call Girls Coimbatore Just Call 8250077686 Top Class Call Girl Service Available
Call Girls Coimbatore Just Call 8250077686 Top Class Call Girl Service AvailableCall Girls Coimbatore Just Call 8250077686 Top Class Call Girl Service Available
Call Girls Coimbatore Just Call 8250077686 Top Class Call Girl Service AvailableDipal Arora
 
Saket * Call Girls in Delhi - Phone 9711199012 Escorts Service at 6k to 50k a...
Saket * Call Girls in Delhi - Phone 9711199012 Escorts Service at 6k to 50k a...Saket * Call Girls in Delhi - Phone 9711199012 Escorts Service at 6k to 50k a...
Saket * Call Girls in Delhi - Phone 9711199012 Escorts Service at 6k to 50k a...BhumiSaxena1
 
Call Girls Mumbai Just Call 8250077686 Top Class Call Girl Service Available
Call Girls Mumbai Just Call 8250077686 Top Class Call Girl Service AvailableCall Girls Mumbai Just Call 8250077686 Top Class Call Girl Service Available
Call Girls Mumbai Just Call 8250077686 Top Class Call Girl Service AvailableDipal Arora
 
Call Girls Service Jaipur {8445551418} ❤️VVIP BHAWNA Call Girl in Jaipur Raja...
Call Girls Service Jaipur {8445551418} ❤️VVIP BHAWNA Call Girl in Jaipur Raja...Call Girls Service Jaipur {8445551418} ❤️VVIP BHAWNA Call Girl in Jaipur Raja...
Call Girls Service Jaipur {8445551418} ❤️VVIP BHAWNA Call Girl in Jaipur Raja...parulsinha
 
Dehradun Call Girls Service {8854095900} ❤️VVIP ROCKY Call Girl in Dehradun U...
Dehradun Call Girls Service {8854095900} ❤️VVIP ROCKY Call Girl in Dehradun U...Dehradun Call Girls Service {8854095900} ❤️VVIP ROCKY Call Girl in Dehradun U...
Dehradun Call Girls Service {8854095900} ❤️VVIP ROCKY Call Girl in Dehradun U...Sheetaleventcompany
 
Call Girls Rishikesh Just Call 8250077686 Top Class Call Girl Service Available
Call Girls Rishikesh Just Call 8250077686 Top Class Call Girl Service AvailableCall Girls Rishikesh Just Call 8250077686 Top Class Call Girl Service Available
Call Girls Rishikesh Just Call 8250077686 Top Class Call Girl Service AvailableDipal Arora
 
Low Rate Call Girls Bangalore {7304373326} ❤️VVIP NISHA Call Girls in Bangalo...
Low Rate Call Girls Bangalore {7304373326} ❤️VVIP NISHA Call Girls in Bangalo...Low Rate Call Girls Bangalore {7304373326} ❤️VVIP NISHA Call Girls in Bangalo...
Low Rate Call Girls Bangalore {7304373326} ❤️VVIP NISHA Call Girls in Bangalo...Sheetaleventcompany
 
Top Rated Hyderabad Call Girls Chintal ⟟ 9332606886 ⟟ Call Me For Genuine Se...
Top Rated  Hyderabad Call Girls Chintal ⟟ 9332606886 ⟟ Call Me For Genuine Se...Top Rated  Hyderabad Call Girls Chintal ⟟ 9332606886 ⟟ Call Me For Genuine Se...
Top Rated Hyderabad Call Girls Chintal ⟟ 9332606886 ⟟ Call Me For Genuine Se...chandars293
 
Premium Call Girls In Jaipur {8445551418} ❤️VVIP SEEMA Call Girl in Jaipur Ra...
Premium Call Girls In Jaipur {8445551418} ❤️VVIP SEEMA Call Girl in Jaipur Ra...Premium Call Girls In Jaipur {8445551418} ❤️VVIP SEEMA Call Girl in Jaipur Ra...
Premium Call Girls In Jaipur {8445551418} ❤️VVIP SEEMA Call Girl in Jaipur Ra...parulsinha
 
Call Girls Varanasi Just Call 8250077686 Top Class Call Girl Service Available
Call Girls Varanasi Just Call 8250077686 Top Class Call Girl Service AvailableCall Girls Varanasi Just Call 8250077686 Top Class Call Girl Service Available
Call Girls Varanasi Just Call 8250077686 Top Class Call Girl Service AvailableDipal Arora
 
Independent Call Girls Service Mohali Sector 116 | 6367187148 | Call Girl Ser...
Independent Call Girls Service Mohali Sector 116 | 6367187148 | Call Girl Ser...Independent Call Girls Service Mohali Sector 116 | 6367187148 | Call Girl Ser...
Independent Call Girls Service Mohali Sector 116 | 6367187148 | Call Girl Ser...karishmasinghjnh
 
Call Girls Ahmedabad Just Call 9630942363 Top Class Call Girl Service Available
Call Girls Ahmedabad Just Call 9630942363 Top Class Call Girl Service AvailableCall Girls Ahmedabad Just Call 9630942363 Top Class Call Girl Service Available
Call Girls Ahmedabad Just Call 9630942363 Top Class Call Girl Service AvailableGENUINE ESCORT AGENCY
 
Call Girls Rishikesh Just Call 9667172968 Top Class Call Girl Service Available
Call Girls Rishikesh Just Call 9667172968 Top Class Call Girl Service AvailableCall Girls Rishikesh Just Call 9667172968 Top Class Call Girl Service Available
Call Girls Rishikesh Just Call 9667172968 Top Class Call Girl Service Availableperfect solution
 
Russian Call Girls Service Jaipur {8445551418} ❤️PALLAVI VIP Jaipur Call Gir...
Russian Call Girls Service  Jaipur {8445551418} ❤️PALLAVI VIP Jaipur Call Gir...Russian Call Girls Service  Jaipur {8445551418} ❤️PALLAVI VIP Jaipur Call Gir...
Russian Call Girls Service Jaipur {8445551418} ❤️PALLAVI VIP Jaipur Call Gir...parulsinha
 
Call Girls Jaipur Just Call 9521753030 Top Class Call Girl Service Available
Call Girls Jaipur Just Call 9521753030 Top Class Call Girl Service AvailableCall Girls Jaipur Just Call 9521753030 Top Class Call Girl Service Available
Call Girls Jaipur Just Call 9521753030 Top Class Call Girl Service AvailableJanvi Singh
 
Top Rated Pune Call Girls (DIPAL) ⟟ 8250077686 ⟟ Call Me For Genuine Sex Serv...
Top Rated Pune Call Girls (DIPAL) ⟟ 8250077686 ⟟ Call Me For Genuine Sex Serv...Top Rated Pune Call Girls (DIPAL) ⟟ 8250077686 ⟟ Call Me For Genuine Sex Serv...
Top Rated Pune Call Girls (DIPAL) ⟟ 8250077686 ⟟ Call Me For Genuine Sex Serv...Dipal Arora
 
Independent Call Girls In Jaipur { 8445551418 } ✔ ANIKA MEHTA ✔ Get High Prof...
Independent Call Girls In Jaipur { 8445551418 } ✔ ANIKA MEHTA ✔ Get High Prof...Independent Call Girls In Jaipur { 8445551418 } ✔ ANIKA MEHTA ✔ Get High Prof...
Independent Call Girls In Jaipur { 8445551418 } ✔ ANIKA MEHTA ✔ Get High Prof...parulsinha
 
Andheri East ^ (Genuine) Escort Service Mumbai ₹7.5k Pick Up & Drop With Cash...
Andheri East ^ (Genuine) Escort Service Mumbai ₹7.5k Pick Up & Drop With Cash...Andheri East ^ (Genuine) Escort Service Mumbai ₹7.5k Pick Up & Drop With Cash...
Andheri East ^ (Genuine) Escort Service Mumbai ₹7.5k Pick Up & Drop With Cash...Anamika Rawat
 
Call Girls in Lucknow Just Call 👉👉7877925207 Top Class Call Girl Service Avai...
Call Girls in Lucknow Just Call 👉👉7877925207 Top Class Call Girl Service Avai...Call Girls in Lucknow Just Call 👉👉7877925207 Top Class Call Girl Service Avai...
Call Girls in Lucknow Just Call 👉👉7877925207 Top Class Call Girl Service Avai...adilkhan87451
 
Andheri East ) Call Girls in Mumbai Phone No 9004268417 Elite Escort Service ...
Andheri East ) Call Girls in Mumbai Phone No 9004268417 Elite Escort Service ...Andheri East ) Call Girls in Mumbai Phone No 9004268417 Elite Escort Service ...
Andheri East ) Call Girls in Mumbai Phone No 9004268417 Elite Escort Service ...Anamika Rawat
 

Recently uploaded (20)

Call Girls Coimbatore Just Call 8250077686 Top Class Call Girl Service Available
Call Girls Coimbatore Just Call 8250077686 Top Class Call Girl Service AvailableCall Girls Coimbatore Just Call 8250077686 Top Class Call Girl Service Available
Call Girls Coimbatore Just Call 8250077686 Top Class Call Girl Service Available
 
Saket * Call Girls in Delhi - Phone 9711199012 Escorts Service at 6k to 50k a...
Saket * Call Girls in Delhi - Phone 9711199012 Escorts Service at 6k to 50k a...Saket * Call Girls in Delhi - Phone 9711199012 Escorts Service at 6k to 50k a...
Saket * Call Girls in Delhi - Phone 9711199012 Escorts Service at 6k to 50k a...
 
Call Girls Mumbai Just Call 8250077686 Top Class Call Girl Service Available
Call Girls Mumbai Just Call 8250077686 Top Class Call Girl Service AvailableCall Girls Mumbai Just Call 8250077686 Top Class Call Girl Service Available
Call Girls Mumbai Just Call 8250077686 Top Class Call Girl Service Available
 
Call Girls Service Jaipur {8445551418} ❤️VVIP BHAWNA Call Girl in Jaipur Raja...
Call Girls Service Jaipur {8445551418} ❤️VVIP BHAWNA Call Girl in Jaipur Raja...Call Girls Service Jaipur {8445551418} ❤️VVIP BHAWNA Call Girl in Jaipur Raja...
Call Girls Service Jaipur {8445551418} ❤️VVIP BHAWNA Call Girl in Jaipur Raja...
 
Dehradun Call Girls Service {8854095900} ❤️VVIP ROCKY Call Girl in Dehradun U...
Dehradun Call Girls Service {8854095900} ❤️VVIP ROCKY Call Girl in Dehradun U...Dehradun Call Girls Service {8854095900} ❤️VVIP ROCKY Call Girl in Dehradun U...
Dehradun Call Girls Service {8854095900} ❤️VVIP ROCKY Call Girl in Dehradun U...
 
Call Girls Rishikesh Just Call 8250077686 Top Class Call Girl Service Available
Call Girls Rishikesh Just Call 8250077686 Top Class Call Girl Service AvailableCall Girls Rishikesh Just Call 8250077686 Top Class Call Girl Service Available
Call Girls Rishikesh Just Call 8250077686 Top Class Call Girl Service Available
 
Low Rate Call Girls Bangalore {7304373326} ❤️VVIP NISHA Call Girls in Bangalo...
Low Rate Call Girls Bangalore {7304373326} ❤️VVIP NISHA Call Girls in Bangalo...Low Rate Call Girls Bangalore {7304373326} ❤️VVIP NISHA Call Girls in Bangalo...
Low Rate Call Girls Bangalore {7304373326} ❤️VVIP NISHA Call Girls in Bangalo...
 
Top Rated Hyderabad Call Girls Chintal ⟟ 9332606886 ⟟ Call Me For Genuine Se...
Top Rated  Hyderabad Call Girls Chintal ⟟ 9332606886 ⟟ Call Me For Genuine Se...Top Rated  Hyderabad Call Girls Chintal ⟟ 9332606886 ⟟ Call Me For Genuine Se...
Top Rated Hyderabad Call Girls Chintal ⟟ 9332606886 ⟟ Call Me For Genuine Se...
 
Premium Call Girls In Jaipur {8445551418} ❤️VVIP SEEMA Call Girl in Jaipur Ra...
Premium Call Girls In Jaipur {8445551418} ❤️VVIP SEEMA Call Girl in Jaipur Ra...Premium Call Girls In Jaipur {8445551418} ❤️VVIP SEEMA Call Girl in Jaipur Ra...
Premium Call Girls In Jaipur {8445551418} ❤️VVIP SEEMA Call Girl in Jaipur Ra...
 
Call Girls Varanasi Just Call 8250077686 Top Class Call Girl Service Available
Call Girls Varanasi Just Call 8250077686 Top Class Call Girl Service AvailableCall Girls Varanasi Just Call 8250077686 Top Class Call Girl Service Available
Call Girls Varanasi Just Call 8250077686 Top Class Call Girl Service Available
 
Independent Call Girls Service Mohali Sector 116 | 6367187148 | Call Girl Ser...
Independent Call Girls Service Mohali Sector 116 | 6367187148 | Call Girl Ser...Independent Call Girls Service Mohali Sector 116 | 6367187148 | Call Girl Ser...
Independent Call Girls Service Mohali Sector 116 | 6367187148 | Call Girl Ser...
 
Call Girls Ahmedabad Just Call 9630942363 Top Class Call Girl Service Available
Call Girls Ahmedabad Just Call 9630942363 Top Class Call Girl Service AvailableCall Girls Ahmedabad Just Call 9630942363 Top Class Call Girl Service Available
Call Girls Ahmedabad Just Call 9630942363 Top Class Call Girl Service Available
 
Call Girls Rishikesh Just Call 9667172968 Top Class Call Girl Service Available
Call Girls Rishikesh Just Call 9667172968 Top Class Call Girl Service AvailableCall Girls Rishikesh Just Call 9667172968 Top Class Call Girl Service Available
Call Girls Rishikesh Just Call 9667172968 Top Class Call Girl Service Available
 
Russian Call Girls Service Jaipur {8445551418} ❤️PALLAVI VIP Jaipur Call Gir...
Russian Call Girls Service  Jaipur {8445551418} ❤️PALLAVI VIP Jaipur Call Gir...Russian Call Girls Service  Jaipur {8445551418} ❤️PALLAVI VIP Jaipur Call Gir...
Russian Call Girls Service Jaipur {8445551418} ❤️PALLAVI VIP Jaipur Call Gir...
 
Call Girls Jaipur Just Call 9521753030 Top Class Call Girl Service Available
Call Girls Jaipur Just Call 9521753030 Top Class Call Girl Service AvailableCall Girls Jaipur Just Call 9521753030 Top Class Call Girl Service Available
Call Girls Jaipur Just Call 9521753030 Top Class Call Girl Service Available
 
Top Rated Pune Call Girls (DIPAL) ⟟ 8250077686 ⟟ Call Me For Genuine Sex Serv...
Top Rated Pune Call Girls (DIPAL) ⟟ 8250077686 ⟟ Call Me For Genuine Sex Serv...Top Rated Pune Call Girls (DIPAL) ⟟ 8250077686 ⟟ Call Me For Genuine Sex Serv...
Top Rated Pune Call Girls (DIPAL) ⟟ 8250077686 ⟟ Call Me For Genuine Sex Serv...
 
Independent Call Girls In Jaipur { 8445551418 } ✔ ANIKA MEHTA ✔ Get High Prof...
Independent Call Girls In Jaipur { 8445551418 } ✔ ANIKA MEHTA ✔ Get High Prof...Independent Call Girls In Jaipur { 8445551418 } ✔ ANIKA MEHTA ✔ Get High Prof...
Independent Call Girls In Jaipur { 8445551418 } ✔ ANIKA MEHTA ✔ Get High Prof...
 
Andheri East ^ (Genuine) Escort Service Mumbai ₹7.5k Pick Up & Drop With Cash...
Andheri East ^ (Genuine) Escort Service Mumbai ₹7.5k Pick Up & Drop With Cash...Andheri East ^ (Genuine) Escort Service Mumbai ₹7.5k Pick Up & Drop With Cash...
Andheri East ^ (Genuine) Escort Service Mumbai ₹7.5k Pick Up & Drop With Cash...
 
Call Girls in Lucknow Just Call 👉👉7877925207 Top Class Call Girl Service Avai...
Call Girls in Lucknow Just Call 👉👉7877925207 Top Class Call Girl Service Avai...Call Girls in Lucknow Just Call 👉👉7877925207 Top Class Call Girl Service Avai...
Call Girls in Lucknow Just Call 👉👉7877925207 Top Class Call Girl Service Avai...
 
Andheri East ) Call Girls in Mumbai Phone No 9004268417 Elite Escort Service ...
Andheri East ) Call Girls in Mumbai Phone No 9004268417 Elite Escort Service ...Andheri East ) Call Girls in Mumbai Phone No 9004268417 Elite Escort Service ...
Andheri East ) Call Girls in Mumbai Phone No 9004268417 Elite Escort Service ...
 

Becton dickinson company

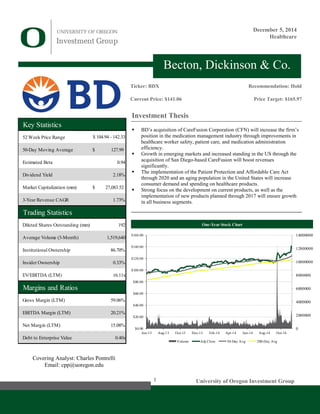
  • 1. 1 University of Oregon Investment Group December 5, 2014 Healthcare Covering Analyst: Charles Pontrelli Email: cpp@uoregon.edu Investment Thesis  BD’s acquisition of CareFusion Corporation (CFN) will increase the firm’s position in the medication management industry through improvements in healthcare worker safety, patient care, and medication administration efficiency.  Growth in emerging markets and increased standing in the US through the acquisition of San Diego-based CareFusion will boost revenues significantly.  The implementation of the Patient Protection and Affordable Care Act through 2020 and an aging population in the United States will increase consumer demand and spending on healthcare products.  Strong focus on the development on current products, as well as the implementation of new products planned through 2017 will ensure growth in all business segments. Becton, Dickinson & Co. Key Statistics 52 Week Price Range 50-Day Moving Average 127.99$ Estimated Beta 0.94 Dividend Yield 2.18% Market Capitalization (mm) 27,083.52$ 3-Year Revenue CAGR 1.73% Trading Statistics Diluted Shares Outstanding (mm) 192 Average Volume (3-Month) 1,519,640 Institutional Ownership 86.70% Insider Ownership 0.33% EV/EBITDA (LTM) 16.11x Margins and Ratios Gross Margin (LTM) 59.06% EBITDA Margin (LTM) 20.21% Net Margin (LTM) 15.08% Debt to Enterprise Value 0.40x $ 104.94 - 142.33 Ticker: BDX Current Price: $141.06 Recommendation: Hold Price Target: $165.97 One-Year Stock Chart 0 2000000 4000000 6000000 8000000 10000000 12000000 14000000 $0.00 $20.00 $40.00 $60.00 $80.00 $100.00 $120.00 $140.00 $160.00 Jun-13 Aug-13 Oct-13 Dec-13 Feb-14 Apr-14 Jun-14 Aug-14 Oct-14 Volume Adj Close 50-Day Avg 200-Day Avg
  • 2. December 5, 2014 UOIG 2 University of Oregon Investment Group 53% 33% 14% BD Medical BD Diagnostics BD Biosciences Becton, Dickinson & Co. Business Overview Maxwell W. Becton and Farleigh S. Dickinson founded Becton, Dickinson & Co. (BD) in 1897. In 1906, BD incorporated in New Jersey, where their headquarters are currently located in the city of Franklin Lakes. BD is a medical technology and supply company that manufactures medical devices, software, and instrument systems. The company went public in 1962, and 60% of their sales currently come from over-seas markets. BD markets their products through individual distribution channels and directly to customers by independent sales representatives, and orders are received and filled on a current basis. In October, 2014 BD announced its acquisition of CareFusion Corporation for $12.2 billion in stock and cash. Business overviews of both companies are given below in order to show how the acquisition will affect BD’s operations. Currently, BD’s operations are separated into three business segments: BD Medical, BD Diagnostics, and BD Biosciences, which are explained below. BD Medical The BD Medical segment manufactures a wide array of medical products. Some of the segment’s principal medical devices are prefilled IV flush syringes; needles, syringes and intravenous catheters for the delivery of medication; self- injection syringes and pen needles for the treatment of diabetes; regional anesthesia needles and trays; and generic prefilled injectables. Hospitals, clinics, pharmacies, public health agencies, and pharmaceutical companies are the primary customers served by BD Medical. Once the acquisition of CareFusion is closed, their operations will be consolidated into BD Medical, which will be a large driver of revenue. CareFusion’s Infusion Systems and Dispensing Technologies will complement BD’s product line in their Medical Surgical Systems. Additionally, disposables and reusable surgical products can be offered with the sale of BD’s disinfecting containers to establish long-term revenue streams. BD Medical includes three subunits: Medical Surgical Systems, Diabetes Care, and Pharmaceutical Systems. Medical Surgical Systems The Medical Surgical Systems unit is the largest driver of revenue for this segment. This unit’s core products are anesthesia, infusion therapy, injection, and sharps disposal products. Revenue growth in the past two years can be attributed to the sales of the BD PhaSeal™, which resulted from the Carmel Pharma, AB acquisition that occurred at the end of 2011. This business unit will benefit greatly from the addition of certain CareFusion products, such as CareFusion’s Alaris™ System, which can provide and manage multiple medications and fluids to a patient simultaneously. Diabetes Care The Diabetes Care unit produces self-injection syringes and pen needles for the treatment of diabetes, as well as pre-filled injectables. Revenue growth in this unit has recently benefitted from strong sales of BD Ultra-Fine™ and BD PentaPoint™ pen needles, which are self-injection systems to deliver insulin to diabetes patients. Pharmaceutical Systems Revenue growth for the Pharmaceutical Systems was supplemented by the acquisition of Safety Syringes in the first quarter of the fiscal year of 2013. This unit produces primarily glass and plastic prefilled syringes for biotech drugs and other pharmaceutical purposes. Figure 1: BD Revenue Breakdown for 2013 Source: BD 2013 10-K Figure 2: BD Medical Revenue Growth Source: UOIG Spreads Figure 3: BD Nano™ 4mm Pen Needle Source: bd.com 0 1000 2000 3000 4000 5000 6000 7000 8000 $Millions
  • 3. December 5, 2014 UOIG 3 University of Oregon Investment Group BD Diagnostics BD Diagnostics manufactures products that detect infectious diseases, healthcare-associated infections, and cancers, as well as products that allow for the safe transport and collection of specimens. This segment works to improve safety conditions for patients, healthcare workers, hospitals, laboratories, and clinics. BD Diagnostics also aims to enhance laboratory efficiency and productivity. BD Diagnostics consists of two units: Preanalytical Systems and Diagnostic Systems. Preanalytical Systems For over 60 years, BD has enhanced the science of specimen collection and has increased lab efficiency and productivity. BD’s Preanalytical Systems is an industry leader in blood collection tubes and urine collection devices, such as their BD Vacutainer™ Push Button Blood Collection Set. This unit has also been helping customers in emerging markets, such as China and India, to improve lab safety by providing education on global standards of lab safety and proficiency testing. Diagnostic Systems This unit contains products that deal with disease and infection detection. The Diagnostic Systems unit experienced recent revenue growth due to strong sales of its automated diagnostic platforms, as well as its blood culture and TB systems. Not only this, but revenues were boosted by a strong flu season between 2013 and 2014. BD Biosciences BD Biosciences manufactures clinical and research products to assist in the study of cells and their components, as well as to improve the understanding of normal cell processes and diseased cell processes. This unit’s primary products are cell sorters and analyzers, antibodies and kits for cell analysis, and reagent systems for life science research. BD Biosciences’ largest customers are research and clinical laboratories, academic institutions, biotech companies, hospitals, and blood banks. CareFusion Corporation Business Overview CareFusion Corporation (CF) was incorporated in Delaware on January 14, 2009 as a spinoff of Cardinal Health, Inc. The spinoff was completed on August 31, 2009. CF was made of various clinical and medical product businesses that were a part of Cardinal Health. On September 1, 2009 CF began publicly trading on the New York Stock Exchange. They are currently headquartered in San Diego, CA. CF focuses on healthcare safety through the prevention of healthcare-associated infections and the reduction of medication errors. They are composed of two business segments: Medical Systems and Procedural Solutions. Both segments are further discussed below. Medical Systems The Medical Systems business segment focuses on the production of equipment for the use of medical management, which includes their respiratory ventilation and diagnostic technologies, infusion and medication dispensing technologies, as well as supply management. These products are designed to improve patient safety through the reduction of medication errors. CareFusion’s direct sales force primarily sells these products, but third-party distributors are used as well. The Medical Systems segment is divided into 3 separate units: Infusion Systems, Dispensing Technologies, and Respiratory Technologies. Figure 4: BD Diagnostics Revenue Growth Source: UOIG Spreads Figure 5: BD Biosciences Revenue Growth Source: UOIG Spreads Figure 6: CF Revenue Breakdown for 2013 Source: CF 2013 10-K 0 500 1000 1500 2000 2500 3000 3500 4000 0 200 400 600 800 1000 1200 1400 1600 $Millions$Millions 66% 34% Medical Systems Procedural Solutions
  • 4. December 5, 2014 UOIG 4 University of Oregon Investment Group Infusion Systems CareFusion’s infusion systems deliver medications and various fluids to patients in precise amounts over a wide range of infusion rates. They are the leader when it comes to the design, development and marketing of IV infusion systems. One of their key products is their Alaris™ System, which is a pump system that simultaneously delivers medications and fluids from multiple delivery modules while also monitoring a patient’s vital signs. The Alaris™ System also only uses CareFusion disposables, allowing for a long-term revenue stream associated with the refilling of these disposables when needed. Dispensing Technologies This unit focuses on the production of automated dispensing systems for medications and supplies. These products are usually supplied to hospitals and other healthcare facilities inside the United States. CareFusion manufactures these dispensing systems in order to reduce medical error and increase efficiency in hospitals. Their Pyxis products automate the management of medications from the pharmacy to the nursing unit, as well as the medication management inside operating rooms. These products ultimately decrease order turnaround time and reduce transcription errors. Respiratory Technologies CareFusion’s Respiratory Technologies unit develops, manufactures, and markets mechanical ventilators and other consumables for patients with respiratory disorders. Respiratory disorders are among the highest cost, highest risk, and largest growing hospital populations. Their products provide both invasive and noninvasive respiratory support, and accommodate both pediatric and adult patients. Their AVEA and VELA ventilator systems are versatile units for the use in both acute care and alternate care settings. Procedural Solutions The Procedural Solutions business segment revolves around the production of disposable products and reusable surgical instruments. The majority of these products are used in the preparation of patients for the operating room, or in the operating room itself. A combination of CareFusion’s direct sales force and third-party distributors are used to sell these products. This segment is separated into three units: Infection Prevention, Medical Specialties, and Specialty Disposables. Infection Prevention This unit consists largely of single-use products for the preparation of surgical and vascular procedures. This includes their line of ChloraPrep single-use sterile applicators, IV infusion valves, and Chemo Safety System, which delivers chemotherapy drugs to patients without exposing healthcare personnel to the hazardous drugs. Medical Specialties CareFusion’s Medical Specialties business unit produces specialty medical devices, such as reusable surgical instruments and devices used in interventional care. They provide over 25,000 unique surgical instruments, as well as surgical instrument tracking and sterilization container systems. While most of these products are used in hospitals and clinics, the Medical Specialties unit also manufactures their PleurX drainage system, which is used in the home management of diseases and infections. Specialty Disposables 0 500 1000 1500 2000 2500 3000 3500 Figure 7: CF Medical Systems Revenue Growth Source: UOIG Spreads 0 500 1000 1500 2000 2500 Figure 8: CF Procedural Systems Revenue Growth Source: UOIG Spreads Figure 9: CF ChloraPrep Applicator Source: Google Images $Millions$Millions
  • 5. December 5, 2014 UOIG 5 University of Oregon Investment Group The Specialty Disposables unit is organized around the marketing and manufacturing of respiratory consumable products that work with CareFusion’s range of ventilators, such as ventilator circuits and oxygen masks. In December 2013 CareFusion acquired Vital Signs, which manufactures single-use respiratory care and anesthesiology consumables. Industry Overview BD operates in the Medical Instrument & Supply Manufacturing industry. This industry researches, develops, and manufactures surgical, medical, dental, and veterinary products. With over 15,429 businesses in this industry, it is considered quite large. The company with the largest market share in this is Johnson & Johnson, with an 8.4% market share. BD has the third largest market share at 3.2%. Companies in this industry have moderate fixed capital expenses. A large variety of products are made in this industry for highly specialized applications, so not all products can be made on an automated manufacturing line. Skilled employees are needed to make many of these products, and these companies usually receive salaries that are above the average for the manufacturing sector. For every $1 spent on capital, approximately $0.17 is spent on wages for employees. Larger companies in this industry have a few advantages, one being economies of scale. They are able to significantly reduce the costs of the production of goods. Not only this, but their greater revenues allow them to spend more on research and development, which is critical in this industry. Larger companies are also able to use their large financial resources to acquire the smaller companies. The smaller companies are usually more innovative, so these acquisitions greatly benefit companies such as Johnson & Johnson and Becton, Dickinson & Co. If current trends continue, the industry will consolidate and the market shares of larger companies will grow. Growth potential for this industry is moderate. While the industry is mature and has many large, established companies, the possibilities of growth for companies such as BD are great due to the availability of small, innovative companies that can be acquired. Also, with the rate at which medical technology is advancing there is great potential for growth. Not only this, but there are many favorable macroeconomic factors that will assist in the growth of this industry. Macroeconomic Factors Aging Adult Population In the past few years, the percentage of the adult population aged 65 and older has increased significantly. This is mostly due to baby boomers (adults born between the years 1945 and 1964). The growth rate of this population over the last 5 years has been about 3.1%, compared to a growth rate of 0.8% between the years of 1995 and 2000. This growth rate is expected to increase to 3.3% between 2014 and 2019. This is due to the majority of baby boomers that still remain that have not crossed the 65 year threshold. In the US in 2019, senior adults (age 65 or over) are expected to make up approximately 16.4% of the population, compared to 14.5% currently. In most cases, as people age they require more medical care. This increase in medical Figure 10: % Change of People with Health Insurance Source: IBIS World %Change Figure 11: Healthcare Sector vs. Medical Instrument and Supply Manufacturing Industry Costs Source: IBIS World 0 1 2 3 4 5 1991 1996 2001 2006 2011 2016 Source: IBIS World Figure 12: % Change of Adults over the Age of 65 %ChangePercentage -4 -3 -2 -1 0 1 2 3 4 17.4 19.2 3 31.2 1.62.5 3 59 45.5 10.3 17.2 6.6 10.5 0 10 20 30 40 50 60 70 80 90 100 Average Costs of all Industries in Sector Industry Costs Other Rent & Utilities Marketing Depreciation Purchases Wages Profit
  • 6. December 5, 2014 UOIG 6 University of Oregon Investment Group care will lead to an increase in demand for medical supplies. An increase in healthcare expenditure is one indicator of healthcare industry performance. Patient Protection and Affordable Care Act The passing of Patient Protection and Affordable Care act by President Obama and his administration has changed the US healthcare market, and will therefore affect BD. The goal of the PPACA is to increase the quality and affordability of health insurance by expanding private and public health insurance coverage. It requires all insurance companies to cover all people who apply for insurance within new standards. Not only this, but it requires insurance companies to offer the same rates regardless of pre-existing conditions or sex. One adverse effect that comes from the PPACA is the enactment of a 2.3% medical excise tax on sales of certain medical products within the US. In 2013 this tax was $40 million for BD. This tax could arguably stifle innovation and cut into research and development. Another adverse effect of the PPACA is that it reduces Medicaid and Medicare payments to hospitals, clinical laboratories, and pharmaceutical companies. This could reduce the amount of medical procedures performed, which, in turn, would reduce the demand for medical supplies. Finally, the PPACA could lower the reimbursement rates for BD’s products, therefore reducing sales. However, the PPACA will at the same time affect BD favorably through the expansion of healthcare. Healthcare expenditures will undoubtedly increase substantially, with an estimated 32 million people gaining healthcare by 2019. Even though there are possible adverse effects, as listed above, it can be expected that there will be a net benefit from the PPACA. Product Regulation The Medical Instrument and Supply Manufacturing industry is extremely regulated by the Food and Drug Administration (FDA) and other agencies. The approval of the sale of a product by the FDA takes at least 90 days, with the majority taking much longer than that. Any change to a device that has already been cleared must be refiled with the FDA. Even after a device is cleared, there is extensive product testing that occurs. There are many regulatory requirements, such as medical device reporting (MDR), Quality System Regulation (QSR), and labelling regulations. All of these are time-intensive and, if not passes, can result in a long delay of the product or a serious fine. While these regulations are substantial, they also lead to the securing of patents, because of how long it takes to get approved. Small firms with these patents are seen as lucrative acquisitions by larger companies because of the new and innovative products they can acquire. Globalization Expansion into international markets, especially emerging markets like China and South America, pose promising opportunities for companies in the healthcare industry. China, for example, is having an enormous boost in population and healthcare expansion. Companies such as BD will be competing to obtain market shares in these emerging markets because of their opportunities for growth. However, with expansion into global markets comes foreign currency exchange risk. BD conducts a large portion of its business outside the United States, and is therefore subject to this foreign currency exchange risk. While BD participates in hedging activities to reduce this risk, it will never completely remove these risks. Figure 13: The Patient Protection and Affordable Care Act Logo Source: Google Images Figure 14: % Change of Number of Physician Visits Source: IBIS World %Change Figure 15: FDA Logo Source: Google Images Figure 16: Industry Barriers to Entry Source: IBIS World Barriers to Entry Checklist Level Competition Medium Concentration Low Life Cycle Stage Mature Capital Intensity Medium Technology Change High Regulation & Policy Heavy Industry Assistance Medium -10 -5 0 5 10 15
  • 7. December 5, 2014 UOIG 7 University of Oregon Investment Group Competition The Medical Instrument and Supply Manufacturing industry is considered moderately competitive. Because of the amount of government regulation on products and companies within the industry, competition can be limited. As stated before, the regulation by organizations like the FDA can be a significant barrier to entry. However, the industry is fueled by innovation, so every company is looking for how to improve and add to their line of products. Specialization is very important in the medical industry, so this allows smaller companies to compete. As stated before, these small companies are attractive targets of larger companies for buyouts. While this rapid technological innovation has its benefits, it also has some drawbacks. The constant change in technology means that any one company is at risk at becoming obsolete. Pricing power will become more important in the coming years, due to the price concessions that healthcare providers and governments are pushing for. Companies will need to cut costs and achieve economies of scale to be competitive. These companies will therefore most likely turn to outsourcing, increasing spending on acquisitions, and increasing research and development costs to develop proprietary technology. While there is a large amount of internal competition within the Medical Instrument and Supply Manufacturing industry, there is traditionally little external competition. However, this is changing with due to the advancements of the biotechnology industry. Treatments from the biotech industry, such as synthetic bone, organ, and tissue replacements can make some medical instruments and supplies obsolete. Technology advancements in this industry are therefore critical to the survival of a firm. Strategic Positioning Sales and Marketing BD’s current sales and marketing strategy is to focus on capitalizing on emerging markets such as China and India. Over the past few years China has made many steps to increase the accessibility of healthcare for its citizens. This creates a large opportunity for revenue growth for BD. To obtain positioning in this market and other emerging markets, BD has been increasing brand equity through customer-focused initiatives. When possible, BD partners with various organizations across the globe to volunteer in impoverished communities to raise awareness about diseases and strengthen healthcare. For example, in 2005 BD launched their Service Trip Program by collaborating with the Catholic Medical Mission Board in order to address and combat HIV/AIDS in Zambia. BD also sends products as well as employees to various countries to give their time and expertise in laboratories to treat diseases and improve health standards. The presence of BD in these emerging markets allows BD to leverage the trust it has gained in order increase revenues and capitalize on these markets. Customer Relationships BD prides itself in its customer relations. Therefore, BD markets its products in the US through independent distribution channels and directly to consumers through their independent sales representatives. Because of these independent distribution channels and sales representatives, BD is able to reduce order Figure 17: Industry Products and Services Segmentation Source: IBIS World Figure 18: Net Income vs. SG&A Expense Source: UOIG Spreads $Millions Figure 19: CMMB Logo Source: Google Images 0 500 1000 1500 2000 2500 3000 3500 4000 4500 5000 Net Income SG&A 23% 19% 15% 13% 11% 8% 6% 5% Orthopedic Instruments Surgical Instruments Diagnostic Apparatus Stents and Catheters Other Syringes and Hypodermic Needles Blood Transfusion and IV Equipment Dental Instruments
  • 8. December 5, 2014 UOIG 8 University of Oregon Investment Group backlog significantly. It allows BD to receive and fill orders on a current basis. These independent channels are spread throughout their various geographic regions to reach their customers. This allows BD to cater to a customer’s needs more effectively by deciding what products need to be supplied where, or create new products to meet those needs. Also, none of BD’s customers account for more than 10% of BD’s revenues. This allows BD to change its products to fit a variety of groups, and benefits BD and its customer-focused strategy greatly. Operational Efficiency In recent years BD has implemented an operation strategy by the name of Project ReLoCo in order to cut costs. This project is a global, cross-functional business initiative that is designed to reduce manufacturing costs through the reduction of raw material costs and start-up costs. Management attributes the 80 bps growth of gross margin from 2012 to 2013 to the efforts of Project ReLoCo. BD management is also incorporating a Lean Six Sigma operation into their business. This operation aims to reduce manufacturing and operating costs by analyzing how products are made and how efficiencies might be increased. While the two above operations aim to cut costs and improve efficiency, the acquisition of CareFusion may prevent costs from being reduced because of the restructuring that will occur once deal is finalized. Also, CareFusion has a higher percentage of cost of goods sold as a portion of revenue than BD has, so this could affect BD’s costs in the near future. Research and Development As stated above, research and development is a key factor in the success of a company in the medical instrument and supply manufacturing industry. Rapid technological advancements in medical technology require firms to be on the forefront of product innovation. BD is focused on organic R&D spending in order to continually improve its current products and develop new ones to supplement those already existing. Management currently focuses a large portion of R&D spending on products that are successful in high growth markets in order to increase revenue growth. BD’s research and development is also spending resources on how to improve efficiency and cut costs of current operations. Acquisitions are also a very important of BD’s R&D strategy. By acquiring companies BD is able to expand its product offerings. Acquisitions are discussed in greater detail below. Business Growth Strategies Geographic Growth BD’s current strategy is to expand both internationally and domestically in all of its business segments. While in most recent years their focus has been on international expansion, the acquisition of CareFusion will increase their domestic revenues significantly. Emerging Markets Emerging markets have been a large focus of BD’s in the past due to the high growth rates of healthcare offerings in these markets. New legislation in countries such as China and Brazil that work to ensure healthcare worker safety helped growth rates in 2013, and will continue to improve growth rates. Many Figure 20: Gross Margin Growth Source: UOIG Spreads Figure 21: R&D Expense vs. Net Income Source: UOIG Spreads Figure 22: R&D Expense vs. EBITDA Source: UOIG Spreads $Millions$Millions 50% 51% 52% 53% 54% 55% 56% 57% 0 500 1000 1500 2000 2500 R&D Net Income 0 500 1000 1500 2000 2500 3000 3500 4000 4500 R&D EBITDA
  • 9. December 5, 2014 UOIG 9 University of Oregon Investment Group emerging markets are focusing on improvements to healthcare safety and the reduction of healthcare related infections. The products that CareFusion’s Medical Segment offers will supplement BD’s current products and capitalize on the need for medical safety supplies in these emerging markets. As mentioned before, BD is increasing brand equity in these emerging markets through their philanthropic work. By supporting private and public sector partners and enhancing clinical expertise and training in laboratories and hospitals, BD is able to establish a strong customer base. BD has been operating in India and China since 1995, so they have a large amount of knowledge on public policy and the healthcare changes occurring in Asia currently. As of October 27, 2014 BD was ranked 10th on the EPA’s Fortune 500® Partners List. In countries such as China that are working to improve their environmental impact, having BD as a player in the market is beneficial to their image. United States The United States currently is responsible for the majority of BD’s sales. In the macroeconomics factors section above, the PPACA was discussed. This could ultimately be beneficial for revenue growth in the US due to the substantial increase in healthcare offerings. With over 32 million Americans expected to obtain healthcare by 2019, healthcare expenditures will almost certainly increase. However, with the medical device excise tax, reductions in Medicare and Medicaid payments to hospitals, and possible cuts to reimbursements of BD’s products, the PPACA could also cause significant adverse effects to revenue growth. BD’s acquisition of CareFusion, a US based company, should improve domestic growth rates. With almost 77% of its revenue generated from domestic sales, CareFusion could increase domestic revenues for BD’s Medical segment significantly. This acquisition will be discussed in greater detail in the acquisitions section. New Product Growth While BD has concentrated their focus away from a product-focused strategy to a customer-focused strategy in the past few years, R&D expenses have increased to further the development of innovative products. With their customer-focused strategy, BD needs to be able to cater to all customers’ needs, so they need a wide variety of products, especially those in emerging markets. Between 2015 and 2017 BD plans to release over 14 new products in the US and internationally in order to increase sales and provide a greater selection to its customer base. Through Q3 of 2014, new products have accounted for approximately 11% of revenues, while for the 2013 fiscal year new products only accounted for about 8% of revenue. This shows the effectiveness of BD’s R&D department and its innovating capabilities. BD’s acquisition of CareFusion will also introduce a large amount of new products into its offerings. More on this will be discussed in the acquisitions section. Organic Growth Funding for organic growth is planned to increase in the coming years. This is due to the Project ReLoCo and Lean Six Sigma strategies to cut costs across all business segments and increase operational efficiencies. BD continues to allocate more funding towards R&D to develop current product lines, such as the BD Max™ product line, which is one of BD Diagnostics’ revenue drivers. This past year alone 3 new products were released for the BD Max system. Figure 23: EPA Logo Source: Google Images Figure 24: CareFusion Corporation Logo Source: Google Images Figure 25: BD Max™ System Source: Google Images
  • 10. December 5, 2014 UOIG 10 University of Oregon Investment Group Also, the expansion of distribution channels domestically and internationally is expected to increase organically in order expand BD’s customer base, as well as fulfill the needs of pre-existing customers. Acquisitions Being in the medical instrument and supply manufacturing industry, acquisitions are essential to being competitive because of the rapid technology advancements and the introduction of many new products every year. BD acquires companies that it believes can fill “gaps” in its operations by supplementing already existing products. For example, on March 11, 2013 BD acquired Cato Software Solutions (“Cato”). Cato provides a suite of medication safety solutions for IV medication preparation, as well as physician therapy planning and bedside documentation. This acquisition helped BD’s strategy by helping healthcare workers eliminate medication errors and streamline workflows. Additionally, it increases BD’s presence in the hospital pharmacy space. BD management says that no company is acquired unless it can deliver tangible and significant benefits to BD’s products that BD cannot do on its own otherwise. CareFusion Corporation On October 5, 2014 Becton, Dickinson & Co. announced that would acquire CareFusion Corporation. This acquisition was agreed on unanimously by the Boards of both companies. The deal states that CareFusion shareholders will receive approximately $49 in cash and .0777 of a share of BD for every share of CareFusion. The agreement is expected to close in the middle of 2015, with BD shareholders owning approximately 92% of the combined company and CareFusion shareholders owning approximately 8%. To finance the acquisition, BD acquired a loan of $9.1 billion from Goldman Sachs. CareFusion will add a variety of products that will complement BD’s through expansion in the medication management industry. This acquisition also aligns with BD’s new customer-focused strategy by increasing patient safety through CareFusion’s automated medication dispensing systems, IV infusion systems, and their patient preparation products. BD will also be able to provide CareFusion products to a wider customer base through expansion in emerging markets, such as China and Brazil. This will enhance emerging market growth opportunities. The combinations of the two companies’ product portfolios will help to increase efficiencies and reduce safety issues in hospitals and hospital pharmacies. BD will attempt to mitigate restructuring costs through a detailed execution plan that they have in place to ensure a seamless integration. Upon the closing of the acquisition, CareFusion will be integrated in to BD’s Medical segment. The cost of producing goods sold may increase marginally due to CareFusion having a larger percentage cost of goods sold that make up their revenue than BD. However, BD management maintains that gross margins will stay approximately the same. Also, CareFusion management maintains its financial guidance of 5 to 7 percent for the 2015 fiscal year, while BD maintains its guidance of 4 to 5 percent. While BD wants to expand CareFusion’s products to emerging markets, management has stated they are committed to maintaining a presence in San Diego, CA, the headquarters location of CareFusion. This will allow for increased revenue growth in the US, which in most recent years has been secondary to revenue growth in emerging markets. However, BD will be Figure 26: Cato Software Solutions Source: Google Images Figure 27: CareFusion Alaris® with Guardrails® System Source: Google Images Source: carefusion.com Figure 28: CareFusion Genesis® Sterilization Containers
  • 11. December 5, 2014 UOIG 11 University of Oregon Investment Group focusing on the expansion of CareFusion’s product offerings in emerging markets. Management and Employee Relations Vincent A. Forlenza—Chairman, Chief Executive Officer, and President Vincent Forlenza has been a part of BD since 1980. On January 1, 2009 he was appointed President, and on October 1, 2011 was appointed Chief Executive Officer. Mr. Forlenza was named Chairman on July 1, 2012, and has held the position since. Prior to these positions, Mr. Forlenza was the Chief Operating Officer of BD and has extensive experience with the BD Biosciences and BD Diagnostics segments. He was also formerly the Chairman of AdvaMed Dx at AdvaMed. Mr. Forlenza holds a Bachelor’s Degree in Chemical Engineering from Lehigh University, as well as an MBA from the Wharton School of the University of Pennsylvania. Christopher R. Reidy—Chief Financial Officer and Executive Vice President of Administration Christopher R. Reidy has been the Executive Vice President of Administration and Chief Financial Officer since July 15, 2013. Prior to being at BD, Mr. Reidy served as the Chief Financial Officer and Corporate Vice President of Automatic Data Processing Inc. (ADP) from October 2, 2006 to November 5, 2012. Mr. Reidy also served as the Chief Financial Officer at the National Basketball Association. He holds a BS in Accounting from St. Francis College, as well as a MBA from Harvard University. William A. Kozy—Chief Operating Officer and Executive Vice President William Kozy has been an Executive Vice President since June 2006, and was appointed Chief Operating Officer in November of 2012. Mr. Kozy previously served as the President of BD Diagnostics from November 2003 to June 2006. He has been with BD since 1974 when he took on a sales job. He has a BA in English from Kenyon College in Ohio. Gary M. Cohen—Executive Vice President Gary Cohen has been an Executive Vice President of BD since 2006. Prior to his position as Executive Vice President, Mr. Cohen has held various capacities at BD. He served as the President of BD Medical from May 1999 to June 2006. Mr. Cohen also served as the Chairman of the Center for Disease Control and Prevention Foundation from 2010 to 2014. He holds a BA and MBA from Rutgers University. Management Guidance Management provides guidance on EPS, revenues, and net income for the fiscal year of 2014 for their three business segments. The revenue model below is in line with their management guidance for coming year. Q3 of 2014 was in line with management guidance from Q2. Management expects that for the fiscal year of 2014 there will be an estimated revenue growth between 4 and 5 percent, and attain this growth by the end of the fiscal year. Guidance also expects an EPS between $6.12 and $6.22 for 2014, which represents a growth of between 6 and 7 percent from 2013. At the beginning of the fiscal year, management announced guidance for revenue growth for BD Medical, BD Diagnostics, and Figure 29: BD Headquarters Source: bd.com Figure 30: BD Management Compensation vs. Revenue $10,700.00 $10,800.00 $10,900.00 $11,000.00 $11,100.00 $11,200.00 $11,300.00 $11,400.00 $11,500.00 $11,600.00 $11,700.00 $0.00 $1,000,000.00 $2,000,000.00 $3,000,000.00 $4,000,000.00 $5,000,000.00 $6,000,000.00 $7,000,000.00 $8,000,000.00 $9,000,000.00 $10,000,000.00 2011 2012 2013 V. Forlenza C. Reidy W. Kozy G. Cohen Revenues ($ Millions) Source: bd.com $2,500.00 $2,600.00 $2,700.00 $2,800.00 $2,900.00 $3,000.00 $3,100.00 $3,200.00 $3,300.00 $3,400.00 $0.00 $1,000,000.00 $2,000,000.00 $3,000,000.00 $4,000,000.00 $5,000,000.00 $6,000,000.00 $7,000,000.00 $8,000,000.00 $9,000,000.00 $10,000,000.00 2011 2012 2013 V. Forlenza C. Reidy W. Kozy G. Cohen EBITDA ($ Millions) Source: bd.com Figure 31: BD Management Compensation vs. EBITDA Source: Google Images
  • 12. December 5, 2014 UOIG 12 University of Oregon Investment Group BD Biosciences to be 5.5 to 6 percent, 3 to 3.5 percent, and 4 to 5 percent, respectively. For the year-to-date, all segments are in line with their guidance. It should be noted that, historically, management has not given beatable guidance. Actual growth percentages usually fall in line with the guidance that management gives at the beginning of the fiscal year. Portfolio Strategy Becton, Dickinson & Co. is currently held by the Investment Group in both the Svigals’ and Tall Firs Portfolios. As of November 26, 2014 BD represented 3.20% of the Svigals’ Portfolio and 3.29% of the Tall Firs Portfolio. With its consistent revenues and dividends, BD is a strong value play, and is therefore a great company to hold in both the Tall Firs (value tilt) and Svigals’ (value/growth blend) Portfolios. Additionally, Tall Firs is underweight in large- cap stocks. Since purchase, BD has earned a 251.8% return on investment in the Tall Firs Portfolio and 93.03% return on investment in the Svigals’ Portfolio. Recent News “Becton Dickinson & Co Files SEC form 10-K, Annual Report” Edgar Online—November 26, 2014 BD filed their 10-K with the SEC on November 26, 2014. EPS, net income, and revenue growth all met management expectations. CEO Vince Forlenza gave guidance for the 2015 fiscal year, with EPS having a growth rate between 8 and 9 percent and revenues having an estimated growth between 4.5 and 5 percent. The announcement of the results in the 10-K caused a spike in the stock price on the NYSE, going from a closing price of $134.73 the day prior to a closing price of $136.79. “BD Board Declares Dividend” PR Newswire—November 25, 2014 The Board of Directors of Becton, Dickinson & Co. announced that for the fourth quarter of 2014 is $0.60 per share, which is an increase of about 10% from the previous quarter. Shareholders will receive the dividend on December 31, 2014. Management has set a guidance of $2.40 per share for fiscal year 2015. This announcement caused an increase in stock price, from $131.11 on November 24 to $134.73 on November 25. “Becton Dickinson to acquire CareFusion for $12.2 billion in cash, stock” Reuters—October 5, 2014 BD and CareFusion agreed upon the acquisition of CareFusion by BD for $12.2 billion in cash and stock. Goldman Sachs approved BD for a $9.1 billion loan to finance the acquisition. BD also announces that, within the first full year of the acquisition, they will experience double-digit earnings growth. The deal is expected to close around Q2 of fiscal year 2015. More details on the acquisition are included in the acquisitions section. The announcement of the deal caused a stock price jump from $115.84 to $124.98. Figure 32: BD Three Month Stock Price $100.00 $105.00 $110.00 $115.00 $120.00 $125.00 $130.00 $135.00 $140.00 $145.00 Source: Yahoo Finance Figure 33: BD Dividends per Quarter Figure 34: Goldman Sachs Group Inc. Logo Source: BD 10-K Source: Google Images $- $0.10 $0.20 $0.30 $0.40 $0.50 $0.60 First Quarter Second Quarter Third Quarter Fourth Quarter 2012 2013 2014 Source: Yahoo Finance
  • 13. December 5, 2014 UOIG 13 University of Oregon Investment Group Catalysts Upside  The large acquisition of CareFusion Corporation will increase revenues and positioning in the medication management industry significantly, as well as supplement BD’s current products.  The PPACA will benefit BD through the expansion of healthcare offerings in the US, which will increase the amount of people with health insurance, hospital and clinic visits, as well as total health expenditure, which will boost BD sales.  The rapid growth in the adult population age 65 and over will increase demand for BD product, since this population, on average, requires more medical care.  Strategies to cut costs in the manufacturing of products and increased focus on research and development will increase organic growth. Downside  There is strong competition in the Medical Instrument and Supply Manufacturing industry, such as Johnson & Johnson and Baxter International.  Reduced reimbursements of BD’s products, the medical device excise tax, as well as reductions in payments from Medicare and Medicaid to hospitals from the PPACA could adversely affect BD’s sales.  The rapid advancements in medical technology could make some of BD’s products obsolete if planned acquisitions and R&D developments do not benefit the company as expected.  Because of its international operations, BD is subject to foreign currency exchange fluctuations and local economic factors, which could adversely affect sales. Comparable Analysis Comparable companies were screened for estimated growth rates for EPS, beta, D/E, as well as gross profit margins. Other metrics considered were industry, sector, company size, market capitalization, and headquarter location. All comparable companies, except for Covidien Plc are based in the United States. Projected revenue growth for the comparable companies is very similar to that of BDX, and is a good indicator of performance. Finally, companies were also screened for their product offerings and exposure to international markets. Initially, 10 large market capitalization companies in the Healthcare sector were considered. This was reduced to 5 after using the metrics mentioned above. The comparable analyses are below. Boston Scientific Corporation (BSX)—35% Boston Scientific Corporation develops, manufactures, and markets medical devices for use in various interventional medical specialties worldwide. The company operates in three segments: Cardiovascular, Rhythm Management, and MedSurg. It offers interventional cardiology products, stents, balloon catheters, as well as cardiac rhythm management devices.—Yahoo Finance Boston Scientific Corporation was chosen because it has the closest revenue growth than any of the other companies, its net margin was very close to BD’s, Johnson & Johnson 8.40% Stryker 4.90% Becton, Dickinson & Co. 3.20% Baxter International 2.10% Boston Scientific Corp. 1.90% Covidien PLC 1.30% Other 78.20% Figure 36: Estimated Industry Market Share Source: IBIS World Figure 37: Boston Scientific Corporation Logo Source: Google Images Figure 35: BD Vacutainer™ Tubes Source: bd.com
  • 14. December 5, 2014 UOIG 14 University of Oregon Investment Group and it had a very similar debt to equity ratio. Not only this, but it has a very close EV/EBITDA ratio, which is a good indicator of cash flow. It was weighted higher than Covidien Plc because, while Covidien has similar metrics to both Boston Scientific Corporation and BD, Boston Scientific Corporation is has a greater market share in the Medical Instrument and Supply Manufacturing Industry. Covidien Plc (COV)—25% Covidien plc develops, manufactures, and sells healthcare products for use in clinical and home settings worldwide, and markets its products through a direct sales force and third-party distributors. The company operates through Medical Devices and U.S. Medical Supplies segments. It sells advanced surgical solutions, general surgical solutions, and access and delivery products to support procedures.—Yahoo Finance Covidien Plc showed very similar revenue growth rates to that of BD. Their gross margins are also similar, as well as their betas. However, it was announced in mid-2014 that Covidien would be acquired by medical device manufacturer Medtronic Inc. Therefore, this acquisition, combined with the fact that it has a lower market share in the industry than Boston Scientific Corporation, is the reason it was weighted lower. Thermo Fisher Scientific, Inc. (TMO)—15% Thermo Fisher Scientific Inc. provides analytical instruments, equipment, reagents and consumables, software, and services for research, manufacturing, analysis, discovery, and diagnostics in the United States and internationally. It operates in three segments: Analytical Technologies; Specialty Diagnostics; and Laboratory Products and Services. It serves pharmaceutical, biotechnology, academic, government, environmental, and other research and industrial markets.—Yahoo Finance Thermo Fisher Scientific Inc. was chosen as a comparable company because of its similar gross margin, expected revenue growth, and EBITDA margin. It also operates in the same industry as BD. However, its market capitalization and enterprise value are much larger than BD’s, and its beta is a good deal higher than BD’s. CR Bard Inc. (BCR)—15% C. R. Bard, Inc. designs, manufactures, packages, distributes, and sells medical, surgical, diagnostic, and patient care devices worldwide. It offers vascular products, urology products, surgical specialty products, as well as catheter stabilization devices. It sells its products directly to hospitals, individual healthcare professionals, extended care facilities, and alternate site facilities.— Yahoo Finance. CR Bard Inc. has similar estimated sales growth rates to BD for 2014-2016. Net margin, as well as gross margin, were similar, indicating similar cost structures. However, it has significantly a smaller market capitalization and enterprise value than BD, hence the lower weighting. Baxter International, Inc. (BAX)—10% Baxter International Inc. manufactures, develops, and markets products for people with hemophilia, immune disorders, infectious diseases, kidney diseases, trauma, and other chronic and acute medical conditions. Baxter International is organized into two business segments: Medical Products and Bioscience. It sells its products through its direct sales force, independent distributors, drug Figure 38: Covidien Plc Logo Source: Google Images Figure 39: Thermo Fisher Scientific, Inc. Logo Source: Google Images Figure 40: CR Bard Inc. Logo Source: Google Images
  • 15. December 5, 2014 UOIG 15 University of Oregon Investment Group wholesalers, and specialty pharmacies or other alternate site providers to hospitals. It operates domestically and internationally.—Yahoo Finance Baxter International, Inc. has a very similar business model as BD. Two of BD’s business segments are even the same as Baxter’s. However, estimated revenue and EPS growth between 2014 and 2016 differ between the companies. BD also has a higher gross margin than Baxter International. Even though it is a direct competitor to BD, Baxter International is weighted the lowest due to the reasons stated above. Discounted Cash Flow Analysis The discounted cash flow analysis of BD was took into account both BD’s historical financial data and CareFusion’s. This is because the acquisition of CareFusion is so large that will have a significant impact on future performance. Therefore, all historical data was combined in their respective categories, and then forecasted together. A percentage of revenue method was used to predict future financial data. Management guidance, industry expectations, historical trends, and analyst expectations for both companies was taken into account when forecasting data. In the final price target, the discounted cash flow analysis was weighted higher than the comparable analysis because the discounted cash flow analysis will be a better representative of future performance than the comparable analysis. Revenue Model The revenue model was created by breaking out both companies into their respective business segments and, if applicable, then the segments’ smaller organizational units. Financial data from 2009 until 2013 (2014 for CareFusion because their fiscal year ended June 30) was used, and then projected out until 2023, which was the terminal year for analysis. Factors that influenced BD revenue growth rates were the aging adult population, increases in healthcare expenditures, planned new product releases, and synergies created through the acquisition of CareFusion. CareFusion revenue growth rates were affected by management guidance and historical trends. Once both companies were forecasted out individually, their historical and projected revenues were combined into one revenue model, to show how CareFusion will increase BD’s revenues substantially, and how the combined company’s sales will trend in the future. Beta Beta was calculated using a variety of methods. First, the 1, 3, and 5 year daily betas were calculated for both BD and CareFusion by regressing their historical stock prices against those of the S&P 500. The 3 and 5 year weekly betas were then calculated for both companies. Weighted betas for the 1, 3, and 5 year daily and 3 and 5 year weekly were then calculated by weighting a companies’ beta according to its market capitalization size. Vasicek and Hamada betas were calculated using both a blend of comparable companies and an ETF specific to the Medical Instrument and Supply Manufacturing Industry. The Vasicek and Hamada betas were weighted higher than the 1 year and 3 year daily weighted mix betas because of the large change that is occurring through the acquisition of CareFusion by BD. These betas were also used because of consolidation within the industry, and BD will move Figure 41: CR Bard Inc. Logo Source: Google Images Figure 42: Projected Revenues Through 2023 Source: UOIG Spreads $Millions Figure 43: Beta Source: UOIG Spreads Beta SE Weighting 1 Year Daily-BDX 0.79 0.08 0.00% 3 Year Daily-BDX 0.75 0.03 0.00% 5 Year Daily-BDX 0.71 0.02 0.00% 3 Year Weekly-BDX 0.72 0.08 0.00% 5 Year Weekly-BDX 0.66 0.05 0.00% 1 Year Daily-CFN 0.82 0.16 0.00% 3 Year Daily-CFN 0.84 0.06 0.00% 5 Year Daily-CFN 0.88 0.04 0.00% 3 Year Weekly-CFN 0.58 0.16 0.00% 5 Year Weekly-CFN 0.70 0.09 0.00% 1 Year Daily-Weighted Mix 0.80 10.00% 3 Year Daily-Weighted Mix 0.78 10.00% 5 Year Daily-Weighted Mix 0.76 0.00% 3 Year Weekly-Weighted Mix 0.68 0.00% 5 Year Weekly-Weighted Mix 0.67 0.00% 3 Year Daily Vasicek - Comps 0.81 20.00% 3 Year Daily Vasicek - ETF 1.04 20.00% 3 year Daily Hamada - Comps 0.87 20.00% 3 Year Daily Hamada - ETF 1.18 20.00% Becton, Dickinson & Co. Beta 0.94 $- $2,000.00 $4,000.00 $6,000.00 $8,000.00 $10,000.00 $12,000.00 $14,000.00 $16,000.00 $18,000.00
  • 16. December 5, 2014 UOIG 16 University of Oregon Investment Group toward the industry average over time. Also, the weighted mix betas were used instead of the individual betas of the companies because they will be better indicators of future performance. After assigning weightings to each of the betas, a final beta of .94 was reached. Cost of Goods Sold The cost of goods sold was projected for the combined company. Cost of goods sold as a percentage of revenue was projected to decrease because of BD’s Project ReLoCo and Lean Six Sigma projects. These two projects will drive down the cost of manufacturing goods and increase efficiencies. Selling, General and Administrative Growth in Selling, General and Administrative is due to increases in rent payments, salary expenditure, and other payments for operations. In 2013 SG&A was higher due to an unfavorable litigation against BD that resulted in a $341 million charge. SG&A projections were based off historical percentages of revenue, and are predicted to gradually increase. Research and Development Research and Development is projected to increase as a percentage of revenue going through 2023. R&D is critical to the success of firms like BD, so as BD continues their cost cutting strategies into the future, some of the savings will be directed towards research and development. Depreciation and Amortization Depreciation and Amortization was projected to increase as a percentage of Net PP&E Beginning through the terminal year. This is because of plans to continue expanding operations into emerging markets, as well as a continued strategy of small acquisitions to fill “gaps” in BD’s product line. Historical data for both BD and CareFusion were combined and projected into the terminal year together. Net Working Capital Projections for Net Working Capital were primarily based off of historical trends. Both companies’ historical data were added together and then projected together. They were projected forward as a percentage of revenue. Capital Expenditures Capital Expenditures, like Net Working Capital, were also projected using a percentage of revenue method. Both BD’s and CareFusion’s historical data was combined, and then the combined company’s Capital Expenditures were projected. Projection growth rates increase year to year because of the expectations to expand operations, therefore increasing capital expenditures. Cost of Debt Cost of Debt was calculated by combining both BD’s debt and CareFusion’s debt together. This is because, after the merger, BD will take on all of CareFusion’s short term and long term debt. Also, BD’s loan of $9.1 billion from Goldman Sachs was factored into Cost of Debt because of its significant value. The resulting Cost of Debt is 3.8% Tax Rate The tax rate calculated was for the combined company through the terminal year. It was based off both BD’s and CareFusion’s historical tax rates. Also, Figure 45: Beta Sensitivity Table Source: UOIG Spreads Figure 46: Beta Sensitivity Table ImpliedPrice Undervalued/(Overvalued) Terminal Growth Rate Terminal Growth Rate 158 2.0% 2.5% 3.0% 3.5% 4.0% 0.74 156.30 183.96 221.79 276.65 363.39 0.84 134.77 156.70 185.72 225.93 285.37 0.94 116.83 134.54 157.38 187.92 230.85 1.04 101.64 116.18 134.52 158.36 190.60 1.14 88.62 100.72 115.70 134.72 159.67 AdjustedBeta Undervalued/(Overvalued) Terminal Growth Rate 0 2.00% 2.50% 3.00% 3.50% 4.00% 0.74 10.80% 30.41% 57.23% 96.12% 157.61% 0.84 (4.46%) 11.09% 31.66% 60.17% 102.30% 0.94 (17.18%) (4.62%) 11.57% 33.22% 63.65% 1.04 (27.95%) (17.64%) (4.64%) 12.26% 35.12% 1.14 (37.18%) (28.60%) (17.98%) (4.50%) 13.19% AdjustedBeta Figure 44: Cost of Goods Sold Source: UOIG Spreads Source: UOIG Spreads 42.80% 43.00% 43.20% 43.40% 43.60% 43.80% 44.00% 44.20% 44.40% 44.60%
  • 17. December 5, 2014 UOIG 17 University of Oregon Investment Group tax rates of comparable companies were taken into account. As mentioned previously, a 2.3% medical device excise tax was enacted on January 1, 2013. However, this tax was factored into operating expenses and was not factored into the effective tax rate. An effective tax rate of 21.63% was calculated for the terminal year. Recommendation I recommend a hold for both the Tall Firs Portfolio and the Svigals’ Portfolio. The acquisition of CareFusion will increase BD’s sales significantly through CareFusion’s complementary product line. Not only this, but BD will be able to offer CareFusion’s products to a larger customer base through their independent distribution channels in emerging markets. Additionally, BD’s development of their already superior products, their effort to strengthen their brand equity, and their ability to cut costs through economies of scale will bolster organic growth. With an undervaluation of 17.66%, Becton, Dickinson & Co. is a strong hold for both portfolios.Source: UOIG Spreads Method: Price Objective Weighting DCF Analysis $158.17 60% Comparable Analysis $177.68 40% Price Target $165.97 Current Price $141.06 Undervalued 17.66% Final Price Target Figure 47: Final Implied Price
  • 18. UOIG 18 December 5, 2014University of Oregon Investment Group Appendix 1 – Relative Valuation Comparables Analysis BDX BSX COV TMO BCR BAX ($ in millions) Becton, Dickinson & Co. Boston Scientific Corporation Covidien Plc Thermo Fisher Scientific, Inc. CR Bard Inc. Baxter International Stock Characteristics Max Min Median Weight Avg. 35.00% 25.00% 15.00% 15.00% 10.00% Current Price $171.27 $12.94 $115.31 $33.03 $141.06 $12.94 $101.62 $129.00 $171.27 $73.44 Beta 1.19 0.76 0.96 1.03 0.94 1.17 0.99 1.19 0.79 0.76 Size Short-TermDebt 3,088.00 - 300.00 755.20 208.00 3.00 1,007.00 3,088.00 - 392.00 Long-TermDebt 14,856.00 1,403.00 6,562.50 5,303.90 14,856.00 4,249.00 4,042.00 11,388.00 1,403.00 8,876.00 Cash and Cash Equivalent 4,380.00 246.00 1,100.00 828.30 4,380.00 246.00 1,228.00 544.00 972.00 2,078.00 Non-Controlling Interest - - - - - - - - - - Preferred Stock - - - - - - - - - - Diluted Basic Shares 1,326.00 75.00 426.00 702.55 192.00 1,326.00 452.00 400.00 75.00 542.00 Market Capitalization 51,600.00 12,845.25 33,444.00 31,135.75 27,083.52 17,158.44 45,932.24 51,600.00 12,845.25 39,804.48 Enterprise Value 65,532.00 13,276.25 42,381.00 36,366.55 37,767.52 21,164.44 49,753.24 65,532.00 13,276.25 46,994.48 Growth Expectations % Revenue Growth 2015E 3.83% .39% 0.04 3.37% 3.41% 3.77% 3.52% 3.71% 3.83% .39% % Revenue Growth 2016E 4.59% 3.75% 0.04 4.10% 4.12% 3.97% 4.26% 3.91% 4.59% 3.75% % EBITDA Growth 2015E 8.91% (9.09%) 0.05 5.60% (9.09%) 7.67% 3.72% 8.91% 5.51% (1.78%) % EBITDA Growth 2016E 7.46% 4.92% 0.06 6.35% 4.92% 6.34% 5.73% 7.46% 6.19% 6.54% % EPS Growth 2015E 11.58% (3.89%) 0.09 7.46% 9.01% 9.64% 4.58% 11.58% 10.63% (3.89%) % EPS Growth 2016E 10.99% 5.12% 0.09 9.98% 5.12% 10.99% 9.22% 10.77% 9.40% 8.10% Profitability Margins Gross Margin 70.41% 48.89% 0.59 61.17% 59.06% 70.41% 59.58% 48.89% 61.71% 50.43% EBIT Margin 24.52% 14.23% 0.22 19.78% 20.21% 14.23% 22.81% 22.00% 24.52% 21.17% EBITDA Margin 29.59% 23.75% 0.27 26.10% 26.65% 23.75% 28.24% 24.33% 29.59% 26.39% Net Margin 17.76% 15.03% 0.16 16.39% 15.84% 15.03% 17.76% 16.58% 17.33% 16.07% Credit Metrics Interest Expense $433.00 $45.00 211.50 $215.05 $232.00 $219.00 $204.00 $433.00 $45.00 $157.00 Debt/EV 0.40 0.10 0.20 0.16 0.40 0.20 0.10 0.22 0.11 0.20 Leverage Ratio 4.57 1.43 2.27 2.22 4.57 2.42 1.68 3.54 1.43 2.12 Interest Coverage Ratio 27.87 8.03 14.49 13.97 14.22 8.03 14.75 9.43 21.78 27.87 Operating Results Revenue $16,787.00 $3,312.00 11,519.00 $9,929.25 $12,379.00 $7,405.00 $10,659.00 $16,787.00 $3,312.00 $16,579.00 Gross Profit $8,360.00 $2,044.00 6,831.00 $5,786.45 $7,311.00 $5,214.00 $6,351.00 $8,208.00 $2,044.00 $8,360.00 EBIT $3,693.00 $812.00 2,466.50 $2,003.40 $2,502.00 $1,054.00 $2,431.00 $3,693.00 $812.00 $3,510.00 EBITDA $4,376.00 $980.00 3,154.50 $2,565.35 $3,299.00 $1,759.00 $3,010.00 $4,084.00 $980.00 $4,376.00 Net Income $2,783.00 $574.00 1,926.86 $1,632.85 $1,960.72 $1,113.00 $1,893.00 $2,783.00 $574.00 $2,665.00 Capital Expenditures $1,810.00 $96.00 405.00 $450.05 $674.00 $267.00 $397.00 $413.00 $96.00 $1,810.00 Multiples EV/Revenue 4.67x 2.83x 3.48x 3.64x 3.05x 2.86x 4.67x 3.90x 4.01x 2.83x EV/Gross Profit 7.98 4.06 6.06 6.11 5.17 4.06 7.83 7.98 6.50 5.62 EV/EBIT 20.47 13.39 17.05 18.60 15.09 20.08 20.47 17.74 16.35 13.39 EV/EBITDA 16.53 10.74 12.79 13.86 11.45 12.03 16.53 16.05 13.55 10.74 EV/(EBITDA-Capex) 19.04 14.19 16.43 16.49 14.39 14.19 19.04 17.85 15.02 18.31 Market Cap/Net Income = P/E 24.26 13.81 16.98 19.09 13.81 15.42 24.26 18.54 22.38 14.94 Multiple Implied Price Weight EV/Revenue 178.88 15.00% EV/Gross Profit 177.13 20.00% EV/EBIT 186.71 15.00% EV/EBITDA 182.44 20.00% EV/(EBITDA-Capex) 169.76 30.00% Market Cap/Net Income = P/E 194.98 0.00% Price Target $177.68 Current Price 141.06 Undervalued 25.96%
  • 19. UOIG 19 December 5, 2014University of Oregon Investment Group Appendix 2 – Discounted Cash Flows Valuation DiscountedCash FlowAnalysis Q1 Q2 Q3 Q4 ($ in millions) 2009A 2010A 2011A 2012A 2013A 12/31/2013A 03/31/2014A 06/30/2014A 09/30/2014E 2014E 2015E 2016E 2017E 2018E 2019E 2020E 2021E 2022E 2023E Total Revenue $10,066.00 $10,502.00 $11,023.00 $11,306.00 $11,604.00 $2,937.00 $3,039.00 $3,279.00 $3,124.00 $12,379.00 $12,800.59 $13,327.48 $13,865.51 $14,412.36 $14,958.39 $15,494.61 $16,022.46 $16,538.32 $17,038.35 % YoY Growth .97% 4.33% 4.96% 2.57% 2.64% 6.05% 3.55% 5.07% 4.81% 6.68% 3.41% 4.12% 4.04% 3.94% 3.79% 3.58% 3.41% 3.22% 3.02% Cost of Goods Sold 4517.00 4456.00 4123.00 4840.00 4307.00 1201.00 1202.00 1285.00 1380.00 $5,068.00 $5,677.06 $5,872.09 $6,080.03 $6,302.53 $6,529.34 $6,743.25 $6,961.76 $7,175.98 $7,384.42 % Revenue 44.87% 42.43% 37.40% 42.81% 37.12% 40.89% 39.55% 39.19% 44.17% 40.94% 44.35% 44.06% 43.85% 43.73% 43.65% 43.52% 43.45% 43.39% 43.34% Gross Profit $5,549.00 $6,046.00 $6,900.00 $6,466.00 $7,297.00 $1,736.00 $1,837.00 $1,994.00 $1,744.00 $7,311.00 $7,123.53 $7,455.39 $7,785.49 $8,109.84 $8,429.06 $8,751.36 $9,060.70 $9,362.34 $9,653.93 Gross Margin 55.13% 57.57% 62.60% 57.19% 62.88% 59.11% 60.45% 60.81% 55.83% 59.06% 55.65% 55.94% 56.15% 56.27% 56.35% 56.48% 56.55% 56.61% 56.66% Selling General and Administrative Expense 2736.00 2781.00 2891.00 2956.00 3402.00 788.00 789.00 826.00 826.00 3,229.00 3,360.16 3,507.79 3,653.56 3,801.98 3,952.01 4,098.32 4,241.15 4,381.00 4,516.87 % Revenue 27.18% 26.48% 26.23% 26.15% 29.32% 26.83% 25.96% 25.19% 26.44% 26.08% 26.25% 26.32% 26.35% 26.38% 26.42% 26.45% 26.47% 26.49% 26.51% Depreciation and Amortization 659.00 658.00 680.00 709.00 730.00 235.00 183.00 195.00 184.00 797.00 $805.88 $863.32 $920.11 $977.73 $1,036.24 $1,095.81 $1,155.53 $1,216.12 $1,276.20 % PP&E Beginning 19.60% 18.58% 18.58% 18.98% 18.79% 5.96% 4.63% 4.88% 4.49% 19.45% 19.67% 19.72% 19.77% 19.83% 19.88% 19.94% 19.98% 20.03% 20.07% Research and Development 565.00 571.00 616.00 636.00 686.00 173.00 194.00 184.00 189.00 740.00 725.79 761.00 802.81 843.12 879.55 915.73 951.73 988.99 1,024.00 % Revenue 5.61% 5.44% 5.59% 5.63% 5.91% 5.89% 6.38% 5.61% 6.05% 5.98% 5.67% 5.71% 5.79% 5.85% 5.88% 5.91% 5.94% 5.98% 6.01% Other Expense 72.00 3.00 51.00 33.00 59.00 10.00 8.00 8.00 17.00 43.00 38.40 39.98 41.60 43.24 44.88 46.48 48.07 49.61 51.12 % Revenue .72% .03% .46% .29% .51% .34% .26% .24% .54% .35% .30% .30% .30% .30% .30% .30% .30% .30% .30% Earnings Before Interest & Taxes $1,517.00 $2,033.00 $2,662.00 $2,132.00 $2,420.00 $530.00 $663.00 $781.00 $528.00 $2,502.00 $2,193.30 $2,283.30 $2,367.40 $2,443.77 $2,516.38 $2,595.00 $2,664.23 $2,726.61 $2,785.75 % Revenue 15.07% 19.36% 24.15% 18.86% 20.85% 18.05% 21.82% 23.82% 16.90% 20.21% 17.13% 17.13% 17.07% 16.96% 16.82% 16.75% 16.63% 16.49% 16.35% Interest Expense 141.00 156.00 163.00 222.00 214.00 55.00 60.00 53.00 64.00 232.00 256.01 259.89 249.58 252.22 254.29 255.66 256.36 256.34 255.58 % Revenue 1.40% 1.49% 1.48% 1.96% 1.84% 1.87% 1.97% 1.62% 2.05% 1.87% 2.00% 1.95% 1.80% 1.75% 1.70% 1.65% 1.60% 1.55% 1.50% Interest (Income) (33.00) (35.00) (43.00) (50.00) (40.00) (14.00) (10.00) (12.00) (10.00) (46.00) (44.80) (46.65) (48.53) (50.44) (52.35) (54.23) (56.08) (57.88) (59.63) % Revenue (.33%) (.33%) (.39%) (.44%) (.34%) (.48%) (.33%) (.37%) (.32%) (.37%) (.35%) (.35%) (.35%) (.35%) (.35%) (.35%) (.35%) (.35%) (.35%) Earnings Before Taxes 1,409.00 1,912.00 2,542.00 1,960.00 2,246.00 489.00 613.00 740.00 474.00 2,316.00 1,982.09 2,070.06 2,166.35 2,241.99 2,314.44 2,393.57 2,463.95 2,528.15 2,589.81 % Revenue 14.00% 18.21% 23.06% 17.34% 19.36% 16.65% 20.17% 22.57% 15.17% 18.71% 15.48% 15.53% 15.62% 15.56% 15.47% 15.45% 15.38% 15.29% 15.20% Less Taxes (Benefits) 464.00 577.00 543.00 489.00 390.00 122.00 106.00 123.00 98.00 449.00 436.06 454.58 474.86 490.32 505.24 521.56 535.66 548.36 560.18 TaxRate 32.93% 30.18% 21.36% 24.95% 17.36% 24.95% 17.29% 16.62% 20.68% 19.39% 22.00% 21.96% 21.92% 21.87% 21.83% 21.79% 21.74% 21.69% 21.63% Loss fromdiscontinued operations (342.00) (226.00) (23.00) (70.00) (359.00) - - - (93.72) (93.72) (128.01) (133.27) (138.66) (144.12) (149.58) (154.95) (160.22) (165.38) (170.38) % Revenue (3.40%) (2.15%) (.21%) (.62%) (3.09%) 0.00% 0.00% 0.00% (3.00%) (.76%) (1.00%) (1.00%) (1.00%) (1.00%) (1.00%) (1.00%) (1.00%) (1.00%) (1.00%) Net Income $1,287.00 $1,561.00 $2,022.00 $1,541.00 $2,215.00 $367.00 $507.00 $617.00 $469.72 $1,960.72 $1,674.04 $1,748.75 $1,830.14 $1,895.79 $1,958.78 $2,026.96 $2,088.51 $2,145.18 $2,200.01 Net Margin 12.79% 14.86% 18.34% 13.63% 19.09% 12.50% 16.68% 18.82% 15.04% 15.84% 13.08% 13.12% 13.20% 13.15% 13.09% 13.08% 13.03% 12.97% 12.91% Add Back: Depreciation and Amortization 659.00 658.00 680.00 709.00 730.00 235.00 183.00 195.00 184.00 797.00 805.88 863.32 920.11 977.73 1,036.24 1,095.81 1,155.53 1,216.12 1,276.20 Add Back: Interest Expense*(1-TaxRate) 94.57 108.92 128.18 166.61 176.84 41.28 49.62 44.19 50.77 187.02 199.69 202.81 194.87 197.06 198.78 199.95 200.63 200.74 200.29 Operating Cash Flow $2,040.57 $2,327.92 $2,830.18 $2,416.61 $3,121.84 $643.28 $739.62 $856.19 $704.49 $2,944.74 $2,679.60 $2,814.88 $2,945.13 $3,070.58 $3,193.80 $3,322.73 $3,444.66 $3,562.05 $3,676.50 % Revenue 20.27% 22.17% 25.68% 21.37% 26.90% 21.90% 24.34% 26.11% 22.55% 23.79% 20.93% 21.12% 21.24% 21.31% 21.35% 21.44% 21.50% 21.54% 21.58% Current Assets 5,017.00 4,812.00 4,989.00 5,121.00 5,318.00 5,584.00 5,685.00 5,802.00 5,803.77 5,803.77 5,770.51 6,037.35 6,306.04 6,580.68 6,825.52 7,125.97 7,389.56 7,640.70 7,893.87 % Revenue 49.84% 45.82% 45.26% 45.29% 45.83% 190.13% 187.07% 176.94% 185.78% 46.88% 45.08% 45.30% 45.48% 45.66% 45.63% 45.99% 46.12% 46.20% 46.33% Current Liabilities 2,486.00 2,425.00 2,442.00 2,911.00 2,722.00 3,069.00 3,090.00 3,288.00 2,719.13 2,719.13 2,598.52 2,721.47 2,846.59 2,968.95 3,099.38 3,225.98 3,351.90 3,479.66 3,607.02 % Revenue 24.70% 23.09% 22.15% 25.75% 23.46% 104.49% 101.68% 100.27% 87.04% 21.97% 20.30% 20.42% 20.53% 20.60% 20.72% 20.82% 20.92% 21.04% 21.17% Net Working Capital $2,531.00 $2,387.00 $2,547.00 $2,210.00 $2,596.00 $2,515.00 $2,595.00 $2,514.00 $3,084.64 $3,084.64 $3,171.99 $3,315.88 $3,459.45 $3,611.74 $3,726.14 $3,899.99 $4,037.66 $4,161.04 $4,286.85 % Revenue 25.14% 22.73% 23.11% 19.55% 22.37% 85.63% 85.39% 76.67% 98.74% 24.92% 24.78% 24.88% 24.95% 25.06% 24.91% 25.17% 25.20% 25.16% 25.16% Change in Working Capital $248.00 ($144.00) $160.00 ($337.00) $386.00 ($81.00) $80.00 ($81.00) $570.64 $488.64 $87.35 $143.89 $143.57 $152.29 $114.40 $173.86 $137.67 $123.38 $125.81 Capital Expenditures 704.00 665.00 653.00 596.00 677.00 117.00 134.00 149.00 274.00 674.00 692.51 725.02 758.44 795.56 833.18 869.25 906.87 942.68 979.71 % Revenue 6.99% 6.33% 5.92% 5.27% 5.83% 3.98% 4.41% 4.54% 8.77% 5.44% 5.41% 5.44% 5.47% 5.52% 5.57% 5.61% 5.66% 5.70% 5.75% Acquisitions 41.00 505.00 492.00 253.00 136.00 473.00 57.00 42.00 8.00 580.00 394.26 414.48 438.15 464.08 486.15 514.42 536.75 560.65 584.42 % Revenue .41% 4.81% 4.46% 2.24% 1.17% 16.10% 1.88% 1.28% .26% 4.69% 3.08% 3.11% 3.16% 3.22% 3.25% 3.32% 3.35% 3.39% 3.43% UnleveredFree Cash Flow $1,047.57 $1,301.92 $1,525.18 $1,904.61 $1,922.84 $134.28 $468.62 $746.19 ($148.15) $1,202.10 $1,505.48 $1,531.49 $1,604.96 $1,658.65 $1,760.07 $1,765.20 $1,863.37 $1,935.33 $1,986.58 DiscountedFree Cash Flow $1,421.05 $1,364.52 $1,349.78 $1,316.70 $1,318.85 $1,248.51 $1,244.03 $1,219.60 $1,181.68
  • 20. UOIG 20 December 5, 2014University of Oregon Investment Group Appendix 3—Revenue Model Combined Revenue Model Revenue Model Q1/Q2 Q2/Q3 Q3/Q4 Q4/Q1 ($ in millions) 2009A 2010A 2011A 2012A 2013A 12/31/2013A 03/31/2014A 06/30/2014A 09/30/2014E 2014E 2015E 2016E 2017E 2018E 2019E 2020E 2021E 2022E 2023E Becton, Dickinson and Co. 6986.00 7125.00 7583.00 7708.00 8054.00 2015.00 2071.00 2157.00 2202.00 8445.00 8798.38 9167.91 9551.26 9946.63 10344.43 10735.66 11121.80 11499.45 11865.37 % Growth 1.28% 1.99% 6.43% 1.65% 4.49% 6.05% 3.55% 5.07% 4.81% 4.85% 4.18% 4.20% 4.18% 4.14% 4.00% 3.78% 3.60% 3.40% 3.18% % of Total Revenue 69.40% 67.84% 68.79% 68.18% 69.41% 68.61% 68.15% 65.78% 70.49% 68.22% 68.73% 68.79% 68.88% 69.01% 69.15% 69.29% 69.41% 69.53% 69.64% CareFusion Corporation 3080.00 3377.00 3440.00 3598.00 3550.00 922.00 968.00 1122.00 922.00 3934.00 4002.22 4159.58 4314.26 4465.73 4613.97 4758.95 4900.66 5038.87 5172.98 % Growth .23% 9.64% 1.87% 4.59% (1.33%) 1.43% 7.44% 24.25% 11.08% 8.23% 4.17% 3.93% 3.72% 3.51% 3.32% 3.14% 2.98% 2.82% 2.66% % of Total Revenue 30.60% 32.16% 31.21% 31.82% 30.59% 31.39% 31.85% 34.22% 29.51% 31.78% 31.27% 31.21% 31.12% 30.99% 30.85% 30.71% 30.59% 30.47% 30.36% Total Revenue $10,066.00 $10,502.00 $11,023.00 $11,306.00 $11,604.00 $2,937.00 $3,039.00 $3,279.00 $3,124.00 $12,379.00 $12,800.59 $13,327.48 $13,865.51 $14,412.36 $14,958.39 $15,494.61 $16,022.46 $16,538.32 $17,038.35 % Growth .97% 4.33% 4.96% 2.57% 2.64% 4.56% 4.76% 10.93% 6.58% 6.68% 3.41% 4.12% 4.04% 3.94% 3.79% 3.58% 3.41% 3.22% 3.02% Becton, Dickinson and Co. Revenue Model Q1 Q2 Q3 Q4 ($ in millions) 2009A 2010A 2011A 2012A 2013A 12/31/2013A 03/31/2014A 06/30/2014A 09/30/2014E 2014E 2015E 2016E 2017E 2018E 2019E 2020E 2021E 2022E 2023E BD Medical 3556.00 3797.00 4007.00 4090.00 4306.00 1064.00 1116.00 1201.00 1193.00 4574.00 4767.90 4978.64 5206.44 5449.87 5699.50 5946.41 6193.50 6435.29 6671.46 % Growth 0.40% 6.75% 5.53% 2.07% 5.28% 8.24% 5.08% 5.35% 6.52% 6.22% 4.24% 4.42% 4.58% 4.68% 4.58% 4.33% 4.16% 3.90% 3.67% % of Total Revenue 50.90% 53.29% 52.84% 53.06% 53.46% 52.80% 53.89% 55.68% 54.18% 54.16% 54.19% 54.31% 54.51% 54.79% 55.10% 55.39% 55.69% 55.96% 56.23% BD Diagnostics 2226.00 2319.00 2480.00 2538.00 2646.00 672.00 653.00 679.00 708.00 2712.00 2827.79 2942.67 3055.34 3165.64 3273.61 3379.11 3480.94 3581.33 3677.72 % Growth 3.06% 4.18% 6.94% 2.34% 4.26% 3.07% (.91%) 3.66% 4.27% 2.49% 4.27% 4.06% 3.83% 3.61% 3.41% 3.22% 3.01% 2.88% 2.69% % of Total Revenue 31.86% 32.55% 32.70% 32.93% 32.85% 33.35% 31.53% 31.48% 32.15% 32.11% 32.14% 32.10% 31.99% 31.83% 31.65% 31.48% 31.30% 31.14% 31.00% BD Biosciences 1204.00 1009.00 1096.00 1080.00 1102.00 279.00 302.00 277.00 301.00 1159.00 1202.69 1246.59 1289.48 1331.13 1371.33 1410.13 1447.36 1482.82 1516.19 % Growth 0.75% (16.20%) 8.62% (1.46%) 2.04% 5.28% 8.24% 7.78% 8.66% 5.17% 3.77% 3.65% 3.44% 3.23% 3.02% 2.83% 2.64% 2.45% 2.25% % of Total Revenue 17.23% 14.16% 14.45% 14.01% 13.68% 13.85% 14.58% 12.84% 13.67% 13.72% 13.67% 13.60% 13.50% 13.38% 13.26% 13.14% 13.01% 12.89% 12.78% Total Revenue $6,986.00 $7,125.00 $7,583.00 $7,708.00 $8,054.00 $2,015.00 $2,071.00 $2,157.00 $2,202.00 $8,445.00 $8,798.38 $9,167.91 $9,551.26 $9,946.63 $10,344.43 $10,735.66 $11,121.80 $11,499.45 $11,865.37 % Growth 1.28% 1.99% 6.43% 1.65% 4.49% 6.05% 3.55% 5.07% 4.81% 4.85% 4.18% 4.20% 4.18% 4.14% 4.00% 3.78% 3.60% 3.40% 3.18% Revenue Model Q1 Q2 Q3 Q4 ($ in millions) 2009A 2010A 2011A 2012A 2013A 12/31/2013A 03/31/2014A 06/30/2014A 09/30/2014E 2014E 2015E 2016E 2017E 2018E 2019E 2020E 2021E 2022E 2023E BD Medical Medical Surgical Systems 1889.00 2010.00 2082.00 2105.00 2196.00 579.00 551.00 590.00 588.00 2308.00 2397.32 2493.69 2597.68 2707.30 2820.74 2932.16 3043.87 3151.93 3255.94 % Growth (5.79%) 6.41% 3.58% 1.10% 4.32% 8.02% 2.23% 5.17% 5.00% 5.10% 3.87% 4.02% 4.17% 4.22% 4.19% 3.95% 3.81% 3.55% 3.30% % of Segment Revenue 53.12% 52.94% 51.96% 51.47% 50.99% 54.42% 49.37% 49.13% 49.29% 50.46% 50.28% 50.09% 49.89% 49.68% 49.49% 49.31% 49.15% 48.98% 48.80% Diabetes Care 715.00 786.00 866.00 911.00 969.00 264.00 251.00 258.00 264.00 1037.00 1090.82 1149.40 1212.04 1278.94 1348.39 1418.24 1488.01 1556.61 1624.01 % Growth 3.03% 9.93% 10.18% 5.20% 6.37% 8.64% 8.19% 3.20% 8.20% 7.02% 5.19% 5.37% 5.45% 5.52% 5.43% 5.18% 4.92% 4.61% 4.33% % of Segment Revenue 20.11% 20.70% 21.61% 22.27% 22.50% 24.81% 22.49% 21.48% 22.13% 22.67% 22.88% 23.09% 23.28% 23.47% 23.66% 23.85% 24.03% 24.19% 24.34% Pharmaceutical Care 952.00 1001.00 1059.00 1074.00 1142.00 221.00 314.00 353.00 341.00 1229.00 1279.76 1335.56 1396.72 1463.63 1530.37 1596.02 1661.62 1726.75 1791.51 % Growth 1.06% 5.15% 5.79% 1.42% 6.33% 7.80% 7.90% 6.97% 7.91% 7.62% 4.13% 4.36% 4.58% 4.79% 4.56% 4.29% 4.11% 3.92% 3.75% % of Segment Revenue 26.77% 26.36% 26.43% 26.26% 26.51% 20.77% 28.14% 29.39% 28.58% 26.87% 26.84% 26.83% 26.83% 26.86% 26.85% 26.84% 26.83% 26.83% 26.85% Total Segment Revenue $3,556.00 $3,797.00 $4,007.00 $4,090.00 $4,307.00 $1,064.00 $1,116.00 $1,201.00 $1,193.00 $4,574.00 $4,767.90 $4,978.64 $5,206.44 $5,449.87 $5,699.50 $5,946.41 $6,193.50 $6,435.29 $6,671.46 % Growth 0.40% 6.78% 5.53% 2.07% 5.31% 8.24% 5.08% 5.35% 6.52% 6.20% 4.24% 4.42% 4.58% 4.68% 4.58% 4.33% 4.16% 3.90% 3.67% Revenue Model Q1 Q2 Q3 Q4 ($ in millions) 2009A 2010A 2011A 2012A 2013A 12/31/2013A 03/31/2014A 06/30/2014A 09/30/2014E 2014E 2015E 2016E 2017E 2018E 2019E 2020E 2021E 2022E 2023E BD Diagnostics Preanalytical Systems 1143.00 1198.00 1278.00 1301.00 1352.00 347.00 342.00 364.00 358.00 1411.00 1466.03 1520.86 1574.24 1626.03 1676.11 1725.23 1771.98 1817.52 1862.05 % Growth 1.69% 4.81% 6.68% 1.80% 3.92% 3.58% 3.64% 5.51% 4.68% 4.36% 3.90% 3.74% 3.51% 3.29% 3.08% 2.93% 2.71% 2.57% 2.45% % of Segment Revenue 51.35% 51.66% 51.51% 51.26% 51.10% 51.64% 52.37% 53.61% 50.56% 52.03% 51.84% 51.68% 51.52% 51.37% 51.20% 51.06% 50.91% 50.75% 50.63% Diagnostic Systems 1083.00 1121.00 1203.00 1237.00 1294.00 325.00 311.00 315.00 350.00 1301.00 1361.76 1421.81 1481.10 1539.60 1597.49 1653.88 1708.96 1763.82 1815.67 % Growth 4.54% 3.51% 7.31% 2.83% 4.61% 2.52% (5.47%) 1.61% 3.55% .54% 4.67% 4.41% 4.17% 3.95% 3.76% 3.53% 3.33% 3.21% 2.94% % of Segment Revenue 48.65% 48.34% 48.49% 48.74% 48.90% 48.36% 47.63% 46.39% 49.44% 47.97% 48.16% 48.32% 48.48% 48.63% 48.80% 48.94% 49.09% 49.25% 49.37% Total Segment Revenue $2,226.00 $2,319.00 $2,481.00 $2,538.00 $2,646.00 $672.00 $653.00 $679.00 $708.00 $2,712.00 $2,827.79 $2,942.67 $3,055.34 $3,165.64 $3,273.61 $3,379.11 $3,480.94 $3,581.33 $3,677.72 % Growth 3.06% 4.18% 6.99% 2.30% 4.26% 3.07% (.91%) 3.66% 4.27% 2.49% 4.27% 4.06% 3.83% 3.61% 3.41% 3.22% 3.01% 2.88% 2.69%
  • 21. UOIG 21 December 5, 2014University of Oregon Investment Group Revenue Model Q1 Q2 Q3 Q4 ($ in millions) 2009A 2010A 2011A 2012A 2013A 12/31/2013A 03/31/2014A 06/30/2014A 09/30/2014E 2014E 2015E 2016E 2017E 2018E 2019E 2020E 2021E 2022E 2023E BD Biosciences Bioscences 1204.00 1009.00 1096.00 1080.00 1102.00 279.00 302.00 277.00 301.00 1159.00 1202.69 1246.59 1289.48 1331.13 1371.33 1410.13 1447.36 1482.82 1516.19 % Growth 0.75% (16.20%) 8.62% (1.46%) 2.04% 5.28% 8.24% 7.78% .33% 5.17% 3.77% 3.65% 3.44% 3.23% 3.02% 2.83% 2.64% 2.45% 2.25% % of Segment Revenue 100.00% 100.00% 100.00% 100.00% 100.00% 100.00% 100.00% 100.00% 100.00% 100.00% 100% 100% 100% 100% 100% 100% 100% 100% 100% Total Segment Revenue $1,204.00 $1,009.00 $1,096.00 $1,080.00 $1,102.00 $279.00 $302.00 $277.00 $301.00 $1,159.00 $1,202.69 $1,246.59 $1,289.48 $1,331.13 $1,371.33 $1,410.13 $1,447.36 $1,482.82 $1,516.19 % Growth 0.75% (16.20%) 8.62% (1.46%) 2.04% 5.28% 8.24% 7.78% 8.66% 5.17% 3.77% 3.65% 3.44% 3.23% 3.02% 2.83% 2.64% 2.45% 2.25% CareFusion Corporation Revenue Model Q1 Q2 Q3 Q4 ($ in millions) 2009A 2010A 2011A 2012A 2013A 09/30/2013A 12/31/2013A 03/31/2014A 06/30/2014A 2014A 2015E 2016E 2017E 2018E 2019E 2020E 2021E 2022E 2023E Medical Systems 2034.00 2071.00 2214.00 2439.00 2329.00 524.00 587.00 571.00 712.00 2394.00 2463.43 2529.69 2592.93 2652.83 2709.34 2762.71 2812.99 2859.97 2903.44 % Growth 0% 1.82% 6.90% 10.16% (4.51%) (4.90%) (2.49%) (2.23%) 20.27% 2.79% 2.90% 2.69% 2.50% 2.31% 2.13% 1.97% 1.82% 1.67% 1.52% % of Total Revenue 66.04% 61.33% 64.36% 67.79% 65.61% 63.13% 63.67% 58.99% 63.46% 62.31% 61.55% 60.82% 60.10% 59.40% 58.72% 58.05% 57.40% 56.76% 56.13% Procedural Solutions 1046.00 1306.00 1226.00 1159.00 1221.00 306.00 335.00 397.00 410.00 1448.00 1538.79 1629.89 1721.32 1812.90 1904.63 1996.24 2087.67 2178.90 2269.54 % Growth 0.00% 24.86% (6.13%) (5.46%) 5.35% 6.99% 9.12% 25.24% 31.83% 18.59% 6.27% 5.92% 5.61% 5.32% 5.06% 4.81% 4.58% 4.37% 4.16% % of Total Revenue 33.96% 38.67% 35.64% 32.21% 34.39% 36.87% 36.33% 41.01% 36.54% 37.69% 38.45% 39.18% 39.90% 40.60% 41.28% 41.95% 42.60% 43.24% 43.87% Total Revenue $3,080.00 $3,377.00 $3,440.00 $3,598.00 $3,550.00 $830.00 $922.00 $968.00 $1,122.00 $3,842.00 $4,002.22 $4,159.58 $4,314.26 $4,465.73 $4,613.97 $4,758.95 $4,900.66 $5,038.87 $5,172.98 % Growth .23% 9.64% 1.87% 4.59% (1.33%) (.84%) 1.43% 7.44% 24.25% 8.23% 4.17% 3.93% 3.72% 3.51% 3.32% 3.14% 2.98% 2.82% 2.66% Appendix 3—Continued
  • 22. UOIG 22 December 5, 2014University of Oregon Investment Group Appendix 4 – Working Capital Model Working Capital Model Q1/Q2 Q2/Q3 Q3/Q4 Q4/Q1 ($ in millions) 2009A 2010A 2011A 2012A 2013A 12/31/2013A 03/31/2014A 06/30/2014A 09/30/2014E 2014E 2015E 2016E 2017E 2018E 2019E 2020E 2021E 2022E 2023E Total Revenue $10,066.00 $10,502.00 $11,023.00 $11,306.00 $11,604.00 $2,937.00 $3,039.00 $3,279.00 $3,124.00 $12,379.00 $12,800.59 $13,327.48 $13,865.51 $14,412.36 $14,958.39 $15,494.61 $16,022.46 $16,538.32 $17,038.35 Current Assets Accounts Receivable 1630.00 1598.00 1757.00 1691.00 1669.00 1564.00 1584.00 1778.00 1790.99 1790.99 1867.61 1959.14 2046.55 2137.35 2197.39 2316.44 2400.16 2482.40 2562.57 Days Sales Outstanding A/R 59.10 55.54 58.18 54.74 52.50 48.99 46.91 49.34 52.74 52.81 53.25 53.80 53.87 54.13 53.62 54.72 54.68 54.79 54.90 % of Revenue 16.19% 15.22% 15.94% 14.96% 14.38% 53.25% 52.12% 54.22% 57.33% 14.47% 14.59% 14.70% 14.76% 14.83% 14.69% 14.95% 14.98% 15.01% 15.04% Inventory 1583.00 1488.00 1605.00 1631.00 1786.00 1900.00 1972.00 1994.00 1933.44 1933.44 1871.45 1960.47 2045.16 2128.71 2212.35 2294.75 2376.13 2455.94 2533.60 Days Inventory Outstanding 127.92 121.89 142.09 123.34 151.36 145.55 147.65 141.21 128.90 139.25 120.32 122.19 122.78 123.28 123.67 124.55 124.58 124.92 125.23 % of Revenue 15.73% 14.17% 14.56% 14.43% 15.39% 64.69% 64.89% 60.81% 61.89% 15.62% 14.62% 14.71% 14.75% 14.77% 14.79% 14.81% 14.83% 14.85% 14.87% Deferred Taxes 398.00 427.00 656.00 540.00 653.00 682.00 711.00 678.00 688.53 688.53 633.63 659.71 693.28 727.82 762.88 797.97 833.17 859.99 894.51 Days Deferred Taxes Outstanding 53.10 56.04 82.82 66.86 70.06 79.62 81.10 74.69 76.69 77.83 68.83 68.83 69.26 69.87 70.46 71.26 71.70 71.65 72.28 % of Revenue 3.95% 4.07% 5.95% 4.78% 5.63% 23.22% 23.40% 20.68% 22.04% 5.56% 4.95% 4.95% 5.00% 5.05% 5.10% 5.15% 5.20% 5.20% 5.25% Other Assets 1406.00 1299.00 971.00 1259.00 1210.00 1438.00 1418.00 1352.00 1390.80 1390.80 1397.82 1458.03 1521.05 1586.80 1652.90 1716.80 1780.10 1842.37 1903.18 Days COGS Outstanding 113.61 106.40 85.96 95.21 102.54 110.15 106.17 95.74 92.72 100.17 89.87 90.88 91.31 91.90 92.40 93.18 93.33 93.71 94.07 % of Revenue 13.97% 12.37% 8.81% 11.14% 10.43% 48.96% 46.66% 41.23% 44.52% 11.24% 10.92% 10.94% 10.97% 11.01% 11.05% 11.08% 11.11% 11.14% 11.17% Total Current Assets $5,017.00 $4,812.00 $4,989.00 $5,121.00 $5,318.00 $5,584.00 $5,685.00 $5,802.00 $5,803.77 $5,803.77 $5,770.51 $6,037.35 $6,306.04 $6,580.68 $6,825.52 $7,125.97 $7,389.56 $7,640.70 $7,893.87 % of Revenue 49.84% 45.82% 45.26% 45.29% 45.83% 190.13% 187.07% 176.94% 185.78% 46.88% 45.08% 45.30% 45.48% 45.66% 45.63% 45.99% 46.12% 46.20% 46.33% Long Term Assets Net PP&E Beginning 3346.00 3362.00 3541.00 3660.00 3735.00 3885.00 3941.00 3954.00 3999.00 3885.00 4097.00 4359.77 4627.27 4891.86 5162.50 5428.83 5709.50 5997.13 6283.46 Capital Expenditures 704.00 665.00 653.00 596.00 677.00 117.00 134.00 149.00 274.00 674.00 692.51 725.02 758.44 795.56 833.18 869.25 906.87 942.68 979.71 % of Revenue 6.99% 6.33% 5.92% 5.27% 5.83% 3.98% 4.41% 4.54% 8.77% 5.44% 5.41% 5.44% 5.47% 5.52% 5.57% 5.61% 5.66% 5.70% 5.75% Acquisitions 41.00 505.00 492.00 253.00 136.00 473.00 57.00 42.00 8.00 580.00 394.26 414.48 438.15 464.08 486.15 514.42 536.75 560.65 584.42 % of Revenue 0.41% 4.81% 4.46% 2.24% 1.17% 16.10% 1.88% 1.28% 0.26% 4.69% 3.08% 3.11% 3.16% 3.22% 3.25% 3.32% 3.35% 3.39% 3.43% Depreciation and Amortization 659.00 658.00 680.00 709.00 730.00 235.00 183.00 195.00 184.00 797.00 824.00 872.00 932.00 989.00 1053.00 1103.00 1156.00 1217.00 1298.00 % PP&E Ending 19.60% 18.58% 18.58% 18.98% 18.79% 5.96% 4.63% 4.88% 4.49% 19.45% 18.90% 18.84% 19.05% 19.16% 19.40% 19.32% 19.28% 19.37% 19.82% Net PP&E Ending 3362.00 3541.00 3660.00 3735.00 3885.00 3941.00 3954.00 3999.00 4097.00 4097.00 4359.77 4627.27 4891.86 5162.50 5428.83 5709.50 5997.13 6283.46 6549.58 Total Current Assets & Net PP&E $8,379.00 $8,353.00 $8,649.00 $8,856.00 $9,203.00 $9,525.00 $9,639.00 $9,801.00 $9,900.77 $9,900.77 $10,130.28 $10,664.62 $11,197.90 $11,743.19 $12,254.35 $12,835.47 $13,386.69 $13,924.16 $14,443.45 % of Revenue 83.24% 79.54% 78.46% 78.33% 79.31% 324.31% 317.18% 298.90% 316.93% 79.98% 79.14% 80.02% 80.76% 81.48% 81.92% 82.84% 83.55% 84.19% 84.77% Current Liabilities Accounts Payable 364.00 488.00 502.00 526.00 480.00 1940.00 2013.00 2094.00 542.33 542.33 560.67 586.41 611.47 635.59 662.66 687.96 714.60 739.26 763.32 Days Payable Outstanding 29.41 39.97 44.44 39.78 40.68 148.61 150.72 148.29 36.16 39.06 36.05 36.55 36.71 36.81 37.04 37.34 37.47 37.60 37.73 % of Revenue 3.62% 4.65% 4.55% 4.65% 4.14% 66.05% 66.24% 63.86% 17.36% 4.38% 4.38% 4.40% 4.41% 4.41% 4.43% 4.44% 4.46% 4.47% 4.48% Accrued Charges 1081.00 1165.00 1149.00 1185.00 1459.00 468.00 418.00 535.00 1364.56 1364.56 1353.02 1411.38 1472.52 1534.92 1599.05 1661.02 1720.81 1782.83 1845.25 Days Charges Outstanding 144.21 152.90 145.07 146.72 156.54 54.64 47.68 58.94 151.99 154.25 146.97 147.26 147.11 147.36 147.69 148.34 148.10 148.54 149.11 % of Revenue 10.74% 11.09% 10.42% 10.48% 12.57% 15.93% 13.75% 16.32% 43.68% 11.02% 10.57% 10.59% 10.62% 10.65% 10.69% 10.72% 10.74% 10.78% 10.83% Income Taxes Payable 102.00 111.00 78.00 66.00 70.00 0.00 0.00 0.00 93.72 93.72 99.84 107.95 116.47 122.51 130.14 137.90 145.80 153.81 161.86 Days Taxes Outstanding 80.24 70.22 52.43 49.40 65.51 0.00 0.00 0.00 87.98 76.19 84.35 87.28 90.02 91.65 94.70 97.06 99.37 102.41 106.36 % of Revenue 1.01% 1.06% .71% .58% .60% 0.00% 0.00% 0.00% 3.00% .76% .78% .81% .84% .85% .87% .89% .91% .93% .95% Salaries, Wages and Related Items 406.00 454.00 477.00 478.00 504.00 0.00 0.00 0.00 532.30 532.30 538.90 563.75 589.28 616.85 644.71 670.92 700.18 729.34 754.80 % Revenue 4.03% 4.32% 4.33% 4.23% 4.34% 0.00% 0.00% 0.00% 17.04% 4.30% 4.21% 4.23% 4.25% 4.28% 4.31% 4.33% 4.37% 4.41% 4.43% Current Portion of Long TermDebt 533.00 207.00 236.00 656.00 209.00 661.00 659.00 659.00 718.52 718.52 584.99 615.73 646.13 675.94 707.53 739.09 770.68 803.76 836.58 % of Revenue 5.30% 1.97% 2.14% 5.80% 1.80% 22.51% 21.68% 20.10% 23.00% 5.80% 4.57% 4.62% 4.66% 4.69% 4.73% 4.77% 4.81% 4.86% 4.91% Total Current Liabilities $2,486.00 $2,425.00 $2,442.00 $2,911.00 $2,722.00 $3,069.00 $3,090.00 $3,288.00 $2,719.13 $2,719.13 $2,598.52 $2,721.47 $2,846.59 $2,968.95 $3,099.38 $3,225.98 $3,351.90 $3,479.66 $3,607.02 % of Revenue 24.70% 23.09% 22.15% 25.75% 23.46% 104.49% 101.68% 100.27% 87.04% 21.97% 20.30% 20.42% 20.53% 20.60% 20.72% 20.82% 20.92% 21.04% 21.17%
  • 23. UOIG 23 December 5, 2014University of Oregon Investment Group Appendix 5 – Discounted Cash Flows Valuation Assumptions DiscountedFree Cash FlowAssumptions Considerations TaxRate 21.63% Terminal Growth Rate 3.00% Risk Free Rate 2.18% Terminal Value 59,277 Avg. Industry Debt / Equity 70.55% Beta 0.94 PVof Terminal Value 33,768 Avg. Industry TaxRate 24.66% Market Risk Premium 5.75% Sumof PVFree Cash Flows 11,665 Current Reinvestment Rate 3.85% % Equity 64.58% FirmValue 45,433 Reinvestment Rate in Year 2019E 9.01% % Debt 35.42% Total Debt 15,064 Implied Return on Capital in Perpetuity 33.31% Cost of Debt 3.80% Cash & Cash Equivalents 4,380 Terminal Value as a % of Total 74.3% CAPM 7.57% Market Capitalization 30,369 Implied 2014E EBITDA Multiple 13.8x WACC 5.94% Fully Diluted Shares 192 Implied Multiple in Year 2023E 8.3x Terminal Risk Free Rate 2.97% Implied Price $158.17 Free Cash Flow Growth Rate in Year 2023E 3% Terminal CAPM 8.36% Current Price $141.06 Terminal WACC 6.45% Undervalued 12.13% 1564.12 Method: Price Objective Weighting DCF Analysis $158.17 60% Comparable Analysis $177.68 40% Price Target $165.97 Current Price $141.06 Undervalued 17.66% Final Price Target
  • 24. UOIG 24 December 5, 2014University of Oregon Investment Group Appendix 6 –Sensitivity Analysis ImpliedPrice Undervalued/(Overvalued) Terminal Growth Rate Terminal Growth Rate 158 2.0% 2.5% 3.0% 3.5% 4.0% 0 2.00% 2.50% 3.00% 3.50% 4.00% 0.74 156.30 183.96 221.79 276.65 363.39 0.74 10.80% 30.41% 57.23% 96.12% 157.61% 0.84 134.77 156.70 185.72 225.93 285.37 0.84 (4.46%) 11.09% 31.66% 60.17% 102.30% 0.94 116.83 134.54 157.38 187.92 230.85 0.94 (17.18%) (4.62%) 11.57% 33.22% 63.65% 1.04 101.64 116.18 134.52 158.36 190.60 1.04 (27.95%) (17.64%) (4.64%) 12.26% 35.12% 1.14 88.62 100.72 115.70 134.72 159.67 1.14 (37.18%) (28.60%) (17.98%) (4.50%) 13.19% ImpliedPrice Undervalued/(Overvalued) Terminal Growth Rate Terminal Growth Rate 158 1.50% 2.25% 3.00% 3.75% 4.50% 0 1.50% 2.25% 3.00% 3.75% 4.50% 0.04 109.1 131.7 164.1 214.6 303.8 0.04 (22.69%) (6.66%) 16.34% 52.11% 115.37% 0.05 106.0 128.6 161.0 211.5 300.7 0.05 (24.88%) (8.84%) 14.16% 49.92% 113.18% 0.06 103.1 125.7 158.1 208.6 297.8 0.06 (26.92%) (10.89%) 12.11% 47.88% 111.14% 0.07 100.4 123.0 155.5 205.9 295.1 0.07 (28.83%) (12.79%) 10.21% 45.97% 109.23% 0.08 97.9 120.5 152.9 203.4 292.6 0.08 (30.61%) (14.58%) 8.42% 44.19% 107.45% ImpliedPrice Undervalued/(Overvalued) Terminal Growth Rate Terminal Growth Rate 158 2.0% 2.5% 3.0% 3.5% 4.0% 12.13% 2.00% 2.50% 3.00% 3.50% 4.00% 1524.12 117.34 135.17 158.17 188.96 232.30 1524.12 (16.82%) (4.17%) 12.13% 33.96% 64.68% 1544.12 117.34 135.17 158.17 188.96 232.30 1544.12 (16.82%) (4.17%) 12.13% 33.96% 64.68% 1564.12 117.34 135.17 158.17 188.96 232.30 1564.12 (16.82%) (4.17%) 12.13% 33.96% 64.68% 1584.12 117.34 135.17 158.17 188.96 232.30 1584.12 (16.82%) (4.17%) 12.13% 33.96% 64.68% 1604.12 117.34 135.17 158.17 188.96 232.30 1604.12 (16.82%) (4.17%) 12.13% 33.96% 64.68% ImpliedPrice Undervalued/(Overvalued) Terminal Growth Rate Terminal Growth Rate 158 2.0% 2.5% 3.0% 3.5% 4.0% 0 2.0% 2.5% 3.0% 3.5% 4.0% 11.63% 111.52 128.09 149.28 177.34 216.24 11.63% (20.94%) (9.19%) 5.83% 25.72% 53.29% 16.63% 114.39 131.57 153.64 183.02 224.06 16.63% (18.91%) (6.73%) 8.92% 29.74% 58.84% 21.63% 117.34 135.17 158.17 188.96 232.30 21.63% (16.82%) (4.17%) 12.13% 33.96% 64.68% 26.63% 120.38 138.90 162.88 195.18 241.02 26.63% (14.66%) (1.53%) 15.47% 38.36% 70.86% 31.63% 123.52 142.75 167.78 201.69 250.24 31.63% (12.43%) 1.20% 18.94% 42.98% 77.40% ImpliedPrice Undervalued/(Overvalued) Terminal Growth Rate Terminal Growth Rate 158 2.0% 2.5% 3.0% 3.5% 4.0% 0 2.0% 2.5% 3.0% 3.5% 4.0% 1.80% 145.61 170.32 203.58 250.71 322.69 1.80% 3.22% 20.75% 44.32% 77.73% 128.76% 2.80% 130.54 151.43 178.90 216.64 271.74 2.80% (7.46%) 7.35% 26.82% 53.58% 92.64% 3.80% 117.35 135.18 158.19 188.98 232.33 3.80% (16.81%) (4.17%) 12.14% 33.97% 64.70% 4.80% 105.71 121.07 140.55 166.07 200.93 4.80% (25.06%) (14.17%) (.36%) 17.73% 42.44% 5.80% 95.36 108.70 125.37 146.78 175.32 5.80% (32.39%) (22.94%) (11.13%) 4.06% 24.29% TerminalYear Capexand Acquisitions TerminalYear Capexand Acquisitions CostofDebt CostofDebt TaxRate TaxRate AdjustedBeta AdjustedBeta WACC WACC
  • 25. UOIG 25 December 5, 2014University of Oregon Investment Group Appendix 8 – Sources Becton Dickinson 10-K Becton Dickinson Website BD Third Quarter Earnings Conference Call CareFusion First Quarter Earnings Conference Call CareFusion 10-K CareFusion Quarterly Reports CareFusion Website EPA Website FactSet Financial Visualizations Website Google Images IBIS World Wall Street Journal Yahoo Finance