SlideShare a Scribd company logo
1 of 1
Download to read offline
Age Group Column4 Column5 Column6 Column7
Age
Number Percent Males per
100 females Age Group
Asian Male White Male Asian Female White Female
Both sexes Male Female Both sexes Male Female 0,4 -5.9 -4.5 6.5 4.3
Total
population
64,403 31,490 32,913 100.0 100.0 100.0 95.7 5,9
-8.1 -5.4 8.6 5.4
Under 5
years
3,506 1,822 1,684 5.4 5.8 5.1 108.2 10,14
-8.1 -6 9.2 5.4
5 to 9 years 4,379 2,197 2,182 6.8 7.0 6.6 100.7 15,19 -5.9 -5.1 6.3 4.9
10 to 14
years
4,411 2,293 2,118 6.8 7.3 6.4 108.3 20,24
-2.9 -3.9 3.1 3.3
15 to 19
years
3,599 1,839 1,760 5.6 5.8 5.3 104.5 25,29
-5.2 -6.8 5.8 5.3
20 to 24
years
2,325 1,232 1,093 3.6 3.9 3.3 112.7 30,34
-6.5 -6 6.1 5
25 to 29
years
3,831 2,078 1,753 5.9 6.6 5.3 118.5 35,39
-10.2 -5.9 9.2 5.5
30 to 34
years
3,801 1,916 1,885 5.9 6.1 5.7 101.6 40,44
-11.4 -6.8 10.6 6.6
35 to 39
years
4,470 2,129 2,341 6.9 6.8 7.1 90.9 45,49
-11.2 -8.2 11.2 7.8
40 to 44
years
5,057 2,400 2,657 7.9 7.6 8.1 90.3 50,54
-6.8 -8.2 6.7 7.9
45 to 49
years
5,612 2,778 2,834 8.7 8.8 8.6 98.0 55,59
-4.6 -7.7 4.8 7.3
50 to 54
years
4,782 2,359 2,423 7.4 7.5 7.4 97.4 60,64
-3.2 -6.7 2.9 7
55 to 59
years
4,094 2,082 2,012 6.4 6.6 6.1 103.5 65,69
-2.5 -5.4 2.2 6
60 to 64
years
3,530 1,680 1,850 5.5 5.3 5.6 90.8 70,74
-2.4 -3.8 2 4.4
65 to 69
years
2,898 1,339 1,559 4.5 4.3 4.7 85.9 75,79
-2 -3.3 2 4
70 to 74
years
2,209 970 1,239 3.4 3.1 3.8 78.3 80,84
-1.4 -3 1.3 4
75 to 79
years
1,916 857 1,059 3.0 2.7 3.2 80.9 85,89
-1.1 -2.1 0.9 3.7
80 to 84
years
1,743 727 1,016 2.7 2.3 3.1 71.6 90+
-0.5 -1.1 0.5 2.2
85 to 89
years
1,432 512 920 2.2 1.6 2.8 55.7
90 years
and over
808 280 528 1.3 0.9 1.6 53.0
Under 18
years
15,079 7,721 7,358 23.4 24.5 22.4 104.9
18 to 64
years
38,318 19,084 19,234 59.5 60.6 58.4 99.2
18 to 24
years
3,141 1,662 1,479 4.9 5.3 4.5 112.4
25 to 44
years
17,159 8,523 8,636 26.6 27.1 26.2 98.7
25 to 34
years
7,632 3,994 3,638 11.9 12.7 11.1 109.8
35 to 44
years
9,527 4,529 4,998 14.8 14.4 15.2 90.6
45 to 64
years
18,018 8,899 9,119 28.0 28.3 27.7 97.6
45 to 54
years
10,394 5,137 5,257 16.1 16.3 16.0 97.7
55 to 64
years
7,624 3,762 3,862 11.8 11.9 11.7 97.4
65 years
and over
11,006 4,685 6,321 17.1 14.9 19.2 74.1
65 to 74
years
5,107 2,309 2,798 7.9 7.3 8.5 82.5
75 to 84
years
3,659 1,584 2,075 5.7 5.0 6.3 76.3
85 years
and over
2,240 792 1,448 3.5 2.5 4.4 54.7
16 years
and over
51,145 24,686 26,459 79.4 78.4 80.4 93.3
18 years
and over
49,324 23,769 25,555 76.6 75.5 77.6 93.0
21 years
and over
48,224 23,192 25,032 74.9 73.6 76.1 92.6
60 years
and over
14,536 6,365 8,171 22.6 20.2 24.8 77.9
62 years
and over
13,109 5,671 7,438 20.4 18.0 22.6 76.2
67 years
and over
9,806 4,098 5,708 15.2 13.0 17.3 71.8
75 years
and over
5,899 2,376 3,523 9.2 7.5 10.7 67.4
Median age
(years)
41.9 40.5 43.1 ( X ) ( X ) ( X ) ( X )
Source of Data:2010 Census Summary File 2
20 16 12 8 4 0 4 8 12 16 20
0,4
5,9
10,14
15,19
20,24
25,29
30,34
35,39
40,44
45,49
50,54
55,59
60,64
65,69
70,74
75,79
80,84
85,89
90+
Population (%)
Age
City of Palo Alto
Age Pyramid White Population 2010
Male Female
20 16 12 8 4 0 4 8 12 16 20
0,4
5,9
10,14
15,19
20,24
25,29
30,34
35,39
40,44
45,49
50,54
55,59
60,64
65,69
70,74
75,79
80,84,
85,89
90+
Population (%)
Age
City of Palo Alto
Age Pyramid Total Population 2010
Male Female
20 16 12 8 4 0 4 8 12 16 20
0,4
5,9
10,14
15,19
20,24
25,29
30,34
35,39
40,44
45,49
50,54
55,59
60,64
65,69
70,74
75,79
80,84
85,89
90+
Population (%)
Age
City of Palo Alto
Age Pyramid Asian Population 2010
Male Female
15 10 5 0 5 10 15
0-4
5,9
10,14
15-19
20-24
25-29
30-34
35-39
40-44
45-49
50-54
55-59
60-64
65-69
70-74
75-79
80-84
85-89
90+
Population (%)
Age
White and Asian Population 2010
Asian White
CITY OF PALO
ALTO
AGE AND SEX
PYRAMID FOR
WHITE AND ASIAN
POPULATION

More Related Content

Similar to Age Pyramids

Assignment # 1 Health Management
Assignment # 1 Health ManagementAssignment # 1 Health Management
Assignment # 1 Health ManagementNida Naeem
 
Calendario Lunar ecuador 2017
Calendario Lunar ecuador 2017Calendario Lunar ecuador 2017
Calendario Lunar ecuador 2017DIMAG GROUP
 
Statistics tables grubb's test
Statistics tables grubb's testStatistics tables grubb's test
Statistics tables grubb's testcamiloaquintero
 
93 crit valuetables_4th
93 crit valuetables_4th93 crit valuetables_4th
93 crit valuetables_4thAmish Soni
 
ISA Brown CS Cage Guide
ISA Brown CS Cage GuideISA Brown CS Cage Guide
ISA Brown CS Cage GuideSureSX
 
Datos x r xs 11x30 licmata
Datos x r xs 11x30 licmataDatos x r xs 11x30 licmata
Datos x r xs 11x30 licmataEdgar Mata
 
Datos x r xs 11x30 licmata-verano
Datos x r xs 11x30 licmata-veranoDatos x r xs 11x30 licmata-verano
Datos x r xs 11x30 licmata-veranoEdgar Mata
 
Case study solution (Office Bldg tab) H. Schwarz-Lopes & A. Santos
Case study solution (Office Bldg tab) H. Schwarz-Lopes & A. SantosCase study solution (Office Bldg tab) H. Schwarz-Lopes & A. Santos
Case study solution (Office Bldg tab) H. Schwarz-Lopes & A. SantosUCF Continuing Education
 
เฉลยข้อสอบO-net50
เฉลยข้อสอบO-net50เฉลยข้อสอบO-net50
เฉลยข้อสอบO-net50aom605
 
เฉลย 50
เฉลย 50เฉลย 50
เฉลย 50Pim Jazz
 
เฉลยข้อสอบวิชาสุขศึกษา ศิลปะ การงานอาชีพ ปี50
เฉลยข้อสอบวิชาสุขศึกษา ศิลปะ การงานอาชีพ ปี50เฉลยข้อสอบวิชาสุขศึกษา ศิลปะ การงานอาชีพ ปี50
เฉลยข้อสอบวิชาสุขศึกษา ศิลปะ การงานอาชีพ ปี50Casnovazfoy Froy
 

Similar to Age Pyramids (20)
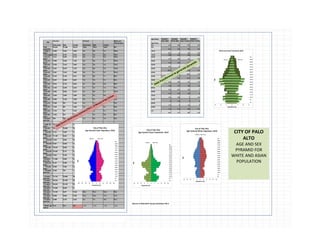
Boston housing
Boston housingBoston housing
Boston housing
 
Assignment # 1 Health Management
Assignment # 1 Health ManagementAssignment # 1 Health Management
Assignment # 1 Health Management
 
Calendario Lunar ecuador 2017
Calendario Lunar ecuador 2017Calendario Lunar ecuador 2017
Calendario Lunar ecuador 2017
 
Statistics tables grubb's test
Statistics tables grubb's testStatistics tables grubb's test
Statistics tables grubb's test
 
InfrormacióN DemográFica 09
InfrormacióN DemográFica 09InfrormacióN DemográFica 09
InfrormacióN DemográFica 09
 
93 crit valuetables_4th
93 crit valuetables_4th93 crit valuetables_4th
93 crit valuetables_4th
 
ISA Brown CS Cage Guide
ISA Brown CS Cage GuideISA Brown CS Cage Guide
ISA Brown CS Cage Guide
 
Datos x r xs 11x30 licmata
Datos x r xs 11x30 licmataDatos x r xs 11x30 licmata
Datos x r xs 11x30 licmata
 
Datos x r xs 11x30 licmata-verano
Datos x r xs 11x30 licmata-veranoDatos x r xs 11x30 licmata-verano
Datos x r xs 11x30 licmata-verano
 
Qsgender09q4
Qsgender09q4Qsgender09q4
Qsgender09q4
 
Qsgender09q4
Qsgender09q4Qsgender09q4
Qsgender09q4
 
Qsgender09q4
Qsgender09q4Qsgender09q4
Qsgender09q4
 
Case study solution (Office Bldg tab) H. Schwarz-Lopes & A. Santos
Case study solution (Office Bldg tab) H. Schwarz-Lopes & A. SantosCase study solution (Office Bldg tab) H. Schwarz-Lopes & A. Santos
Case study solution (Office Bldg tab) H. Schwarz-Lopes & A. Santos
 
เฉลยข้อสอบO-net50
เฉลยข้อสอบO-net50เฉลยข้อสอบO-net50
เฉลยข้อสอบO-net50
 
Withdrawl comparisons with age
Withdrawl comparisons with ageWithdrawl comparisons with age
Withdrawl comparisons with age
 
R4
R4R4
R4
 
เฉลย 50
เฉลย 50เฉลย 50
เฉลย 50
 
เฉลย 50
เฉลย 50เฉลย 50
เฉลย 50
 
เฉลยข้อสอบวิชาสุขศึกษา ศิลปะ การงานอาชีพ ปี50
เฉลยข้อสอบวิชาสุขศึกษา ศิลปะ การงานอาชีพ ปี50เฉลยข้อสอบวิชาสุขศึกษา ศิลปะ การงานอาชีพ ปี50
เฉลยข้อสอบวิชาสุขศึกษา ศิลปะ การงานอาชีพ ปี50
 
เฉลย50
เฉลย50เฉลย50
เฉลย50
 

Age Pyramids

  • 1. Age Group Column4 Column5 Column6 Column7 Age Number Percent Males per 100 females Age Group Asian Male White Male Asian Female White Female Both sexes Male Female Both sexes Male Female 0,4 -5.9 -4.5 6.5 4.3 Total population 64,403 31,490 32,913 100.0 100.0 100.0 95.7 5,9 -8.1 -5.4 8.6 5.4 Under 5 years 3,506 1,822 1,684 5.4 5.8 5.1 108.2 10,14 -8.1 -6 9.2 5.4 5 to 9 years 4,379 2,197 2,182 6.8 7.0 6.6 100.7 15,19 -5.9 -5.1 6.3 4.9 10 to 14 years 4,411 2,293 2,118 6.8 7.3 6.4 108.3 20,24 -2.9 -3.9 3.1 3.3 15 to 19 years 3,599 1,839 1,760 5.6 5.8 5.3 104.5 25,29 -5.2 -6.8 5.8 5.3 20 to 24 years 2,325 1,232 1,093 3.6 3.9 3.3 112.7 30,34 -6.5 -6 6.1 5 25 to 29 years 3,831 2,078 1,753 5.9 6.6 5.3 118.5 35,39 -10.2 -5.9 9.2 5.5 30 to 34 years 3,801 1,916 1,885 5.9 6.1 5.7 101.6 40,44 -11.4 -6.8 10.6 6.6 35 to 39 years 4,470 2,129 2,341 6.9 6.8 7.1 90.9 45,49 -11.2 -8.2 11.2 7.8 40 to 44 years 5,057 2,400 2,657 7.9 7.6 8.1 90.3 50,54 -6.8 -8.2 6.7 7.9 45 to 49 years 5,612 2,778 2,834 8.7 8.8 8.6 98.0 55,59 -4.6 -7.7 4.8 7.3 50 to 54 years 4,782 2,359 2,423 7.4 7.5 7.4 97.4 60,64 -3.2 -6.7 2.9 7 55 to 59 years 4,094 2,082 2,012 6.4 6.6 6.1 103.5 65,69 -2.5 -5.4 2.2 6 60 to 64 years 3,530 1,680 1,850 5.5 5.3 5.6 90.8 70,74 -2.4 -3.8 2 4.4 65 to 69 years 2,898 1,339 1,559 4.5 4.3 4.7 85.9 75,79 -2 -3.3 2 4 70 to 74 years 2,209 970 1,239 3.4 3.1 3.8 78.3 80,84 -1.4 -3 1.3 4 75 to 79 years 1,916 857 1,059 3.0 2.7 3.2 80.9 85,89 -1.1 -2.1 0.9 3.7 80 to 84 years 1,743 727 1,016 2.7 2.3 3.1 71.6 90+ -0.5 -1.1 0.5 2.2 85 to 89 years 1,432 512 920 2.2 1.6 2.8 55.7 90 years and over 808 280 528 1.3 0.9 1.6 53.0 Under 18 years 15,079 7,721 7,358 23.4 24.5 22.4 104.9 18 to 64 years 38,318 19,084 19,234 59.5 60.6 58.4 99.2 18 to 24 years 3,141 1,662 1,479 4.9 5.3 4.5 112.4 25 to 44 years 17,159 8,523 8,636 26.6 27.1 26.2 98.7 25 to 34 years 7,632 3,994 3,638 11.9 12.7 11.1 109.8 35 to 44 years 9,527 4,529 4,998 14.8 14.4 15.2 90.6 45 to 64 years 18,018 8,899 9,119 28.0 28.3 27.7 97.6 45 to 54 years 10,394 5,137 5,257 16.1 16.3 16.0 97.7 55 to 64 years 7,624 3,762 3,862 11.8 11.9 11.7 97.4 65 years and over 11,006 4,685 6,321 17.1 14.9 19.2 74.1 65 to 74 years 5,107 2,309 2,798 7.9 7.3 8.5 82.5 75 to 84 years 3,659 1,584 2,075 5.7 5.0 6.3 76.3 85 years and over 2,240 792 1,448 3.5 2.5 4.4 54.7 16 years and over 51,145 24,686 26,459 79.4 78.4 80.4 93.3 18 years and over 49,324 23,769 25,555 76.6 75.5 77.6 93.0 21 years and over 48,224 23,192 25,032 74.9 73.6 76.1 92.6 60 years and over 14,536 6,365 8,171 22.6 20.2 24.8 77.9 62 years and over 13,109 5,671 7,438 20.4 18.0 22.6 76.2 67 years and over 9,806 4,098 5,708 15.2 13.0 17.3 71.8 75 years and over 5,899 2,376 3,523 9.2 7.5 10.7 67.4 Median age (years) 41.9 40.5 43.1 ( X ) ( X ) ( X ) ( X ) Source of Data:2010 Census Summary File 2 20 16 12 8 4 0 4 8 12 16 20 0,4 5,9 10,14 15,19 20,24 25,29 30,34 35,39 40,44 45,49 50,54 55,59 60,64 65,69 70,74 75,79 80,84 85,89 90+ Population (%) Age City of Palo Alto Age Pyramid White Population 2010 Male Female 20 16 12 8 4 0 4 8 12 16 20 0,4 5,9 10,14 15,19 20,24 25,29 30,34 35,39 40,44 45,49 50,54 55,59 60,64 65,69 70,74 75,79 80,84, 85,89 90+ Population (%) Age City of Palo Alto Age Pyramid Total Population 2010 Male Female 20 16 12 8 4 0 4 8 12 16 20 0,4 5,9 10,14 15,19 20,24 25,29 30,34 35,39 40,44 45,49 50,54 55,59 60,64 65,69 70,74 75,79 80,84 85,89 90+ Population (%) Age City of Palo Alto Age Pyramid Asian Population 2010 Male Female 15 10 5 0 5 10 15 0-4 5,9 10,14 15-19 20-24 25-29 30-34 35-39 40-44 45-49 50-54 55-59 60-64 65-69 70-74 75-79 80-84 85-89 90+ Population (%) Age White and Asian Population 2010 Asian White CITY OF PALO ALTO AGE AND SEX PYRAMID FOR WHITE AND ASIAN POPULATION