SlideShare a Scribd company logo
1 of 6
Download to read offline
Impact of Foreclosures on
Single-Family Home Sales
in Jefferson County 2007-2009
07/27/2010 1
3
9
8
2
7
5
4
6
1
12
47
61
86
110
200
267
284
574
22
78
57
93
149
189
235
274
654
27
74
75
123
202
247
307
362
607
2007 2008 2009
Number of Foreclosures in
Each Residential Area
by Year
07/27/2010 2
Source: 2007 Tax Rolls
39%
30%
22%
28%
27%
23%
21%
23%
18%
1
2
3
4
5
6
7
8
9
Percent of Assessed Value Lost
Due to Foreclosure
Impact of Foreclosures on Single-Family Home Sales
in Jefferson County 2007
PVA
Residential
Area
Number of
Foreclosed
Homes
Total Assessed
Value of
Foreclosed
Homes
Average Assessed
Value of
Foreclosed
Homes
Total Sales
of
Foreclosed
Homes
Average
Sale of
Foreclosed
Homes
Difference
Between Sale
Price and
Assessed Value
Difference as
Percent of
Total Assessed
Value
Average Loss
on Sale of
Foreclosed
Home
1 574 $39,726,120 $66,335 $24,047,319 $40,000 $15,678,801 39% -40%
2 86 $7,883,940 $78,235 $5,539,835 $53,368 $2,344,105 30% -32%
3 12 $3,380,470 $164,725 $2,622,782 $139,391 $757,688 22% -15%
4 267 $27,191,590 $98,950 $19,651,414 $71,000 $7,540,176 28% -28%
5 200 $21,011,700 $94,060 $15,393,386 $70,050 $5,618,314 27% -26%
6 284 $32,821,020 $106,880 $25,280,998 $82,225 $7,540,022 23% -23%
7 110 $18,815,540 $146,705 $14,919,359 $121,629 $3,896,181 21% -17%
8 61 $17,841,180 $240,260 $13,780,957 $202,000 $4,060,223 23% -16%
9 47 $8,362,920 $151,050 $6,849,546 $120,000 $1,513,374 18% -21%
07/27/2010 3
Source: 2008 Tax Rolls
Impact of Foreclosures on Single-Family Home Sales
in Jefferson County 2008
PVA
Residential
Area
Number of
Foreclosed
Homes
Total Assessed
Value of
Foreclosed
Homes
Average
Assessed Value
of Foreclosed
Homes
Total Sales
of
Foreclosed
Homes
Average
Sale of
Foreclosed
Homes
Difference
Between Sale
Price and
Assessed Value
Difference as
Percent of
Total Assessed
Value
Average Loss
on Sale of
Foreclosed
Home
1 654 $43,812,180 $63,000 $24,761,083 $35,000 $19,051,096 42% -44%
2 93 $9,279,520 $81,520 $6,212,140 $50,100 $3,067,381 36% -39%
3 22 $4,736,820 $155,290 $3,892,634 $136,500 $844,186 24% -12%
4 235 $24,214,540 $99,500 $15,494,551 $64,000 $8,719,989 36% -36%
5 189 $19,677,510 $97,600 $13,250,323 $65,000 $6,427,187 34% -33%
6 274 $33,323,110 $114,400 $23,433,335 $78,884 $9,889,775 30% -31%
7 149 $26,511,010 $148,720 $19,215,930 $110,000 $7,295,079 26% -26%
8 57 $16,960,850 $223,600 $12,737,831 $184,500 $4,223,019 23% -17%
9 78 $16,330,920 $184,465 $11,718,729 $139,000 $4,612,191 25% -25%
42%
36%
24%
36%
34%
30%
26%
23%
25%
1
2
3
4
5
6
7
8
9
Percent of Assessed Value Lost
Due to Foreclosure
07/27/2010 4
Source: 2009 Tax Rolls
Impact of Foreclosures on Single-Family Home Sales
in Jefferson County 2009
PVA
Residential
Area
Number of
Foreclosed
Homes
Total Assessed
Value of
Foreclosed
Homes
Average
Assessed Value
of Foreclosed
Homes
Total Sales
of
Foreclosed
Homes
Average
Sale of
Foreclosed
Homes
Difference
Between Sale
Price and
Assessed Value
Difference as
Percent of
Total Assessed
Value
Average Loss on
Sale of
Foreclosed
Home
1 607 $36,116,250 $53,300 $21,473,071 $30,000 $14,643,179 40% -44%
2 123 $13,314,300 $85,920 $9,060,980 $58,500 $4,253,320 34% -32%
3 27 $4,306,460 $165,540 $3,257,296 $140,000 $1,049,164 24% -15%
4 307 $32,629,010 $101,770 $19,735,925 $63,750 $12,893,085 39% -37%
5 247 $26,313,030 $94,490 $16,717,260 $60,000 $9,595,770 37% -37%
6 362 $45,501,440 $118,095 $28,710,546 $75,000 $16,790,894 37% -36%
7 202 $33,247,190 $144,500 $22,108,137 $100,000 $11,139,053 33% -31%
8 75 $19,379,440 $215,000 $13,332,758 $152,000 $6,046,682 31% -29%
9 74 $13,886,130 $158,525 $9,807,329 $114,875 $4,078,802 31% -28%
40%
34%
24%
39%
37%
37%
33%
31%
31%
1
2
3
4
5
6
7
8
9
Percent of Assessed Value Lost
Due to Foreclosure
07/27/2010 5
Notes:
• Data sources for this report include the 2007, 2008, and 2009 Tax Rolls; the Master Commissioner lists of foreclosure sales
for 2007, 2008 and 2009; PVA Residential Zones; and the current REMF Parcel database.
• The Tax Rolls were used to get the correct assessment value prior to foreclosure sale.
• The Master Commissioner’s lists of foreclosure sales were used to get the value at time of sale.
• The parcels were used to link the addresses and locate them in the correct PVA Residential zones.
• Next steps…
• To acquire the 2007, 2008 and 2009 “L” “V” sales and add that to the existing tables.
07/27/2010 6

More Related Content

More from Margaret Maginnis

Pptx 2010 2nd churchill neighborhood analysis
Pptx 2010 2nd churchill neighborhood analysisPptx 2010 2nd churchill neighborhood analysis
Pptx 2010 2nd churchill neighborhood analysisMargaret Maginnis
 
2010 06-03 pilot study 1950s with-basements
2010 06-03 pilot study 1950s with-basements2010 06-03 pilot study 1950s with-basements
2010 06-03 pilot study 1950s with-basementsMargaret Maginnis
 
2010 06-03 pilot study 1950s with-basements
2010 06-03 pilot study 1950s with-basements2010 06-03 pilot study 1950s with-basements
2010 06-03 pilot study 1950s with-basementsMargaret Maginnis
 
2005 Report for the Louisville Water Co
2005 Report for the Louisville Water Co2005 Report for the Louisville Water Co
2005 Report for the Louisville Water CoMargaret Maginnis
 
2010-03-01 Park DuValle Health Center Analysis 2008
2010-03-01 Park DuValle Health Center Analysis 20082010-03-01 Park DuValle Health Center Analysis 2008
2010-03-01 Park DuValle Health Center Analysis 2008Margaret Maginnis
 
The Causes of Declining Residential Water Usage
The Causes of Declining Residential Water UsageThe Causes of Declining Residential Water Usage
The Causes of Declining Residential Water UsageMargaret Maginnis
 
2010 Pilot Study Regression Analysis of 1950s Housing Stock
2010 Pilot Study Regression Analysis of 1950s Housing Stock2010 Pilot Study Regression Analysis of 1950s Housing Stock
2010 Pilot Study Regression Analysis of 1950s Housing StockMargaret Maginnis
 
Fc vacancies escheatmts_in jeff_co
Fc vacancies escheatmts_in jeff_coFc vacancies escheatmts_in jeff_co
Fc vacancies escheatmts_in jeff_coMargaret Maginnis
 
2009 Wheatley Elementary Maps-Clustering Analysis Grades 2 and 3
2009 Wheatley Elementary Maps-Clustering Analysis Grades 2 and 32009 Wheatley Elementary Maps-Clustering Analysis Grades 2 and 3
2009 Wheatley Elementary Maps-Clustering Analysis Grades 2 and 3Margaret Maginnis
 
Churchill Neighborhood Analysis
Churchill Neighborhood AnalysisChurchill Neighborhood Analysis
Churchill Neighborhood AnalysisMargaret Maginnis
 
Louisville's Health-Related Economy 06
Louisville's Health-Related Economy 06Louisville's Health-Related Economy 06
Louisville's Health-Related Economy 06Margaret Maginnis
 

More from Margaret Maginnis (11)

Pptx 2010 2nd churchill neighborhood analysis
Pptx 2010 2nd churchill neighborhood analysisPptx 2010 2nd churchill neighborhood analysis
Pptx 2010 2nd churchill neighborhood analysis
 
2010 06-03 pilot study 1950s with-basements
2010 06-03 pilot study 1950s with-basements2010 06-03 pilot study 1950s with-basements
2010 06-03 pilot study 1950s with-basements
 
2010 06-03 pilot study 1950s with-basements
2010 06-03 pilot study 1950s with-basements2010 06-03 pilot study 1950s with-basements
2010 06-03 pilot study 1950s with-basements
 
2005 Report for the Louisville Water Co
2005 Report for the Louisville Water Co2005 Report for the Louisville Water Co
2005 Report for the Louisville Water Co
 
2010-03-01 Park DuValle Health Center Analysis 2008
2010-03-01 Park DuValle Health Center Analysis 20082010-03-01 Park DuValle Health Center Analysis 2008
2010-03-01 Park DuValle Health Center Analysis 2008
 
The Causes of Declining Residential Water Usage
The Causes of Declining Residential Water UsageThe Causes of Declining Residential Water Usage
The Causes of Declining Residential Water Usage
 
2010 Pilot Study Regression Analysis of 1950s Housing Stock
2010 Pilot Study Regression Analysis of 1950s Housing Stock2010 Pilot Study Regression Analysis of 1950s Housing Stock
2010 Pilot Study Regression Analysis of 1950s Housing Stock
 
Fc vacancies escheatmts_in jeff_co
Fc vacancies escheatmts_in jeff_coFc vacancies escheatmts_in jeff_co
Fc vacancies escheatmts_in jeff_co
 
2009 Wheatley Elementary Maps-Clustering Analysis Grades 2 and 3
2009 Wheatley Elementary Maps-Clustering Analysis Grades 2 and 32009 Wheatley Elementary Maps-Clustering Analysis Grades 2 and 3
2009 Wheatley Elementary Maps-Clustering Analysis Grades 2 and 3
 
Churchill Neighborhood Analysis
Churchill Neighborhood AnalysisChurchill Neighborhood Analysis
Churchill Neighborhood Analysis
 
Louisville's Health-Related Economy 06
Louisville's Health-Related Economy 06Louisville's Health-Related Economy 06
Louisville's Health-Related Economy 06
 

2010-07-26 Impact of Foreclosures on Residential Single Family Homes

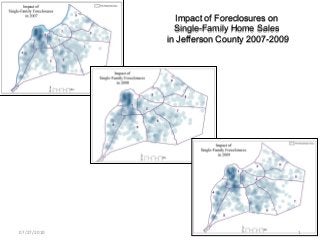
  • 1. Impact of Foreclosures on Single-Family Home Sales in Jefferson County 2007-2009 07/27/2010 1
  • 3. Source: 2007 Tax Rolls 39% 30% 22% 28% 27% 23% 21% 23% 18% 1 2 3 4 5 6 7 8 9 Percent of Assessed Value Lost Due to Foreclosure Impact of Foreclosures on Single-Family Home Sales in Jefferson County 2007 PVA Residential Area Number of Foreclosed Homes Total Assessed Value of Foreclosed Homes Average Assessed Value of Foreclosed Homes Total Sales of Foreclosed Homes Average Sale of Foreclosed Homes Difference Between Sale Price and Assessed Value Difference as Percent of Total Assessed Value Average Loss on Sale of Foreclosed Home 1 574 $39,726,120 $66,335 $24,047,319 $40,000 $15,678,801 39% -40% 2 86 $7,883,940 $78,235 $5,539,835 $53,368 $2,344,105 30% -32% 3 12 $3,380,470 $164,725 $2,622,782 $139,391 $757,688 22% -15% 4 267 $27,191,590 $98,950 $19,651,414 $71,000 $7,540,176 28% -28% 5 200 $21,011,700 $94,060 $15,393,386 $70,050 $5,618,314 27% -26% 6 284 $32,821,020 $106,880 $25,280,998 $82,225 $7,540,022 23% -23% 7 110 $18,815,540 $146,705 $14,919,359 $121,629 $3,896,181 21% -17% 8 61 $17,841,180 $240,260 $13,780,957 $202,000 $4,060,223 23% -16% 9 47 $8,362,920 $151,050 $6,849,546 $120,000 $1,513,374 18% -21% 07/27/2010 3
  • 4. Source: 2008 Tax Rolls Impact of Foreclosures on Single-Family Home Sales in Jefferson County 2008 PVA Residential Area Number of Foreclosed Homes Total Assessed Value of Foreclosed Homes Average Assessed Value of Foreclosed Homes Total Sales of Foreclosed Homes Average Sale of Foreclosed Homes Difference Between Sale Price and Assessed Value Difference as Percent of Total Assessed Value Average Loss on Sale of Foreclosed Home 1 654 $43,812,180 $63,000 $24,761,083 $35,000 $19,051,096 42% -44% 2 93 $9,279,520 $81,520 $6,212,140 $50,100 $3,067,381 36% -39% 3 22 $4,736,820 $155,290 $3,892,634 $136,500 $844,186 24% -12% 4 235 $24,214,540 $99,500 $15,494,551 $64,000 $8,719,989 36% -36% 5 189 $19,677,510 $97,600 $13,250,323 $65,000 $6,427,187 34% -33% 6 274 $33,323,110 $114,400 $23,433,335 $78,884 $9,889,775 30% -31% 7 149 $26,511,010 $148,720 $19,215,930 $110,000 $7,295,079 26% -26% 8 57 $16,960,850 $223,600 $12,737,831 $184,500 $4,223,019 23% -17% 9 78 $16,330,920 $184,465 $11,718,729 $139,000 $4,612,191 25% -25% 42% 36% 24% 36% 34% 30% 26% 23% 25% 1 2 3 4 5 6 7 8 9 Percent of Assessed Value Lost Due to Foreclosure 07/27/2010 4
  • 5. Source: 2009 Tax Rolls Impact of Foreclosures on Single-Family Home Sales in Jefferson County 2009 PVA Residential Area Number of Foreclosed Homes Total Assessed Value of Foreclosed Homes Average Assessed Value of Foreclosed Homes Total Sales of Foreclosed Homes Average Sale of Foreclosed Homes Difference Between Sale Price and Assessed Value Difference as Percent of Total Assessed Value Average Loss on Sale of Foreclosed Home 1 607 $36,116,250 $53,300 $21,473,071 $30,000 $14,643,179 40% -44% 2 123 $13,314,300 $85,920 $9,060,980 $58,500 $4,253,320 34% -32% 3 27 $4,306,460 $165,540 $3,257,296 $140,000 $1,049,164 24% -15% 4 307 $32,629,010 $101,770 $19,735,925 $63,750 $12,893,085 39% -37% 5 247 $26,313,030 $94,490 $16,717,260 $60,000 $9,595,770 37% -37% 6 362 $45,501,440 $118,095 $28,710,546 $75,000 $16,790,894 37% -36% 7 202 $33,247,190 $144,500 $22,108,137 $100,000 $11,139,053 33% -31% 8 75 $19,379,440 $215,000 $13,332,758 $152,000 $6,046,682 31% -29% 9 74 $13,886,130 $158,525 $9,807,329 $114,875 $4,078,802 31% -28% 40% 34% 24% 39% 37% 37% 33% 31% 31% 1 2 3 4 5 6 7 8 9 Percent of Assessed Value Lost Due to Foreclosure 07/27/2010 5
  • 6. Notes: • Data sources for this report include the 2007, 2008, and 2009 Tax Rolls; the Master Commissioner lists of foreclosure sales for 2007, 2008 and 2009; PVA Residential Zones; and the current REMF Parcel database. • The Tax Rolls were used to get the correct assessment value prior to foreclosure sale. • The Master Commissioner’s lists of foreclosure sales were used to get the value at time of sale. • The parcels were used to link the addresses and locate them in the correct PVA Residential zones. • Next steps… • To acquire the 2007, 2008 and 2009 “L” “V” sales and add that to the existing tables. 07/27/2010 6