SlideShare a Scribd company logo
1 of 114
Download to read offline
1
If I Get Married Will I Become a Republican?:
The Impact of Age, Gender, and Marital Status on Party Identification, Policy
Preference, and Voting Behavior
Draft Version of April 30, 2015
An Honors Thesis for the Department of Political Science
Magdelena Morrow
Tufts University, 2015
2
Abstract
If I Get Married Will I Become a Republican?:
The Impact of Age, Gender, and Marital Status on Party Identification, Policy Preference,
and Voting Behavior
Magdelena Morrow, Department of Political Science, Class of 2015
Thesis Committee: Professor Richard Eichenberg, Professor Jeffrey Berry
This thesis examines the impacts of age, gender, and marital status on an individual’s
party identification, policy preferences, and political participation. Focusing on the
trends in preferences, behaviors, and lifestyles of young and middle-aged unmarried
women as compared to other demographic groups, I offer insight into how marital status,
age, and gender impact an individual’s political identity. Through quantitative analysis, I
confirm that each of these factors—age, gender, and marital status—deeply impact an
individual’s party identification, policy preferences, and political participation. I also
identify the importance of the lifestyle changes of women beginning in the late 1970s and
early 1980s related to older median age of marriage, higher first-birth rates for women
over 35, and increased labor force participation of mothers. Finally, I argue that, due to
these lifestyle changes, it will be increasingly important to finely study the factors that
impact young and middle-aged women’s preferences to reach one of the fastest-growing
voting blocs in the nation.
3
Table of Contents
Tables and Figures ....................................................................................................5
Chapter 1: Introduction: The Importance of Age, Gender, and Marital Status in
American Campaigns ................................................................................................7
Chapter 2: Age, Gender, and Marital Status in Public Opinion: Separating
Evidence from Stereotypes ......................................................................................12
Gender: Party Identification, Policy Preference, and Political Participation........................................13
Marital Status: Party Identification, Policy Preferences, and Political Participation.........................19
Age: Party Identification, Policy Preferences, and Political Participation............................................25
Conclusions...............................................................................................................................................................27
Chapter 3: Research Design ....................................................................................29
Data Source ...............................................................................................................................................................29
Coding Age, Gender, and Marital Status.........................................................................................................31
Dependent Variable 1: Party Identification.....................................................................................................33
Dependent Variable 2: Policy Preference........................................................................................................34
Dependent Variable 3: Voting Behavior..........................................................................................................34
Chapter 4: The Impact of Age, Gender, and Marital Status on Party Identification
.................................................................................................................................37
The Changing Lives of American Women......................................................................................................37
Increasing Birthrates for Women Over 35.......................................................................................................38
Mothers’ Labor Force Participation..................................................................................................................40
Summary: The Lives of American Women........................................................................................................41
Recoding Age ...........................................................................................................................................................42
Changing Partisanship of American Women..................................................................................................46
Changing Partisanship of American Men........................................................................................................49
Tracing Trends in Party of Presidential Vote 1952-2012...........................................................................53
A Word On Race .....................................................................................................................................................57
Conclusion.................................................................................................................................................................60
Chapter 5: Exploring the Impact of Age, Gender, and Marital Status on Policy
Preferences ..............................................................................................................62
Federal Spending on Childcare...........................................................................................................................63
Government Spending and Services..................................................................................................................73
Abortion......................................................................................................................................................................82
Conclusion.................................................................................................................................................................85
Chapter 6: The Impact of Age, Gender, and Marital Status on Voter Turnout and
Political Participation Beyond Voting......................................................................88
Voter Turnout ...........................................................................................................................................................89
Conclusions ...................................................................................................................................................................94
Political Participation Beyond Voting ..............................................................................................................97
Conclusions............................................................................................................................................................ 101
Chapter 7: Conclusions .........................................................................................103
Summary of Findings.......................................................................................................................................... 103
Implications for Political Campaigns and Candidates.............................................................................. 106
Suggestions for Future Research..................................................................................................................... 107
4
Appendix A: ANES Time series Cumulative Data File Variables Used.................111
Works Cited ..........................................................................................................112
5
Tables and Figures
Table 3.1 Individual variables combining age, gender and marital status 31
Table 3.2 Dependent Variable 1—Party Identification 33
Table 3.3 Dependent Variable 2—Policy Preference 34
Table 3.4 Dependent Variable 3—Political Participation 35
Figure 4.1 Trends in Birthrates 38
Figure 4.2 Trends in Marriage 40
Figure 4.3 Trends in Mothers’ Labor Force Participation 41
Figure 4.4 Evolution of Partisanship Among Unmarried and Married Women (18-
35, 36-65, 66+)
43
Figure 4.5 Evolution of Partisanship Among Unmarried and Married Women (18-
35, 36-49, 50+)
45
Figure 4.6 Evolution of Partisanship Among Unmarried and Married Men 49
Figure 4.7 Impacts of Age, Gender, and Marital Status on Party Identification
2004-2012
52
Table 4.1 Summary of Party of Presidential Vote 54
Figure 4.8 Tracing Party of Presidential Vote 1952-2012 56
Table 4.2 Summary Party of Presidential Vote--Black Voters 57
Figure 4.9 White Respondents' Partisan Voting Behavior 59
Table 4.3 Summary of Support for the Democratic Party 60
Figure 5.1 Evolution of Support for Increased Federal Spending on Childcare
Among Unmarried and Married Women
65
Figure 5.2 Evolution of Support for Increased Federal Spending on Childcare
Among Unmarried and Married Men
68
Table 5.1 Summary of Attitudes Toward Increased Federal Funding for childcare 71
Figure 5.3 Summary for Support for Increased Federal Funding for Childcare
2004-2012
72
Figure 5.4 Evolution of Support of Increased Government Spending and Services
Among Married And Unmarried Women
75
Figure 5.5 Evolution of Support of Increased Government Spending and Services
Among Married And Unmarried Men
78
Figure 5.6 Support for Increased Government Spending and Services 2004-2012 80
Table 5.2 Summary of Attitudes Toward Increased Government Spending and
Services
81
Figure 5.7 Evolution of Individuals Identifying as “Pro-Choice” 83
Figure 6.1 Evolution of Voter Turnout Among Married and Unmarried Women 91
Figure 6.2 Evolution of Voter Turnout Among Married and Unmarried Men 93
Table 6.1 Summary of Voter Turnout 95
Figure 6.3 Summary of Voter Turnout 2004-2012 96
Figure 6.4 Evolution of Political Participation Beyond Voting 98
6
Table 6.2 Summary of Political Participation Beyond Voting 100
7
Chapter 1: Introduction: The Importance of Age, Gender, and Marital Status in
American Campaigns
A glance at the Huffington Post, Politico, or other political blogs draws one’s
attention to a recently identified potential voting bloc in American politics: young,
unmarried women. Pundits and politicians alike have identified this group of people as
crucial voters for winning elections. Most notably, pollster Stanley Greenberg published
a series of reports and articles on why unmarried women would be a key demographic for
the Democratic Party if they hoped to win the midterm elections in 2014.1
Pinpointing
specific groups of voters upon which to focus a campaign’s attention is not a new
phenomenon, but with each election cycle, these groups become narrower and more
scientifically identified. Since the advent of scientific public opinion polling in the
United States, electoral politics has developed its own form of math, often referred to as
electoral calculus. As public opinion polls become more reliable and more prevalent,
campaigns increasingly use polling to ascertain what views their constituents hold and
what issues they care most about. This permits candidates to run campaigns that are
more tailored to their identified electorates. Campaigns once had to start with a blank
slate of voters in their districts and manually narrow their focus to supporters they found
individually, by hand. Now, the majority of campaigns use software developed by their
political party in order to more carefully make use of the candidate’s time and to
eliminate wasted energy. More simply put, campaigns strive to “run smart, not hard.”
1 Stanley Greenberg and Erica Seifert, “”Why Unmarried Women Are the Key to
2014: But not for the reasons many Democrats seem to think,” Politico Magazine,
April 15, 2014, accessed October 18, 2014,
http://www.politico.com/magazine/story/2014/04/democrats-single-women-
105719.html#.VJHgIWTF9tI, 1.
8
Each year, campaigns’ metrics become more and more complex as further studies
are conducted, new research is released, and an increased investment in voter
identification software is made. National party committees, such as the Democratic
Congressional Campaign Committee (DCCC), now invest thousands of dollars each year
to develop increasingly advanced voter-targeting software. This simplifies the process of
identifying supporters by allowing politicians to take a candidate’s entire geographic
constituency—the group of people who live and vote in a given area—and more
accurately pinpoint likely voters for their candidate’s reelection constituency.2
The
reelection constituency consists of the people in a district who a representative considers
his or her supporters.3
As technology advances and scholarship develops, the clusters can
become more nuanced.
This thesis focuses on one such group: young, unmarried women. While scholars
have studied the impact of age, marital status, and gender separately on individuals’ party
identification, policy preferences, and political participation, little research has been done
on the increasingly discussed intersection of the three. The 2008 and 2012 presidential
elections alerted political strategists to the potential electoral importance of the
intersection of age, marital status, and gender—particularly young, unmarried women.
Voter participation research suggests that young, unmarried women are highly likely to
vote for a Democratic candidate, but inconsistently turn out to vote at all. They appear to
be one of the strongest voting blocks for the Democratic Party if they are convinced to
2 Merriam-Webster Online, s.v. “Constituency,” accessed October 1, 2014
http://www.merriam-webster.com/dictionary/constituency.
3 Richard F. Fenno, Jr. “U.S. House Members in Their Constituencies: An
Exploration,” The American Political Science Review, 71(1977): 886.
9
turn out and vote. The DCCC has gone so far as to invest in developing a new data
program, “ROSIE,” that is dedicated to getting this group to the polls.4
However,
scholarly work has not caught up to that of campaigns and national parties. First, there is
little consensus as to what factors truly drive this group’s decision making. Are their
preferences, as many assume, based on their desire to protect their reproductive rights or
are they, as recent research has shown, more linked to their economic status as unmarried
women?5
Before the assertions made in popular articles about how “All the Single
Ladies” are used to drive campaigns, rigorous research must be done on whether this
group truly represents a distinct and important voting bloc, and if so, to whom. This
thesis examines three groups of questions to develop knowledge of how and why young,
unmarried women differ from other groups of voters. My research centers on these three
governing questions:
1. When did young, unmarried women become a differentiated voting bloc?
What are the historical trends in young, unmarried women’s party identification,
policy preferences, and political behavior? Are there peaks or valleys
surrounding certain historical events?
2. On what issues do young, unmarried women differ from other demographic
groups in the electorate? What policy preferences separate young, unmarried
women from the rest of the electorate or from other constituency groups? Are
young, unmarried women more likely to diverge on social issues, economic
4Kelly Ward, ICYMI: DCCC Executive Director Kelly Ward Unveils the “Rosie” Model,
DCCC Blog, May 5, 2014 accessed October 21, 2014
http://archive.dccc.org/blog/entry/icymi_dccc_executive_director_kelly_ward_unve
ils_the_rosie_model/.
5 Greenberg and Seifert, “Why Unmarried Women Are the Key to 2014.”
10
issues, or other policy areas?
3. How can campaigns use this information to get this group of voters to
turnout on Election Day? Using these findings, how can campaigns mobilize
this group in coming elections and focus their messaging to convince them to vote
and volunteer? Young, unmarried women showed up to vote en masse in 2012,
but few plan to vote in 2014. In studying young, unmarried women as a voting
bloc it is possible to discover in what ways they differ from other groups of voters
and effectively persuade them to vote for a given candidate. . However, if my
research suggests that young, unmarried women do not differ substantially from
other voting blocs, campaigns and national parties should stop focusing on this
group as an important constituency for winning campaigns and should seek out
other demographics.
Identifying what issues decide particular groups’ preferences helps representatives
and candidates understand the American people better. By tracing developments over
time, one can establish a historical explanation for changes in American political
consciousness for different groups of people. Ultimately, these questions need answers
so that political strategists not only have a better idea of how to effectively build their
data models, but also have a well-rounded and well-researched knowledge base about
whether or not their efforts should be focused on this group—young, unmarried
women—in the first place. This thesis also develops a framework and methodology for
other researchers to combine different variables to test the preferences, history, and
affiliations of other combined demographics.
11
My thesis is organized as follows. My second chapter analyzes the existing literature
on gender, marital status, age, and political behavior to identify gaps in extant scholarship
and to guide the analysis in subsequent chapters. My third chapter outlines my
methodology, identifies and explains my choice of dataset, and defines my independent
and dependent variables chosen based on literature and availability in time series polls.
My empirical chapters—chapters 4, 5, and 6—each focus on one dependent
variable, party identification, policy preferences, and political participation. I conclude
with chapter 7 detailing what the conclusions of my empirical chapters mean for
politicians and political parties looking to target voters and win elections.
12
Chapter 2: Age, Gender, and Marital Status in Public Opinion: Separating
Evidence from Stereotypes
Gender, marital status, and age represent three distinct factors that appear to
impact an individual’s party identification, policy preferences, and political participation.
Each of these variables presents a straightforward way to compare easily categorized
groups of people. A great deal of literature exists surrounding each of these categories of
voters. The field of gender studies substantially contributes to questions about gender
differences in public opinion and informs political research on party identification, policy
preferences, and political participation. Literature on the gender gap in politics is perhaps
the most rounded subfield of my research. Scholars, researchers, and political strategists
have developed complex models and theories to explain political differences between
men and women. However, missing from the literature is research on differences among
genders (i.e. why some women hold different views and beliefs than other women)—not
between genders (i.e. why some men and women differ in political preferences). It is this
important intersection that I examine at length.
A number of studies have also been written about the impact of both age and
marital status on political preferences. These works, though frequently heavy in
assumptions and lacking in objectivity, provide a background as to how scholars should
evaluate different definitions of marital status to develop the most methodologically
sound studies and how age should be best divided to discover meaningful trends. In
exploring each subfield, I have been able to build upon the research of past scholars,
replicate portions of their statistical models that I find most effective, and avoid common
errors in studies of public opinion. I organize the literature review by examining each
subfield—gender, marital status, and age—while noting any scholarly work that studies a
13
combination of subfields in order to create a knowledge base from which to study the
intersection.
Gender: Party Identification, Policy Preference, and Political Participation
One important conclusion from the literature on gender differences is the
necessity of leaving behind preconceived notions and ideas about what may cause men
and women to vote differently. Not only is it easy to make assumptions about public
opinion based on one’s own views and life experiences, but there is also a plethora of
popular articles that rely on unsound data and baseless assumptions. As Sapiro and
Conover explain in their article on gender and public opinion, “much of the exaggeration
of gender difference…is caused by the fact that our day-to-day sources of information
about how the public thinks are drawn from evidence derived from political and cultural
elites, including interest group activists and journalists.”6
For this reason, much of the
literature on gender differences in political participation, party identification, and policy
preferences is dedicated to debunking common misconceptions. Several factors play a
large role in the media’s characterization of voting behavior and partisanship, despite the
fact that they have been largely discredited by scholars; these include inherent genetic
and biological imperatives, women’s higher propensity for empathy, women’s likelihood
of voting based on personality rather than policy, women’s inherent distaste for violence,
and women’s natural urge to vote exclusively based upon reproductive rights and other
“women’s issues.” Sapiro and Shames open their article on gender and public opinion,
“The Gender Basis of Public Opinion,” by explicitly acknowledging that, “conventional
6 Virginia Sapiro and Pamela Johnston Conover, “The Variable Gender Basis of
Electoral Politics: Gender and Contexts in the 1992 US Election,” British Journal of
Political Science, 27 (1997): 522.
14
wisdom, and even some academic discussion, is intertwined with stereotypes.”7
Literature focuses on fighting against common assumptions about both gender and
politics by rigorously researching potential causes and outcomes. Before it is even
possible to discuss questions about voting trends or policy preferences, methodology
must be informed by scholarship, not stereotypical assumptions, as to why these gender
differences occur.
Many authors of scholarly and popular articles suggest that genetic and biological
imperatives greatly contribute to the gender gap or the differences between men and
women in party identification, policy preferences, and political participation. These
authors argue that men and women are simply “wired” differently and therefore have
different goals and desires in every aspect of their being, including their political
tendencies.8
It seems like a simple enough argument to make—men and women are
different because of their biology—so why would this not be the reason they have
different views and preferences? Nearly every modern scholar who has researched the
gender gap, however, debunks the idea that biology could be principally responsible for
the gender gap in voter turnout, party identification, or policy preferences. Scholars
argue that biological differences cannot explain these disparities because, though there
are marked gaps in opinion, there is still more overlap between men and women on every
issue than there is disparity. This does not mean that the gender gap is rendered
irrelevant, as “the difference of even 8-10 percentage points can determine the outcome
7 Virginia Sapiro and Shauna Shames, “It's the context, situation, and question,
stupid: The gender basis of public opinion”, Understanding Public Opinion, ed.
Barbara Norrander and Clyde Wilcox, (Washington DC: Congressional Quarterly
Press, 2009), 5.
8 Francis Fukuyama, “Women and the Evolution of World Politics”, Foreign Affairs,
77 (1998): 27.
15
of elections.”9
It is these margins that campaigns target to swing the vote to their
candidates and win elections. The gap is important for winning elections, but the overlap
determines that biology cannot be the deciding factor in the differences between men’s
and women’s political preferences and affiliations. Researchers also note that gender
differences in opinion vary over time, suggesting that opinions and views reflect
something larger and more systemic than genetic-level variations.10
While a biological
explanation may provide a simple answer, it is not an empirically supported conclusion
and thus cannot be a basis for further scholarship.
It has also been demonstrated by several scholars that a candidate’s personal
charm and the emotional response they evoke factor more greatly into a women’s
decision than a man’s. Anderson counters this claim by demonstrating that more
employed women turned out for Nixon than for Kennedy in 1960, suggesting that
Kennedy’s charm cannot account for women’s increase in participation from 1956 to
1960. Sapiro and Conover further examine the argument that women are more likely to
vote based on their emotions than men. They use the National Elections Study’s
questions on “what emotional reactions the two major party candidates evoked in them”
as well as questions that dealt with key concepts in campaign rhetoric such as moralism
and egalitarianism.11
Their findings do not support the notion that women are more
likely to vote for a candidate based upon an emotional response. In fact, they find that
emotional response has little bearing at all except when men were asked about defense
9 Leonie Huddy, Erin Cassese, and Mary-Kate Lizotte, “Gender, Public Opinion, and
Political Reasoning,” in Political Women and American Democracy, ed. Christina
Wolbrecht, Karen Beckwith, and Lisa Baldez, (Cambridge: Cambridge University
Press, 2008), 31.
10 Sapiro and Shames, 25.
11 Sapiro and Conver, “Variable Gender Basis,” 509.
16
attitudes, suggesting that men may be swayed more by emotional response than women.
Emotional response to a candidate and candidate’s charm are not statistically supported
explanations for the presence of the gender gap in voting behavior, and thus will not be a
critical part of my study.
In their work, Sapiro and Conover describe three approaches to the gender gap:
positional, structural, and contextual. Simply put, those who put forward positional
arguments suggest that men and women take into consideration the same factors when
making electoral decisions, but simply have different positions on those factors. Those
on the structural side of the argument say that women and men simply take different
factors into consideration and place weight on different factors due to their distinct roles
in society. This explanation suggests that men and women make different judgments not
because they have inherently opposing views and values, but because they place
importance on different issues when making political decisions. While a positional
approach would lead men and women to simply vote differently, “structural explanations
allow for men and women to vote similarly, but for different reasons.”12
The third factor
that they consider is contextual, that the electoral context of any given election is
different and highlights different issues. The 1992 election, which they use as their case
study, was referred to as “The Year of the Woman” because campaigns focused heavily
on traditional women’s issues, such as reproductive rights and workplace harassment, and
the end of the Cold War ushered in a more peaceful era in international relations more in-
12 Ibid., 499.
17
line with women’s views on foreign policy.13
Sapiro and Conover find merit in each of
these explanations, and it is important to keep each of them in mind when conducting
studies that measure the differences in political attitudes and policy preferences between
groups of individuals. There research is also a caution to remain mindful of and study
the electoral context of a given time period or election when using it in my study.
Scholars seem to agree that the gender gap became an important political
phenomenon beginning in the early 1970s. There are several reasons this era was
important. It was around this time that the gender gap in political participation began to
decrease and ultimately reverse. Before the 1970s, far more men than women voted, so
the women’s vote made up far less of the electorate. Therefore, there were not enough
women voting to truly create a gender gap; they simply did not comprise enough of the
electorate to make an aggregate difference in the outcome of elections.
Immediately following the emergence of the gender gap, women identified more
with the Democratic Party. The 1980s provided fascinating case studies for this
developing phenomenon. Marty Gilens uses the 1980 election to study gender
differences because in that election, though more women supported Reagan than other
Republican candidates over the last five decades, “9.6 percent fewer women than men
voted for Ronald Reagan.”14
In every other presidential election since 1960, the majority
of women voted for the Democratic candidate and, except for 1992 and 1996, men
13 Michael X. Delli Carpini and Bruce A. Williams, “The Year of the Woman?
Candidates, Votes and the 1992 Elections,” in Political Science Quarterly, 108 (1993),
32-33.
14 Martin Gilens, “Gender and Support for Reagan: A Comprehensive Model of
Presidential Approval,” American Journal of Political Science, 32 (1988): 19.
18
supported the Republican over the Democratic candidate.15
This provides a reminder of a
danger in studying gender: making the assumption that gender means woman. Because
more men than women voted for President Reagan does not mean necessarily that women
became more liberal. It could, in fact, point to men becoming more conservatively
minded. In his work, Daniel Wirls looks at the intersection of age and gender finding
that, “young women are dividing themselves between the two parties in roughly the same
proportions as all adult Americans have for many years…young men are now going
against the grain of the American electorate of recent history by identifying themselves as
Republicans much more than Democrats.”16
While the electoral outcome is the same,
discovering the root of gaps in voting trends is the key to understanding how to mobilize
voters for one’s candidate and also to study other permutations of voting gaps. It is
important to remember that the gender gap could stem from differences in views of either
gender, not just women.
Work on the gender gap also greatly informs my methodology as much of the
research these scholars do is similar to mine, simply with different combinations of
variables and questions. Most authors divide the types of questions they ask into
categories such as partisan identification, policy opinions, electoral preferences, and
ideology. These primary categories directly relate to my questions and their results and
types of questions asked directly inform my selection of questions. The majority of
empirically sound studies that study the gender gap over time also employ the American
National Elections Study, the dataset I use in my own research. Marty Gilens makes a
15 Huddy, Cassesse, and Lizotte, “Gender, Public Opinion, and Political Reasoning,”
47.
16 Daniel Wirls, “Reinterpreting the Gender Gap,” The Public Opinion Quarterly, 50
(1986): 328.
19
particularly salient point about analysis of public opinion polls. He asserts that using a 4
point scale for analyzing opinion rather than a dichotomous agree or disagree allows for
much more detailed analysis without the necessity of complex mathematics. Scholars
also note the increased participation and engagement of women when they have the
opportunity to vote for at least one female candidate. While this is an important question
and merits extensive further research, it does not fall within the parameters of this study.
Literature on the gender gap informs my study by steering my work away from
common pitfalls made by scholars, such as over-reliance on stereotypes, focusing on
“gender” meaning “women,” the scholarly consensus that the gender gap truly began to
gain importance in the 1970s, and the added benefits of not using dichotomous variables,
but including larger scales to study the degree to which individuals adhere to certain
positions. My study contributes by adding in the variables of age and marital status to
extant gender scholarship and examines how important gender is as compared to the
other two factors of my variables.
Marital Status: Party Identification, Policy Preferences, and Political Participation
Because there is less of a collective understanding of the apparent causes and
effects of a marriage gap in political behavior, and because there has been less
scholarship dedicated to its development, there is less information to cover and fewer
stereotypes to debunk surrounding the political participation, party identification, and
policy gaps between married and unmarried individuals. For this reason, I focus on the
methodological lessons from the scholars who have studied this phenomenon, as well as
the conclusions that they reach.
It is apparent that there is a marriage gap in voting preferences. In the 1984
20
presidential election, 63% of married people voted for the Republican candidate, while
only 45% of never-married voters did.17
At the time, this didn’t create a large difference
in the election overall because only 26% of the electorate wasn’t married at the time.
Only 51% of adults in the United States are currently married, whereas in 1960, 72% of
adults were married.18
This decline in marriage rates is seen across the spectrum, but is
especially prevalent in young people. If this trend away from marriage continues it will
be increasingly important to continue to learn more about how marital status impacts
ideologies, voting behavior, and policy preferences.
“The Demographics of a New Voting Gap”, written by Herbert Weisberg in 1987,
is one of the first articles to thoroughly cover the marriage gap—the differences in party
identification, political participation, and policy preferences between those who are
married, divorced, or never married. Weisberg does an excellent job of setting up a
framework and background for future scholars contributing to the general knowledge
base as well as the best methodology to study the phenomenon of the marriage gap.
Weisberg asserts that the marriage gap became an important phenomenon in the 1972
election when married people voted “about 10-15% more Republican than unmarried
people.”⁠ 19
He also points out how much more important a voting bloc this group of
unmarried people could become in future elections. In 1971, the voting age was lowered
from 21 to 18, adding a large group of primarily never-married voters to the electorate.
At the same time, marriage rates began declining, the age of first marriage was
17 Paul William Kingston and Steven E. Finkel, “Is There a Marriage Gap in Politics?,”
Journal of Marriage and Family, 49 (1987): 57.
18 Ibid.
19 Herbert F. Weisberg, “The Demographics of a New Voting Gap: Marital Differences
in American Voting,” The Public Opinion Quarterly, 51 (1987): 335.
21
increasing, and divorce rates were rising annually; unmarried people began to make up
one of the fastest growing subsets of voters.
Weisberg accurately predicts that recognition of this growing demographic would
cause strategists and politicians to devote time and energy trying to target these
unmarried voters. However, he notes problems that could arise from ascribing too much
importance to marital status and too little to other factors: “party leaders that now find
that their traditional racial and income appeals have led to a marriage gap in voting may
choose to focus their appeals more directly on family issues that would increase this
division.”⁠ 20
Underlying factors that lead to the decision to be married or not could be
more responsible for a person’s political attitudes than marital status itself. For instance,
people who marry young are statistically more likely to be religiously and politically
conservative. They are not conservative because they are married, but married because
they are conservative. This does not make marital status any less important a factor to
consider when it comes to identifying voters and coordinating campaigns, but in studying
public opinion and demographics it is important not to ascribe causes to voter preferences
without rigorous research.
Another important field to study is the participation gap between married and
never-married voters. Conventional knowledge suggests that married individuals are far
more reliable voters than their unmarried peers. Kingston and Finkel suggest that there
are several reasons that married individuals are more likely to make it to the polls. It’s
possible it is simply more likely that there is a person in their household who convinces
the rest to vote. It is also possible that married people have “a greater psychological
20 Ibid., 342.
22
stake in the established order and thus may be more likely to participate politically.”21
They find that married people do have higher voting turnout, 14% more than singles.
However, “beyond the minimal act of participation, the singles are generally the most
politically involved.”22
This means that, if an unmarried person can be convinced to
vote, they are more likely to also volunteer for or donate to a candidate or campaign.
This is particularly interesting as it supports the idea that, if mobilized, unmarried people
are much more politically active than their married peers. Women are also more likely to
participate beyond the act of voting and so are young people, and to participate in non-
monetary ways. This suggests that it may be true that young, unmarried women could be
one of the greatest assets to campaigns and candidates.
Finkel and Kingston also divide marital status dichotomously: currently married
and single. They argue it is too difficult to determine the positions of widowed, divorced,
or separated people without going into the details of how long they were married or how
long ago they were married. This leads me to also use a dichotomous variable. I focus
on currently unmarried and currently married individuals, as this is the most effective
way to measure the persuasive argument that lack of secure finances motivates unmarried
women to vote a certain way.
In their work on the rising gender gap “Why have women become more left-
wing? The political gender gap and the decline in marriage,” Edlund and Pande suggest
that the “fall of over a quarter in the proportion of currently married adults, and a
threefold rise in the proportion of currently divorced individuals” in the United States in
the ‘70s, ‘80s, and ‘90s made women poorer in relation to men and thus more likely to
21 Kingston and Finkel, “Is There a Marriage Gap in Politics?,” 58.
22 Ibid., 61-62.
23
vote for the Democratic Party.23
They observe that increases in their variable “divorce
risk” strongly correlates with the increasing gender gap in party preference. This
suggests that voting trends may not be based entirely on one’s marital status at the time of
voting, but that they may be more related to concerns about future marital status directly
relating to financial stability. They suggest that the phenomenon more greatly affects
women’s party affiliations because “women’s decisions to work have been predicated on
a fall in income from deteriorating marriage market conditions.”24⁠
While their article faces many issues with the value judgments they make without
providing research support their claims such as the idea that women and men get married
as a transaction where the man provides financial support for the woman who provides
sex and access to children, much of their methodology of their study is sound and
interesting.25
Their works’ relation of divorce risk to the gender gap is easily replicable
and will be used in my study to examine not only divorce, but also correlation of the
variable “never married” to policy preferences, party identification, and political
participation. This will enable me to see if it is the fear of decreased financial security
that leads women to vote for Democrats, or if it is more likely to be other factors that
greatly affect unmarried women. Edlund and Pande also study a similar range of issues
to those I do, “attitudinal questions on women’s issues (abortion and equal roles), the
relative political salience of social, welfare, and economic issues for the respondent” so
23 Lena Edlund and Rohini Pande, “Why Have Women Become Left-Wing the
Political Gender Gap and the Decline in Marriage,” The Quarterly Journal of
Economics, 117 (2002): 919-920.
24 Ibid., 921.
25 Ibid., 923
24
their choice of questions and issues is a good starting point for my study.26
Where Edlund and Pande argue that the gender gap develops from a women’s
inherent economic vulnerability created by a decrease in marriage rates and an increase in
divorce rates, Huddy, Cassese, and Lizotte assert, “The gender gap may originate among
women who are economically autonomous from men but not necessarily economically
vulnerable.”27
They suggest that this group of women may vote for Democrats because it
is a party that represents well-educated unmarried women as well as low-income
unmarried women’s interests. These women are more likely to work in the public sector
than other workers, they are more likely to be single parents, and more likely to benefit
from reform against job discrimination and for affirmative action, all causes the
Democratic Party champions.
Most recently, Democratic pollster Stanley Greenberg has begun to study
unmarried women in-depth, citing them as the greatest hope for the Democratic Party in
the 2014-midterm elections. His studies concluded that never-marrieds, divorcés, and
widows were likely to vote for the Democratic Party in the midterm elections because of
their vulnerable economic positions rather than their stances on “women’s issues.” This
argument and persuasive evidence lead to the inclusion of divorcés and widows in my
“unmarried” category.28
The largest contribution that existing scholarship on the marital gap makes to my
research is the assertion that my variables should be divided between married and
unmarried, that scholarship focusing on voting trends, ideologies, and policy preferences
26 Ibid., 934
27 Huddy, Cassesse, and Lizotte, “Gender, Public Opinion, and Political Reasoning,”
37.
28 Greenberg and Seifert, “Why Unmarried Women are the Key to 2014.”
25
are more correlated to current marital status rather than marital history. It is also
important to consider the changing attitudes toward marriage in the United States such as
a decrease in marriage rates, an increase in age of first marriage, and skyrocketing
divorce rates. This information furthers the importance of including marital status as a
variable and specifically identifying the preferences of unmarried individuals who begin
to make up more of the population and a large portion of unlikely voters that could be
swayed to turn out and vote for a given candidate.
Age: Party Identification, Policy Preferences, and Political Participation
The relation of age to policy preference, party identification, and political
participation is complex and often inconclusive. Several factors create barriers to making
sound judgments about the impact of age on these three variables. First, there is a
scholarly debate as to whether raw age or cohort is more important—that is, is a person’s
age or the political climate in which they were born more important in determining an
individual’s party identification, policy preferences, and political participation? Second, it
is hard to determine whether age, or other factors are more important when looking at the
electorate as a whole. For instance, a larger proportion of young voters are immigrants,
minorities, or first generation college students; it may be these factors, rather than age,
that more greatly impact a person’s political views. This is difficult to study because
these factors were not as recognized or present in older generations, but appear to play a
large role in younger voters and are thus difficult to track over time. Third, a wealth of
literature now exists surrounding the potential anomalies presented by the “millennial
generation.” Though definitions of the exact timing of this generation’s emergence vary
from those born in the late ‘70s to early ‘90s, the true marker is the level of technology
26
this cohort had access to in their formative years. It is hard to tell the effects the
millennial generation will have on politics for years to come as they have yet to truly age
out of the “young” age group and cannot be analyzed in other age brackets.
However, many of these issues do not affect my study. Because I do not examine
the effect of age alone on policy preference, party identification, or political participation,
but rather use age as an interactive factor in my variables, many ways in which age is
swayed are eliminated. For instance, if the millennial generation is truly an anomaly,
then each of the groups I study in that age range should exhibit the same differences from
older cohorts. Young unmarried men, young married men, young unmarried women, and
young married women should demonstrate similar tendencies if millennials truly
represent a unique cohort of voters. Also, because of the way I divide the years in my
study, I am able to examine both cohort as well as age individually. For example, the
group that I label “young” from 1952-1962 will, for the most part, be labeled “middle
aged” from 1962-1972, and “older” from 1992-2002. While the same people are not
studied year to year, tracing these generations over time will permit me to see if changes
in attitudes seem to occur over time, or if it’s more likely that one’s cohort’s views seem
to remain stagnant throughout the decades.
Scholars have shown that young people have developed a tendency to vote for
Democratic candidates, even if it is not clear why. Sapiro and Shames discuss the rapid
increase in young people identifying with the Democratic Party and suggest this
phenomenon, if it continues, has the power to continue to elect an increasing amount of
Democratic candidates. Because young people, as well as unmarried individuals and
women all appear more likely to vote for Democratic than Republican candidates, it
27
suggests that young, unmarried women would be one of the most reliable voting blocks
for the Democratic Party. My study seeks to determine whether combining these factors
increases the likelihood of an individual being a democrat as well as the strength of their
Democratic leanings, or if the factors truly present themselves separately but when
combined have little effect.
Andersen’s study of working women also studies working women by
generation—those born after 1930, between 1924 and 1939, and those born before
1924—she finds that the youngest group of women are the most politically active, while
the oldest women are the least. This is important to note because, in general, older
demographics are more likely voters. The younger individuals are the least likely
population to vote.29
It will be important to examine this variable in my study to
determine which group is the most politically active and thus the most advantageous to
motivate for a given candidate beyond the act of voting.
While some studies mentioned above strive to combine age, marital status, and
gender, they do not do so in order to analyze groups voters as I do, but rather in
combination with a myriad of other factors to determine which factor is the most
important in determining views, rather than how the three combined would impact an
individual’s preferences. This is where my scholarship adds to the study of age and
political preference, it does not study age individually or age as a primary factor, but
rather uses age to break up the electorate to study marital status and gender further.
Conclusions
There is a wealth of literature on gender, marital status, and age that studies policy
29 Norval D. Glenn and Michael Grimes, “Aging, voting, and political interest,”
American Sociological Review (1968), 563.
28
preference, political participation, and party identification. However, what is lacking is
scholarship that combines gender, marital status, and age. Studies that do combine all
three factors do so to prove larger points, rather than provide a descriptive analysis
focusing on the party identification, political participation, and policy preferences of the
group itself. Without this type of scholarship, other studies remain uninformed and
cluttered with assumptions. While existing scholarship provides a strong base of
information to build upon and methodology to replicate, much is missing. This thesis
takes the information acquired by other researchers, abandons practices scholars have
deemed methodologically unsound and conclusions they find invalid, and strives to
contribute a comprehensive analysis of a previously ignored, but evidently increasingly
important demographic—young, unmarried, women.
29
Chapter 3: Research Design
In this chapter, I describe the sources and methods that will be employed to
analyze my three research questions. Specifically, the chapter describes the sources of
data, the measures that I will construct, and the methods to be employed in the remainder
of this thesis. I detail my choice of data set, the creation of my independent variable
(AGMS), and present my choice of variables from the full American National Election
Study dataset that I use in this study.
Data Source
The American National Elections Study (ANES) has become the principal
resource that scholars employ for political research. The ANES study description
describes the data set as
Particularly useful in service to three kinds of analysis: 1) analysis that focuses on
over time change in citizens, in their individual characteristics, in the opinions
they hold, and in their political behavior; 2) analysis that looks at subgroups of
citizens that are represented by few cases in a single, cross-section sample, but by
many more cases when several samples are combined; and 3) analysis that is
concerned with replicating results over several elections.30
Considering that my research questions touch on each of these areas, the ANES is clearly
the comprehensive available.
While some other studies and polls do comparably excellent jobs of developing
questions and reaching diverse groups of respondents, the true value of the ANES is its
historical reach and commitment to consistency. ANES has been surveying the
American public via in-person interviews twice a year every two years, before and after
30 American National Election Study, accessed September 24, 2014
http://www.electionstudies.org/studypages/cdf/cdf.htm.
30
Election Day, since 1948. From this data they compile a full data set through 2008
making 60 years of data available for further study. Each year, a portion of the survey
consists of questions that specifically target that year’s political climate and candidates.
The real significance to my research comes from the ability to analyze changes
over time, made easy by the ANES because since its inception the study has been
committed to asking the same or very similar questions each year. These are the
questions around which I will build my research, as this is a methodologically sound way
to consistently map variables such as party identification, ideology, and policy
preferences over time rather than having to piece together snapshots of attitudes at given
moments over history from different and often incompatible sources. As with any series
conducted over time, some questions are added and dropped from the survey, and some
questions change over the years. Nonetheless, I attempt to select questions based not only
on content, but also the number of years they were asked and the consistency of the
wording.
Another benefit of using this data set is that it has already been compiled with
consistent variables, so the data is both manageable and easily manipulated, even though
it analyzes over 900 variables and over 50,000 responses. With this number of variables
studied, there is sufficient data to address each of my questions. In summary, The
American National Elections Study is the best selection of a data set for my research that
is used most by scholars who do similar research on opinions over time. It’s cumulative
data set complied from the last 60 years of surveys is easily read and manipulated and
represents a model of methodologically consistent and rigorous research, allowing
researchers to focus less on quality-control of data and more on the information that can
31
be drawn from data manipulation. This dataset, combined with the functions of STATA,
make my variables not only possible to study with the number of cases I hope to include,
but also clear in their presentation and results.
Coding Age, Gender, and Marital Status
My independent variable combines age, gender, and marital status. Each of these
factors is ascertained for each respondent in the ANES. My first step was to eliminate
any respondents who chose not to respond to those questions. The study also doesn’t
simply ask if respondents are married or unmarried, but includes categories for divorced,
widowed, or never married, permitting me also to develop my own definition and
measure of “unmarried” and to combine age, gender, and marital status into one variable,
which makes it easier to track trends based on my own and accepted scholarly
definitions.
I create twelve possible outcomes for my independent variable using age, gender,
and marital status. All of these variables are available for the period 1952-2012. I
combine them to create the following variable with the following possible
categorizations:
Table 3.1: Individual variables combining age, gender, and marital status
Variable AGMS Codes
1. Young Unmarried Women (YUW)
2. Young Unmarried Men (YUM)
3. Young Married Women (YMW)
4. Young Married Men (YMM)
5. Middle Aged Unmarried Women (MUW)
6. Middle Aged Unmarried Men (MUM)
7. Middle Aged Married Women (MMW)
8. Middle Aged Married Men (MAM)
9. Older Unmarried Women (OUW)
32
10. Older Unmarried Men (OUM)
11. Older Married Women (OMW)
12. Older Married Men (OMM)
Age is divided into three groups: Young (18-35), Middle Aged (36-65), and Older (66+).
Most studies that study age groups use similar age ranges. “Unmarried” includes all
individuals who responded as never married, divorced, or separated. Though some
scholars argue that divorce, separation, and widowing are fundamentally different
experiences than having never been married, these differences should not greatly impact
my study. Scholars who research marital status and public opinion often combine these
factors because arguments that hinge on financial security, ideology, and policy
preferences appear to hinge more on whether or not the respondent is currently married,
as opposed to whether they have ever been married. It is also difficult to separate
divorced, separated, and widowed into their own category, as it is not possible to control
for length of relationship, reason for separation, or other factors which could play a role
in responses to polling questions. For my results, it is not crucial to separate them from
the “never married” population, so divorced, separated, and widowed are combined with
never married individuals to form a group called “unmarried.”
Because the ANES defines gender as a binary, I do as well. Respondents who
answered that they identified as male are coded as men, respondents who answered that
they identify as female are coded women, and anyone who did not respond is removed
from the study. The ANES also uses the variable gender to mean sex and the rest of this
paper will do the same to maintain consistency between the dataset and results.
As noted above, these variables will be employed to analyze several dependent
variables: party identification, policy preferences, and political participation. Party
33
identification is specifically asked of respondents as individual questions or groups of
questions each year for the ANES and requires little manipulation or selection on my
part. Policy preferences require a bit more selection, but again, the benefit of the ANES
provides such a range of questions on policy issues throughout the years. It also
maintains an incomparable level of consistency each year allowing for a more accurate
comparison of preferences from year to year. Because the variables are so easily traced
over time, the link between the dependent and independent variables is straightforward.
By developing individual variables for each permutation of my independent variable
(young unmarried women, young unmarried men, young married women, and so on) I
will be able to trace those groups’ views, identifications, and ideologies using the
questions asked each year by the ANES.
Dependent Variable 1: Party Identification
To examine my first dependent variable, I chart the responses of each of my
twelve independent variables to the following questions:
Table 3.2: Dependent Variable 1—Party Identification
Variable Name in ANES Description (Years Asked)
VCF0303 Party ID Summary (Since 1952)
VCF0706 Party of R Vote: President (Since
1948)
I choose to examine these two variables not only because they have been asked each year
in nearly the exact same manner since 1952 but also because they each provide different
information. It will also show whether gendered partisanship has changed over the last
60 years, when, and which combinations of age, gender, and marital status have become
more or less partisan. The three-point scale is important because it shows simply which
party a person is likely to vote for, which is important for the outcome of elections as it
34
doesn’t necessarily matter how strong of a Republican a person is when they get to the
ballot box if they intend to vote the Republican ticket. This is a way to quickly gauge
which party a group of voters is likely to support as a whole, while the first question
provides a more nuanced approach.
Dependent Variable 2: Policy Preference
Next, I study policy preferences. Unfortunately, most policy issues are dependent
on the political climate and have not remained the same for the last seventy years. I make
an effort to choose those issues that have the most relevance to my study while also
providing enough years to accurately test their trends over time. I use the following issue
areas:
Table 3.3: Dependent Variable 2—Policy Preference
Variable Code in ANES Policy Area (Years Asked)
VCF0839 Government Spending and Services on
Healthcare and Education (Since 1982)
VCF0838 Abortion (Since 1980)
VCF0887 Federal Spending on Child Care (Since
1988)
These policies were chosen because they are the areas surrounding which the most
scholarship and popular literature exists. Each of these measures support for a given
policy, and I will measure it as percentage support over time, as well as include more
rigorous statistical analysis as necessary.
Then, I look at political participation of my groups by tracing their responses to
several questions on political participation
Dependent Variable 3: Political Participation
I examine each of these categories of voting behavior and political participation
separately to determine not only how likely a group of individuals are to vote, but how
35
likely they are to participate beyond the act of voting. To test individual’s participation
beyond voting I combine four measures of political participation—attending rallies,
working for a campaign, wearing a button or sticker, or donating money—to a variable
that examines whether an individual performed one or more political acts beyond
registering and voting. In combining age, gender, and marital status I hope to further test
the developing theory that young unmarried women are a likely group to participate
beyond the act of voting.
Table 3.4: Dependent Variable 3—Voting Behavior
Variable Code in ANES Description (Years Asked)
VCF0703 Did respondent register and vote in this
year’s election? (Since 1952)
VCF0718 Did respondent attend political
meetings/rallies during the campaign?
(Since 1952)
VCF0719 Did respondent work for a party or
candidate? (Since 1952)
VCF0720 Did respondent display a button or sticker
for a party or candidate? (Since 1956)
VCF0721 Did respondent donate money to a party or
candidate? (Since 1952)
I organize my chapters the same way I organize my variables. My first analytical
chapter focuses on the trends in young, unmarried women’s party identification and
partisanship. After tracing trends over time, I examine how this group of voters (YUW)
votes differently from other groups (i.e. YSM, OMW etc.), when they began to
distinguish themselves as a separate voting bloc, and what may have precipitated the
division. My second chapter of data analysis focuses on policy preference. Do young,
unmarried women have different policy preferences than other age groups? If so, are
popular articles as to what issues young, unmarried women gravitate toward accurate, or
is it something else? My final analytical chapter is based on political participation, that
36
is, how much more or less likely are young, unmarried women to vote and participate in
politics than other groups. Again, I look into the development of a gap as well as
potential explanations based on timing and historical events for the causes of this gap.
After analyzing the data, I include a chapter detailing what these conclusions could mean
for future campaigns and politicians when it comes to analyzing this group of voters as a
constituency or voting block and offer suggestions as to what further research should be
conducted.
37
Chapter 4: The Impact of Age, Gender, and Marital Status on Party Identification
The Changing Lives of American Women
Before presenting an in-depth analysis of the changing attitudes of American
women over the last sixty years, it is useful to describe the lifestyle changes that
American women have experienced over that time period. This analysis provides an
initial evaluation of the types of problems and interests that women of different age
cohorts are likely to experience, and it also provides guidance in defining the age cohorts
that I will employ in the subsequent analysis
There are three important milestones that shape the challenges and therefore the
political interests of women. First, first-birth rates—the age at which a person gives birth
to their first child—for women over 35 have dramatically increased in the last forty
years.31
Second the median age of first marriage has also risen dramatically and fairly
steadily since as early as the 1950s.32
Finally, since the mid-1970s, workforce
participation of mothers with children of all ages has steadily increased.33
These
developments suggest that mothers at that time would also have changing views and
priorities as they left the home and entered the workforce. These changes are important
not only as standalone statistics, but also important when considering what age group a
woman should be considered a part of to obtain the most meaningful data.
31 Mathews TJ, Hamilton BE. First births to older women continue to rise. NCHS data
brief, no 152. Hyattsville, MD: National Center for Health Statistics. 2014.
32 U.S. Census Bureau, Current Population Survey, March and Annual Social and
Economic Supplements, 2014 and earlier.
33 “Women in the Labor Force,” Department of Labor Statistics, last accessed April
20, 2015, http://www.dol.gov/wb/stats/facts_over_time.htm
38
Increasing Birthrates for Women Over 35
One stark trend over the last forty years is increasing first birthrates—the age at
which women give birth to their first child— for women over 35 each year with few
exceptions. Since the early 1980s, first birth rates for women between 40 and 44 have
also steadily and rapidly increased. The data in the graph below make clear that issues of
family and career planning are no longer confined to very young women. The trend
begins to take off around 1980, and first-birth rates for women between 35 and 39 have
rapidly and nearly consistently increased since then.
Figure 4.1: Trends in Birthrates
This trend is especially important when defining what it means to be a “young
woman.” Many pundits and politicians suggest that women in their twenties are likely to
vote based upon issues of reproductive rights. However, this later first birth rates show
that women in their mid-thirties and even forties are making decisions that were made by
much younger women in previous generations. Women giving birth to their first child
later in life also introduces several challenges for policymakers. With women giving
birth at an older age, there is a larger demographic of voters who are intimately connected
0
2
4
6
8
10
12
2012
2010
2008
2006
2004
2002
2000
1998
1996
1994
1992
1990
1988
1986
1984
1982
1980
1978
1976
1974
1972
1970
RatePer1,000womeninspecified
agegroup
First Birth Rates for Women 35-39 and 40-44
35-39
40-44
39
to the costs of childcare, the quality of education, policies that particularly affect mothers
and parents, issues of work-life balance, and a wider range of health care concerns. It is
important to be mindful of this trend when looking at the changing views of women in
the last sixty years. As the lifestyles of American women change, our analysis of their
preferences must also change.
Rising Age of First Marriage
The past sixty years have also seen a steady increase in the median age of first
marriage in the United States. Though the median age of first marriage has pretty
steadily increased for both men and women, since the 1970s it has been a steeper increase
for women. Since 1975, the median age of marriage for women has risen 30% while
men have experienced a 25% increase. The graph below demonstrates these trends.
Like first-birth rates, the median age of marriage begins to rise rapidly beginning
in the late 1970s to the early 1980s, suggesting other changes in preferences are likely to
take off in this time if marriage and first-birth rates impact a woman’s policy preferences,
voting behavior, or party identification.
40
Figure 4.2: Trends in Marriage
The rising median age of first marriage also has several impacts on the lives of
Americans, and in particular American women. First, there is therefore a larger than ever
population of voters who are unmarried, making them an increasingly important
demographic to consider in elections and governance. Second, this trend also leads to
more individuals entering a marriage with an established career path and income, a stark
contrast from a more “traditional” outlook of a woman marrying a man and raising
children while he makes the financial decisions for the household. Women who marry
later almost certainly would hold different views than their counterparts who married
younger. As the median age of marriage rises, so should an understanding of what it
means to be a young unmarried woman versus an older unmarried woman.
Mothers’ Labor Force Participation
The percentage of women with children who are in the work force has increased
for mothers with children of all ages over the past forty years. This trend is particularly
20
21
22
23
24
25
26
27
28
29
30
2014
2011
2008
2005
2002
1999
1996
1993
1990
1987
1984
1981
1978
1975
1972
1969
1966
1963
1960
1957
1954
Age
Year
Median Age of First Marriage in United States
Men
Women
41
salient in women with children under three years of age with labor force participation of
mothers almost doubling from 1976 to 2012.
Figure 4.3: Trends in Mothers’ Labor Force Participation
Increased labor-force participation of mothers with children of all ages is important in
particular when looking at policies related to childcare and wage equality. This also
demonstrates that fewer women are putting their careers on hold long-term to raise
children and run a household. This means that mothers and working women are
increasingly one in the same causing both groups of women’s interests to shift.
Summary: The Lives of American Women
The data described above make clear that the lives of American women are vastly
different than they were forty to sixty years ago. We would therefore expect both their
priorities and views to be different than they were in the past. These data also
demonstrates that it is important to keep an evolving view of what it means to be a
“young woman” versus an “older” woman and suggests the need to at least evaluate the
possibility that the hypotheses associated with younger women may actually apply to
42
middle-aged women as well. In the next section of this chapter, I provide such an
evaluation before defining the age cohorts to be employed in the remainder of the study.
Recoding Age
To assess whether middle aged and younger women increasingly have similar
concerns, I compared my originally proposed age range (18-35, 36-65, 66+) to a possible
new age range. 34 For this test, I recoded age groups so that 18- to 35-year-olds are coded
as “young,” 36- to 49-year-olds are coded as “middle-aged,” and anyone 50 years and
older is coded as “older.” Though 50 at first appears to be a high cutoff for describing
middle-aged individuals, consider first-birth rates for women over 35. A woman who
gives birth at 35 ostensibly has a child under 18 years old living at home until she is 53
years old. This suggests that many 50 years olds may have similar concerns that women
in their thirties had when age of marriage and age of first-birth were in the lower
twenties. Figure 4.4 traces unmarried women’s identification with the Democratic Party
over five time periods using the original age breakdowns proposed in Chapter 3 (18-35,
36-65, 66+).
34 All data in the remainder of this chapter comes from the ANES Cumulative Data
File. The American National Election Studies (www.electionstudies.org) TIME
SERIES CUMULATIVE DATA FILE [dataset]. Stanford University and the University
of Michigan [producers and distributors], 2012.
43
Figure 4.4—Evolution of Partisanship Among Unmarried and Married Women (18-35, 36-65, 66+)
40
45
50
55
60
65
70
1952-1964 1965-1977 1978-1990 1991-2003 2004-2012
%Democrat
Year
Unmarried Women (D)
Young Unmarried Women Middle-Aged Unmarried Women
Older Unmarried Women
40
45
50
55
60
65
70
1952-1964 1965-1977 1978-1990 1991-2003 2004-2012
%Democrat
Year
Married Women (D)
Young Married Women Middle-Aged Married Women
Older Married Women
44
This figure demonstrates several important findings. First, it shows that marital
status and age impact a woman’s party preferences. Second, it shows that unmarried
women, using these age groups, are becoming a more cohesive voting bloc than their
married counterparts. Each age group of unmarried women has trended Democrat since
1991. Third, by showing each age group of unmarried women trending similarly, it
suggests that either the factors discussed in “The Changing Lives of American Women”
do not significantly impact unmarried women’s party identification, or that this age
breakdown is too broad to assess these trends. I test this second possibility by recoding
age so that “young” represents 18- to 35-year-olds, “middle-aged” represents 36- to 49-
year-olds, and “older” represents individuals who are 50 and older. Figure 4.5 traces
women’s partisanship using these recoded age ranges.
45
Figure 4.5—Evolution of Partisanship Among Unmarried and Married Women (18-35, 36-49, 50+)
40
45
50
55
60
65
70
75
1952-1964 1965-1977 1978-1990 1991-2003 2004-2012
%Democrat
Year
Unmarried Women (D)
Young Unmarried Women Middle-Aged Unmarried Women
Older Unmarried Women
40
45
50
55
60
65
70
75
1952-1964 1965-1977 1978-1990 1991-2003 2004-2012
%Democrat
Year
Married Women (D)
Young Married Women Middle-Aged Married Women
Older Married Women
46
This new age range also shows that age and marital status are important factors in
determining a woman’s party identification. In addition, by more finely breaking down
age groups, this age range also reveals that unmarried young women’s and unmarried
middle-aged women’s party identifications are increasingly similar and are moving away
from their older counterparts. This indicates that as society and women’s lives change, so
do their party preferences. Particularly from 1991 on, young and middle-aged unmarried
women have pulled away from their older counterparts, suggesting that there is a link
between partisanship and lifestyle decisions. Because this age range more accurately fits
the circumstances of women’s lives today and permits for a closer examination of the
increasingly similar party identifications of young and middle-aged women, this will be
the age range that I employ in the remainder of my study. I generate a new variable
called AGMS2, which changes the age ranges used from (18-35, 36-65, 66+) to (18-35,
36-49, 50+).
Changing Partisanship of American Women
Figure 4.5 demonstrates the impact of marriage on a woman’s party identification.
Overall, married women are less likely to be Democrats than unmarried women.
Throughout the time period studied, there is an average of an 11.5% difference between
the party identification of young unmarried women and their married counterparts, and an
average of a 12.3% difference between middle-aged married women and middle-aged
unmarried women. However, looking at the “older” age range, there is only an average
of a 3.6% gap, suggesting that the impact of marriage is more important when women are
younger and more likely to be making decisions about their careers, families, and futures,
rather than when they are established in their careers and have passed the age where they
47
would likely be considering having children. Additionally, those older women who have
children are less likely to have children living at home and thus have different concerns
than their younger counterparts.
Unmarried women’s partisanship began to differ greatly from that of their married
peers after the 1960s, and particularly in the 1970s and 1980s, suggesting that this trend
is related to the ways women’s lives began to change greatly in the late 1970s and
1980s—rapidly increasing median age of first marriage and increased first-birth rates for
older women—for instance. This also calls into question contemporary literature which
suggests that young unmarried women have only recently become a unique demographic
as this data shows that young and middle-aged unmarried women have pulled away from
their older counterparts since 1952, with the exception of the 1978-1990 era.
In addition to notable differences between married and unmarried women, the
development of these differences over time is important. The party identification of
unmarried women has changed more dramatically than that of married women, likely
because the lives of unmarried women have changed more greatly over the last sixty
years than the lives of married women. Additionally, married and unmarried women’s
partisanship has trended in opposite directions. Unmarried women have, on average,
become 11.1% more Democratic, while married women have become 5.6% less likely to
identify with the Democratic Party. From 1952 to 1964, young unmarried women and
young married women differed by 4.3%, with married women leaning more toward the
Democratic Party. By 2003 to 2012, young unmarried women differed from young
married women by 16.8% and were more likely to be Democrats. This difference is even
more pronounced in middle-aged women. Between 1952 and 1964, middle-aged married
48
and unmarried women differed in their party identification by only 0.8%, with married
women again being more likely to be Democrats; from 2003 to 2012, there was a 24.4%
difference, with unmarried women far more likely to identify with the Democratic Party.
This again suggests that middle-aged women increasingly have more in common with
younger women than older women, likely due to their changing lifestyles.
49
Changing Partisanship of American Men
Figure 4.6—Evolution of Partisanship Among Unmarried and Married Men
30
35
40
45
50
55
60
65
70
75
1952-1964 1965-1977 1978-1990 1991-2003 2004-2012
%Democrat
Year
Unmarried Men (D)
Young Unmarried Men Middle-Aged Unmarried Men
Older Unmarried Men
30
35
40
45
50
55
60
65
70
75
1952-1964 1965-1977 1978-1990 1991-2003 2004-2012
%Democrat
Year
Married Men (D)
Young Married Men Middle-Aged Married Men
Older Married Men
50
Overall, as Figure 4.6 shows, men’s party identification is far less variant than
women’s in terms of age, year, and marital status. From 1952 to 2012, young married
men and young unmarried men differed in their party identification by an average of
6.9%. Middle-aged married men and middle-aged unmarried men differed, on average,
by 6.8%, and older married and unmarried men by 8%. In each category, except for older
men from 1952 to 1964, married men identified less with the Democratic Party than
unmarried men. This variation is significantly less than women’s variation by marital
status, suggesting that marital status more greatly impacts a woman’s party identification
than a man’s.
In addition, while unmarried women of every age group were more Democratic in
2012 than they were in 1952, only older unmarried men have become more Democratic.
In every other category, on average, men have become less likely to identify with the
Democratic Party since 1952. Married men have become 13.6% less likely to identify as
Democrats, a trend that is in the opposite direction of trend for unmarried females.
Married men have also had much more varied party identification than married women.
Where married women experienced an average trend away from the Democratic Party of
5.6%, married men moved away at an average of 13.5%. This demonstrates that the
partisan gender gap is not just created by women moving toward the Democratic Party,
but also men moving away from the Democratic Party.
The continuity across age ranges throughout the years also suggests that men have
been less impacted by the increasing median age of marriage, increasing first-birth rates
for women over 35, and increasing labor force participation of mothers. While middle-
aged and young women have trended away from their older counterparts in recent years,
51
men of all ages have trended more closely together, suggesting that marital status and age
are less important factors for men when determining their party identification than they
are for women.
Figure 4.7 summarizes the current party identifications of individuals in the
United States. It shows that both men’s and women’s views are impacted by their marital
status and age. Marital status in particular is crucially important as the majority of
unmarried individuals in each age group identify as Democrats, while the majority of
married individuals do not. It also demonstrates that women’s party identifications
(particularly those of middle-aged unmarried women) are more impacted by marital
status and age than men’s. This suggesting that much of the focus on young unmarried
women by the media who frequently assume that young unmarried women only vote
based on the protection of their reproductive rights.
52
Figure 4.7—Impacts of Age, Gender, and Marital Status on Party Identification 2004-2012
40
45
50
55
60
65
70
75
Young Middle-Aged Older
Women (D)
Unmarried Married
40
45
50
55
60
65
70
75
Young Middle-Aged Older
Men (D)
Unmarried Married
53
Tracing Trends in Party of Presidential Vote 1952-2012
To study trends in presidential voting, I recoded the ANES variable on “Party of
Respondent Vote” to include only individuals who voted. I analyze voter turnout in
Chapter 6 below, but for the purposes of this chapter it is crucial to focus attention on
those individuals who did vote. I coded the variable so that either an individual voted
was listed as voting for the Democratic candidate or “other.” My aim is to evaluate the
assertion that young unmarried women are becoming one of the strongest Democratic
voting blocs. One important area in which the pundits are right is in the rapidly
increasing tendency of unmarried women to vote for the Democratic Party. The data
suggests that this trend is true, but with a few qualifications.
First, though the partisanship of young unmarried women has changed the most
drastically since 1952, with unmarried women being 30% more likely to vote for a
Democratic presidential candidate in the 2004 to 2012 era than they were in the 1952 to
1964 era, unmarried women of each age group have substantially moved toward the
voting for the Democratic Party for president since 1952. The party that unmarried
women cast their presidential vote for has changed the more over the last sixty years than
any other group of voters, suggesting that while the party identification of men has
trended away from the Democratic Party contributing to the gender gap in voting, when it
comes party of presidential vote, the gender gap may more greatly occur due to women’s
changing attitudes. These findings are summarized in the following table, Table 4.2.
54
Table 4.1 Summary of Party of Presidential Vote
Demographic Group
Percent Change in
Vote for
Democratic
Presidential
Candidate 1952-
2012
Percent Vote for
Democratic
Presidential
Candidate 2004-
2012
Young Unmarried Women 30 80
Young Married Women 3 54
Middle-Aged Unmarried Women 18 71
Middle-Aged Married Women 3 51
Older Unmarried Women 21 66
Older Married Women 2 49
Young Unmarried Men 5 65
Young Married Men 3 52
Middle-Aged Unmarried Men -7 56
Middle-Aged Married Men 0 52
Older Unmarried Men 3 63
Older Married Men -2 46
It is clear from this table that by far the greatest changes in partisan voting
behavior toward the Democratic Party occurred among unmarried women of all ages.
Figure 4.8 traces the party of presidential vote of individuals over the past sixty years and
reveals several interesting trends. First, it shows that the party of presidential vote of
unmarried women has been trending Democratic for the last forty to fifty years—this is
not a new phenomenon. It also shows that the party of presidential vote of young and
middle-aged unmarried women pulled away from that of older unmarried women
immediately following the lifestyle changes of the late 1970s and early 1980s as well as
the feminist movement. It appears that as women married later, had children later, were
more likely to be working mothers, and had experienced the social and legal
empowerment of the feminist movement, they felt the Democratic presidential candidates
were a better fit for their interests.
55
The long history of young and middle-aged women increasingly voting for
Democratic presidential candidates is also important because it demonstrates that recent
elections were not an anomaly due to candidate or recent events. There was a leap
between the 1991 to 2003 era and the 2004 to 2012 era in almost every demographic
category for Democratic candidates, but this is likely due to the abysmal approval of
President Bush and the overwhelming appeal of President Obama among many groups of
people in 2008. Some of the large jump in unmarried women’s Democratic tendencies
might be attributed to the high-profile female candidates in the 2008 election. However,
because there were women on both sides of the aisle, this more likely influenced the
turnout of women more than their partisanship. This will be discussed in Chapter 6.
Figure 4.8 also demonstrates the consistency of married women, unmarried men,
and married men’s party of presidential votes since 1952. These groups have varied far
less than their unmarried female counterparts over the last sixty years and have also
trended less consistently, responding more to individual eras rather then consistently and
strongly trending toward or away from the Democratic Party.
Ultimately, studying the party of presidential vote of these demographic
breakdowns demonstrates the increasing importance of turning unmarried women for the
Democratic presidential candidate and, as the volume of this demographic grows, the
importance of other parties to reach out to this demographic to be able to win presidential
elections.
56
Figure 4.8 Tracing Party of Presidential Vote 1952-2012
20
30
40
50
60
70
80
90
1952-1964 1965-1977 1978-1990 1991-2003 2004-2012
%VotedforDemocratic
President
Year
Unmarried Women
Young Unmarried Women Middle-Aged Unmarried Women
Older Unmarried Women
20
30
40
50
60
70
80
90
1952-1964 1965-1977 1978-1990 1991-2003 2004-2012
%VotedforDemocratic
President
Year
Married Women
Young Married Women Middle-Aged Married Women
Older Married Women
20
30
40
50
60
70
80
90
1952-1964 1965-1977 1978-1990 1991-2003 2004-2012
%VotedforDemocratic
Candidate
Year
Unmarried Men
Young Unmarried Men Middle-Aged Unmarried Men
Older Unmarried Men
20
30
40
50
60
70
80
90
1952-1964 1965-1977 1978-1990 1991-2003 2004-2012
%VotedforDemocratic
President
Year
Married Men
Young Married Men Middle-Aged Married Men
Older Married Men
57
A Word On Race
In addition to the impacts of age, gender, and marital status shown above, the
inclusion of race as a variable may impact results. To test this I examine the impacts of
age, gender, and marital status among black and white respondents on an individual’s
party of presidential vote. Over the time period studied, more than 80% of black
respondents of all ages, genders, and marital statuses voted for the Democratic
Presidential candidate. These results are shown in Table 4.2. Because there were so few
black respondents in the ANES, I divide the time period studied into two eras—1952 to
1990 and 1991 to 2008—to create a large enough sample size to look at the impacts of
age, gender, and marital status on black individual’s party of presidential vote.
Table 4.2: Summary Party of Presidential Vote—Black Voters
Demographic Group
Percent Vote for
Democratic
Presidential
Candidate 1952-
1990
Percent Vote for
Democratic
Presidential
Candidate 1991-
2008
Young Unmarried Women 95 97
Young Married Women 89 100
Middle-Aged Unmarried Women 93 99
Middle-Aged Married Women 93 94
Older Unmarried Women 90 95
Older Married Women 82 95
Young Unmarried Men 84 91
Young Married Men 84 88
Middle-Aged Unmarried Men 84 95
Middle-Aged Married Men 87 95
Older Unmarried Men 86 96
Older Married Men 92 92
58
This data suggests it is not the changing support of African American respondents that
account for the trends in the impacts of age, gender, and marital status on partisan voting
behavior as there is so little variation among black respondents’ support for Democratic
presidential candidates in the era studied.
I test whether the impacts of age, gender, and marital status remain when only
white respondents are studied. The findings are shown in Figure 4.9 below. Before 1990
there is little to no impact of age, gender, or marital status on party of presidential vote.
By the 1991 to 2008 era stark trends emerge, particularly between married and unmarried
respondents, suggesting that there was likely something about the 1980s that led these
changes to occur so strongly. Additionally, the presence of strong trends among white
voters suggest that the impacts of age, gender, and marital status on voting result from
changing behavior and partisanship of white voters, not from African American voters’
increased participation or partisanship.
59
Figure 4.9: White Respondents’ Partisan Voting Behavior
20
25
30
35
40
45
50
55
60
Young Middle Older
%VotedforDemocrat
White Women 1952-1990
Unmarried Married
20
25
30
35
40
45
50
55
60
Young Middle Older
%VotedforDemocrat
White Men 1952-1990
Unmarried Married
20
25
30
35
40
45
50
55
60
Young Middle Older
%VotedforDemocrat
White Women 1991-2008
Unmarried Married
20
25
30
35
40
45
50
55
60
Young Middle Older
%VotedforDemocrat
White Men 1991-2008
Unmarried Married
60
Conclusion
It is clear from the data presented in this chapter that age, gender, and marital
status all impact an individual’s party identification. Historically, young women’s—and,
increasingly, middle-aged women’s—preferences differ greatly due to their marital
status, while unmarried and married men’s preferences are more similar. Where middle-
aged unmarried women have moved with younger unmarried women closer to the
Democratic Party and away from their older counterparts, men of all ages and marital
statuses (except for older unmarried men) have become increasingly close in their party
affiliations and have all moved noticeably away from the Democratic Party. Each of
these trends is crucially important to an analysis of voting behavior and policy
preferences, particularly when examining how to win elections. Only three groups of
individuals studied here have become markedly more Democratic over the past six
decades—young unmarried women, middle-aged unmarried women, and older unmarried
men—and two of these groups are growing rapidly as the median age of marriage rises.
It will thus be crucially important for Democrats to reach out to and harness these groups
of voters in order to win elections.
Table 4.3 Summary of Support for the Democratic Party
Demographic Group
Percent Change in
Support for
Democratic Party
1952-2012
Percent Support for
Democratic Party
2004-2012
Young Unmarried Women 7 66
Young Married Women -6 49
Middle-Aged Unmarried Women 17 71
Middle-Aged Married Women -8 47
Older Unmarried Women 9 57
Older Married Women -3 47
61
Young Unmarried Men -9 55
Young Married Men -15 43
Middle-Aged Unmarried Men -6 54
Middle-Aged Married Men -15 44
Older Unmarried Men 7 57
Older Married Men -11 43
The increasing support of young and middle-aged unmarried women for
Democratic candidates is understandable when their changing life circumstances are
taken into consideration as these lifestyle changes are more strongly supported by the
Democratic Party. As women delay having children and increasingly work outside of the
home even when they have young children, family planning and reproductive rights are
obviously important. Further, childcare, healthcare, and education are also increasingly
important factors for these women as they consider combining family and work outside
of the home. In the following chapter, I analyze each of these group’s policy preferences
to ascertain what the driving forces are behind these changing party identifications.
62
Chapter 5: Exploring the Impact of Age, Gender, and Marital Status on Policy
Preferences
In this chapter, I present analyses of ANES data to explore the influence of age,
gender, and marital status on policy preferences.35
My focus is on three questions from
the ANES: federal spending on childcare, support for an increase in government spending
and government services for health and education, and views on abortion. I chose these
policies because the literature suggests they may be the policies that create gaps in party
preference between groups of individuals, and also because the analysis in the previous
chapter suggested that changing lifestyles (child birth, marriage, work) have changed,
which should lead to changing preferences. Specifically, I expect to find a substantial
gap between young and middle aged individuals as compared to their older counterparts
in terms of views on federal spending on childcare. I also expect middle-aged
individuals, particularly women, to increasingly care about childcare spending because of
the ways their lifestyles have changed over the past several decades. Finally, I expect
there to be marked gender difference on government spending, as well as a noted impact
of age and marital status on an individuals’ views, as many authors posit that government
spending and services are a primary driver of the gender gap. I expect these trends to
look similar to those seen in party identification, as partisanship is often directly linked to
the role and size of government. I anticipate young and middle-aged unmarried women
will have increasingly similar views on government services and spending, reflecting the
35 All data in this chapter comes from the ANES cumulative data file. The American
National Election Studies (www.electionstudies.org) TIME SERIES CUMULATIVE
DATA FILE [dataset]. Stanford University and the University of Michigan [producers
and distributors], 2012.
63
impact of increased labor force participation of mothers, older median age of first
marriage, and increased first-birth rates for women over 35. I expect there to be the least
gender variance on abortion, as the literature suggests that views on abortion vary little
between genders. However I do expect there to be a marital and age gap. I expect that
movement over time will not reflect the changing lives of American women, but simply
that abortion has become less taboo over the last thirty years that the question was asked.
For this chapter, like the last, I use the following age ranges: “young” represents
individuals 18 to 35 years old, “middle-aged” represents individuals 36 to 49 years old,
and “older” represents individuals 50 and older. Ultimately, I anticipate seeing the most
significant results in opinions on federal spending on childcare and government services
and spending.
Federal Spending on Childcare
The American National Elections survey asks several questions about the
respondent’s views on federal spending in various areas. In this section, I examine a
question from the ANES which asks the respondent if they think federal spending on
childcare should be increased, remain the same, or decrease. This question has been
asked since 1988. I trace trends in opinion of federal spending on childcare for each
group in AGMS2 to find trends over time. The results confirm many hypotheses laid out
at the beginning of this section and remain consistent with findings in previous chapters.
In each group, young individuals are 13-16% more likely to support increased federal
funding for childcare than their older counterparts. Young unmarried women are, on
average, 14% more likely to favor increased federal funding for childcare than older
unmarried women. Young married women are, on average, 17% more likely to favor
64
increased federal funding for childcare than older married women. Young unmarried
men are, on average, 13% more likely to favor increased federal funding for childcare
than older unmarried men. Finally, young married men are, on average, 13% more likely
to support increased funding for childcare than older married men. Additionally, in each
combination of gender and marital status, young-and middle-aged individuals’ views
have moved together.
65
Figure 5.1 Evolution of Support for Increased Federal Spending on Childcare Among Unmarried and Married Women
35
40
45
50
55
60
65
70
75
1978-1990 1991-2003 2004-2012
%SupportIncreasedFunding
Years
Unmarried Women
Young Unmarried Women Middle-Aged Unmarried Women
Older Unmarried Women
35
40
45
50
55
60
65
70
75
1978-1990 1991-2003 2004-2012
%SupportIncreasedFunding
Years
Married Women
Young Married Women Middle-Aged Married Women
Older Married Women
66
Figure 5.1 shows several important trends, both when assessing the impacts of
marital status, age, and gender on one’s policy preferences, but also how these impacts
have changed over time. It is unsurprising that there was a decline in support for
increased spending in the 1991 to 2003 era, as it contains the majority of the Clinton era
of welfare reform and a balanced budget and entered into the Bush era of no new taxes
and a desire for a smaller government. However, while each of the groups’ support for
increased federal funding on childcare dropped, what is particularly interesting is the rate
at which these drops occurred. While one would expect young unmarried and young
married women to be the most supportive of federal funding for childcare, these groups
experienced the steepest declines. Young unmarried women’s support for increased
federal funding of childcare decreased by 10% from 1978 to 2012, whereas middle-aged
unmarried women’s support dropped 4%, and older unmarried women’s support dropped
a less than 1%. The picture is slightly different for married women. Young married
women’s support dropped 13%, middle-aged women’s support dropped 9%, and older
women’s support dropped 11%.
While these drops are in and of themselves important, what they mean for the
relationships between age groups is more telling. The steep drop in support by young
women, and the slower decrease in support by middle-aged women, particularly middle-
aged unmarried women, has led young and middle-aged unmarried women to have nearly
identical preferences. This supports the hypothesis that middle-aged women increasingly
have similar concerns to their younger peers as a result of older ages of first marriage,
increased first-birth rates for women over 35, and increased labor force participation of
mothers. As people become parents older, older individuals have to take into
67
consideration the cost of childcare and thus would be more likely to support an increase
in federal funding for childcare. It is also important to note that in each age group,
unmarried individuals were more likely to support increased federal funding for childcare
for two primary reasons. They might be considering future families and have established
careers that they would like to retain even after having children necessitating some form
of childcare. Alternatively, they are unmarried parents who rely on childcare to be able
to both parent and work.
68
Figure 5.2 Evolution of Support for Increased Federal Funding for Childcare Among Unmarried and Married Men
30
35
40
45
50
55
60
65
1978-1990 1991-2003 2004-2012
%SupportIncreasedFunding
Years
Unmarried Men
Young Unmarried Men Middle-Aged Unmarried Men
Older Unmarried Men
30
35
40
45
50
55
60
65
1978-1990 1991-2003 2004-2012
%SupportIncreasedFunding
Years
Married Men
Young Married Men Middle-Aged Married Men
Older Married Men
Maggie Morrow Honors Thesis

More Related Content

Viewers also liked

Undergraduate Thesis
Undergraduate ThesisUndergraduate Thesis
Undergraduate ThesisKailey Kumm
 
Summary Of Bachelor Thesis
Summary Of Bachelor ThesisSummary Of Bachelor Thesis
Summary Of Bachelor ThesisAgne Valeckaite
 
Political Science Bachelor Thesis Stina Ahnlid
Political Science Bachelor Thesis Stina AhnlidPolitical Science Bachelor Thesis Stina Ahnlid
Political Science Bachelor Thesis Stina AhnlidStina Ahnlid
 
Data-Mining Twitter for Political Science -Hickman, Alfredo - Honors Thesis
Data-Mining Twitter for Political Science -Hickman, Alfredo - Honors ThesisData-Mining Twitter for Political Science -Hickman, Alfredo - Honors Thesis
Data-Mining Twitter for Political Science -Hickman, Alfredo - Honors ThesisAlfredo Hickman
 
Overview of the Possibilities of Quantitative Methods in Political Science
Overview of the Possibilities of Quantitative Methods in Political ScienceOverview of the Possibilities of Quantitative Methods in Political Science
Overview of the Possibilities of Quantitative Methods in Political Scienceenvironmentalconflicts
 
Final thesis presented december 2009 march 2010
Final thesis presented december 2009 march 2010Final thesis presented december 2009 march 2010
Final thesis presented december 2009 march 2010Lumbad 1989
 
Related Literature and Related Studies
Related Literature and Related StudiesRelated Literature and Related Studies
Related Literature and Related StudiesJenny Reyes
 
Hillary clinton's 1969 Political Science thesis
Hillary clinton's 1969 Political Science thesisHillary clinton's 1969 Political Science thesis
Hillary clinton's 1969 Political Science thesisSteven Montgomery
 

Viewers also liked (10)

Undergraduate Thesis
Undergraduate ThesisUndergraduate Thesis
Undergraduate Thesis
 
Summary Of Bachelor Thesis
Summary Of Bachelor ThesisSummary Of Bachelor Thesis
Summary Of Bachelor Thesis
 
Political Science Bachelor Thesis Stina Ahnlid
Political Science Bachelor Thesis Stina AhnlidPolitical Science Bachelor Thesis Stina Ahnlid
Political Science Bachelor Thesis Stina Ahnlid
 
Data-Mining Twitter for Political Science -Hickman, Alfredo - Honors Thesis
Data-Mining Twitter for Political Science -Hickman, Alfredo - Honors ThesisData-Mining Twitter for Political Science -Hickman, Alfredo - Honors Thesis
Data-Mining Twitter for Political Science -Hickman, Alfredo - Honors Thesis
 
Overview of the Possibilities of Quantitative Methods in Political Science
Overview of the Possibilities of Quantitative Methods in Political ScienceOverview of the Possibilities of Quantitative Methods in Political Science
Overview of the Possibilities of Quantitative Methods in Political Science
 
Chapter 2
Chapter 2Chapter 2
Chapter 2
 
Final thesis presented december 2009 march 2010
Final thesis presented december 2009 march 2010Final thesis presented december 2009 march 2010
Final thesis presented december 2009 march 2010
 
Related Literature and Related Studies
Related Literature and Related StudiesRelated Literature and Related Studies
Related Literature and Related Studies
 
Hillary clinton's 1969 Political Science thesis
Hillary clinton's 1969 Political Science thesisHillary clinton's 1969 Political Science thesis
Hillary clinton's 1969 Political Science thesis
 
Thesis elaine
Thesis elaineThesis elaine
Thesis elaine
 

Similar to Maggie Morrow Honors Thesis

Pew Research: on Democracy 2024 report and findings
Pew Research: on Democracy 2024 report and findingsPew Research: on Democracy 2024 report and findings
Pew Research: on Democracy 2024 report and findingsEnergy for One World
 
For this discussion, you will use a census website that posts info
For this discussion, you will use a census website that posts infoFor this discussion, you will use a census website that posts info
For this discussion, you will use a census website that posts infoShainaBoling829
 
Research Methods: Data Analysis
Research Methods: Data AnalysisResearch Methods: Data Analysis
Research Methods: Data AnalysisBhumi Patel
 
U.s. government lecture#5
U.s. government lecture#5U.s. government lecture#5
U.s. government lecture#5Amanda Bartley
 
Pol 140 public_opinion Full 140 SP15
Pol 140 public_opinion Full 140 SP15Pol 140 public_opinion Full 140 SP15
Pol 140 public_opinion Full 140 SP15atrantham
 
Gender Equality in Political Youth & Student Organizations_Research
Gender Equality in Political Youth & Student Organizations_ResearchGender Equality in Political Youth & Student Organizations_Research
Gender Equality in Political Youth & Student Organizations_ResearchRakesh Karna
 
Pol 140 public_opinion
Pol 140 public_opinionPol 140 public_opinion
Pol 140 public_opinionatrantham
 
PLAP 4150 Research Report
PLAP 4150 Research ReportPLAP 4150 Research Report
PLAP 4150 Research ReportLauren Bryant
 
Public Opinion
Public Opinion Public Opinion
Public Opinion atrantham
 
Pol 140 public_opinion half 140 sp15
Pol 140 public_opinion half 140 sp15Pol 140 public_opinion half 140 sp15
Pol 140 public_opinion half 140 sp15atrantham
 
Hidden Tribes Report: A Study of America’s Polarized Landscape
Hidden Tribes Report: A Study of America’s Polarized LandscapeHidden Tribes Report: A Study of America’s Polarized Landscape
Hidden Tribes Report: A Study of America’s Polarized LandscapeJonathan Dunnemann
 
Data analysis research (relatability study)
Data analysis research (relatability study)Data analysis research (relatability study)
Data analysis research (relatability study)Joseph White MPA CPM
 
Political Ideological Divides and Actual Views
Political Ideological Divides and Actual ViewsPolitical Ideological Divides and Actual Views
Political Ideological Divides and Actual ViewsMichael Silverman
 
PS 371 Research Project
PS 371 Research ProjectPS 371 Research Project
PS 371 Research ProjectMarian Rushton
 
Competency Assessment RubricAll competency criteria must be met to
Competency Assessment RubricAll competency criteria must be met toCompetency Assessment RubricAll competency criteria must be met to
Competency Assessment RubricAll competency criteria must be met toLynellBull52
 

Similar to Maggie Morrow Honors Thesis (19)

Politics Have Failed Us
Politics Have Failed UsPolitics Have Failed Us
Politics Have Failed Us
 
Pew Research: on Democracy 2024 report and findings
Pew Research: on Democracy 2024 report and findingsPew Research: on Democracy 2024 report and findings
Pew Research: on Democracy 2024 report and findings
 
FinalThesis
FinalThesisFinalThesis
FinalThesis
 
For this discussion, you will use a census website that posts info
For this discussion, you will use a census website that posts infoFor this discussion, you will use a census website that posts info
For this discussion, you will use a census website that posts info
 
Research Methods: Data Analysis
Research Methods: Data AnalysisResearch Methods: Data Analysis
Research Methods: Data Analysis
 
U.s. government lecture#5
U.s. government lecture#5U.s. government lecture#5
U.s. government lecture#5
 
Pol 140 public_opinion Full 140 SP15
Pol 140 public_opinion Full 140 SP15Pol 140 public_opinion Full 140 SP15
Pol 140 public_opinion Full 140 SP15
 
2013 Rockefeller Center NH State of the State Poll
2013 Rockefeller Center NH State of the State Poll2013 Rockefeller Center NH State of the State Poll
2013 Rockefeller Center NH State of the State Poll
 
2018 CEO Activism Survey
2018 CEO Activism Survey2018 CEO Activism Survey
2018 CEO Activism Survey
 
Gender Equality in Political Youth & Student Organizations_Research
Gender Equality in Political Youth & Student Organizations_ResearchGender Equality in Political Youth & Student Organizations_Research
Gender Equality in Political Youth & Student Organizations_Research
 
Pol 140 public_opinion
Pol 140 public_opinionPol 140 public_opinion
Pol 140 public_opinion
 
PLAP 4150 Research Report
PLAP 4150 Research ReportPLAP 4150 Research Report
PLAP 4150 Research Report
 
Public Opinion
Public Opinion Public Opinion
Public Opinion
 
Pol 140 public_opinion half 140 sp15
Pol 140 public_opinion half 140 sp15Pol 140 public_opinion half 140 sp15
Pol 140 public_opinion half 140 sp15
 
Hidden Tribes Report: A Study of America’s Polarized Landscape
Hidden Tribes Report: A Study of America’s Polarized LandscapeHidden Tribes Report: A Study of America’s Polarized Landscape
Hidden Tribes Report: A Study of America’s Polarized Landscape
 
Data analysis research (relatability study)
Data analysis research (relatability study)Data analysis research (relatability study)
Data analysis research (relatability study)
 
Political Ideological Divides and Actual Views
Political Ideological Divides and Actual ViewsPolitical Ideological Divides and Actual Views
Political Ideological Divides and Actual Views
 
PS 371 Research Project
PS 371 Research ProjectPS 371 Research Project
PS 371 Research Project
 
Competency Assessment RubricAll competency criteria must be met to
Competency Assessment RubricAll competency criteria must be met toCompetency Assessment RubricAll competency criteria must be met to
Competency Assessment RubricAll competency criteria must be met to
 

Maggie Morrow Honors Thesis

  • 1. 1 If I Get Married Will I Become a Republican?: The Impact of Age, Gender, and Marital Status on Party Identification, Policy Preference, and Voting Behavior Draft Version of April 30, 2015 An Honors Thesis for the Department of Political Science Magdelena Morrow Tufts University, 2015
  • 2. 2 Abstract If I Get Married Will I Become a Republican?: The Impact of Age, Gender, and Marital Status on Party Identification, Policy Preference, and Voting Behavior Magdelena Morrow, Department of Political Science, Class of 2015 Thesis Committee: Professor Richard Eichenberg, Professor Jeffrey Berry This thesis examines the impacts of age, gender, and marital status on an individual’s party identification, policy preferences, and political participation. Focusing on the trends in preferences, behaviors, and lifestyles of young and middle-aged unmarried women as compared to other demographic groups, I offer insight into how marital status, age, and gender impact an individual’s political identity. Through quantitative analysis, I confirm that each of these factors—age, gender, and marital status—deeply impact an individual’s party identification, policy preferences, and political participation. I also identify the importance of the lifestyle changes of women beginning in the late 1970s and early 1980s related to older median age of marriage, higher first-birth rates for women over 35, and increased labor force participation of mothers. Finally, I argue that, due to these lifestyle changes, it will be increasingly important to finely study the factors that impact young and middle-aged women’s preferences to reach one of the fastest-growing voting blocs in the nation.
  • 3. 3 Table of Contents Tables and Figures ....................................................................................................5 Chapter 1: Introduction: The Importance of Age, Gender, and Marital Status in American Campaigns ................................................................................................7 Chapter 2: Age, Gender, and Marital Status in Public Opinion: Separating Evidence from Stereotypes ......................................................................................12 Gender: Party Identification, Policy Preference, and Political Participation........................................13 Marital Status: Party Identification, Policy Preferences, and Political Participation.........................19 Age: Party Identification, Policy Preferences, and Political Participation............................................25 Conclusions...............................................................................................................................................................27 Chapter 3: Research Design ....................................................................................29 Data Source ...............................................................................................................................................................29 Coding Age, Gender, and Marital Status.........................................................................................................31 Dependent Variable 1: Party Identification.....................................................................................................33 Dependent Variable 2: Policy Preference........................................................................................................34 Dependent Variable 3: Voting Behavior..........................................................................................................34 Chapter 4: The Impact of Age, Gender, and Marital Status on Party Identification .................................................................................................................................37 The Changing Lives of American Women......................................................................................................37 Increasing Birthrates for Women Over 35.......................................................................................................38 Mothers’ Labor Force Participation..................................................................................................................40 Summary: The Lives of American Women........................................................................................................41 Recoding Age ...........................................................................................................................................................42 Changing Partisanship of American Women..................................................................................................46 Changing Partisanship of American Men........................................................................................................49 Tracing Trends in Party of Presidential Vote 1952-2012...........................................................................53 A Word On Race .....................................................................................................................................................57 Conclusion.................................................................................................................................................................60 Chapter 5: Exploring the Impact of Age, Gender, and Marital Status on Policy Preferences ..............................................................................................................62 Federal Spending on Childcare...........................................................................................................................63 Government Spending and Services..................................................................................................................73 Abortion......................................................................................................................................................................82 Conclusion.................................................................................................................................................................85 Chapter 6: The Impact of Age, Gender, and Marital Status on Voter Turnout and Political Participation Beyond Voting......................................................................88 Voter Turnout ...........................................................................................................................................................89 Conclusions ...................................................................................................................................................................94 Political Participation Beyond Voting ..............................................................................................................97 Conclusions............................................................................................................................................................ 101 Chapter 7: Conclusions .........................................................................................103 Summary of Findings.......................................................................................................................................... 103 Implications for Political Campaigns and Candidates.............................................................................. 106 Suggestions for Future Research..................................................................................................................... 107
  • 4. 4 Appendix A: ANES Time series Cumulative Data File Variables Used.................111 Works Cited ..........................................................................................................112
  • 5. 5 Tables and Figures Table 3.1 Individual variables combining age, gender and marital status 31 Table 3.2 Dependent Variable 1—Party Identification 33 Table 3.3 Dependent Variable 2—Policy Preference 34 Table 3.4 Dependent Variable 3—Political Participation 35 Figure 4.1 Trends in Birthrates 38 Figure 4.2 Trends in Marriage 40 Figure 4.3 Trends in Mothers’ Labor Force Participation 41 Figure 4.4 Evolution of Partisanship Among Unmarried and Married Women (18- 35, 36-65, 66+) 43 Figure 4.5 Evolution of Partisanship Among Unmarried and Married Women (18- 35, 36-49, 50+) 45 Figure 4.6 Evolution of Partisanship Among Unmarried and Married Men 49 Figure 4.7 Impacts of Age, Gender, and Marital Status on Party Identification 2004-2012 52 Table 4.1 Summary of Party of Presidential Vote 54 Figure 4.8 Tracing Party of Presidential Vote 1952-2012 56 Table 4.2 Summary Party of Presidential Vote--Black Voters 57 Figure 4.9 White Respondents' Partisan Voting Behavior 59 Table 4.3 Summary of Support for the Democratic Party 60 Figure 5.1 Evolution of Support for Increased Federal Spending on Childcare Among Unmarried and Married Women 65 Figure 5.2 Evolution of Support for Increased Federal Spending on Childcare Among Unmarried and Married Men 68 Table 5.1 Summary of Attitudes Toward Increased Federal Funding for childcare 71 Figure 5.3 Summary for Support for Increased Federal Funding for Childcare 2004-2012 72 Figure 5.4 Evolution of Support of Increased Government Spending and Services Among Married And Unmarried Women 75 Figure 5.5 Evolution of Support of Increased Government Spending and Services Among Married And Unmarried Men 78 Figure 5.6 Support for Increased Government Spending and Services 2004-2012 80 Table 5.2 Summary of Attitudes Toward Increased Government Spending and Services 81 Figure 5.7 Evolution of Individuals Identifying as “Pro-Choice” 83 Figure 6.1 Evolution of Voter Turnout Among Married and Unmarried Women 91 Figure 6.2 Evolution of Voter Turnout Among Married and Unmarried Men 93 Table 6.1 Summary of Voter Turnout 95 Figure 6.3 Summary of Voter Turnout 2004-2012 96 Figure 6.4 Evolution of Political Participation Beyond Voting 98
  • 6. 6 Table 6.2 Summary of Political Participation Beyond Voting 100
  • 7. 7 Chapter 1: Introduction: The Importance of Age, Gender, and Marital Status in American Campaigns A glance at the Huffington Post, Politico, or other political blogs draws one’s attention to a recently identified potential voting bloc in American politics: young, unmarried women. Pundits and politicians alike have identified this group of people as crucial voters for winning elections. Most notably, pollster Stanley Greenberg published a series of reports and articles on why unmarried women would be a key demographic for the Democratic Party if they hoped to win the midterm elections in 2014.1 Pinpointing specific groups of voters upon which to focus a campaign’s attention is not a new phenomenon, but with each election cycle, these groups become narrower and more scientifically identified. Since the advent of scientific public opinion polling in the United States, electoral politics has developed its own form of math, often referred to as electoral calculus. As public opinion polls become more reliable and more prevalent, campaigns increasingly use polling to ascertain what views their constituents hold and what issues they care most about. This permits candidates to run campaigns that are more tailored to their identified electorates. Campaigns once had to start with a blank slate of voters in their districts and manually narrow their focus to supporters they found individually, by hand. Now, the majority of campaigns use software developed by their political party in order to more carefully make use of the candidate’s time and to eliminate wasted energy. More simply put, campaigns strive to “run smart, not hard.” 1 Stanley Greenberg and Erica Seifert, “”Why Unmarried Women Are the Key to 2014: But not for the reasons many Democrats seem to think,” Politico Magazine, April 15, 2014, accessed October 18, 2014, http://www.politico.com/magazine/story/2014/04/democrats-single-women- 105719.html#.VJHgIWTF9tI, 1.
  • 8. 8 Each year, campaigns’ metrics become more and more complex as further studies are conducted, new research is released, and an increased investment in voter identification software is made. National party committees, such as the Democratic Congressional Campaign Committee (DCCC), now invest thousands of dollars each year to develop increasingly advanced voter-targeting software. This simplifies the process of identifying supporters by allowing politicians to take a candidate’s entire geographic constituency—the group of people who live and vote in a given area—and more accurately pinpoint likely voters for their candidate’s reelection constituency.2 The reelection constituency consists of the people in a district who a representative considers his or her supporters.3 As technology advances and scholarship develops, the clusters can become more nuanced. This thesis focuses on one such group: young, unmarried women. While scholars have studied the impact of age, marital status, and gender separately on individuals’ party identification, policy preferences, and political participation, little research has been done on the increasingly discussed intersection of the three. The 2008 and 2012 presidential elections alerted political strategists to the potential electoral importance of the intersection of age, marital status, and gender—particularly young, unmarried women. Voter participation research suggests that young, unmarried women are highly likely to vote for a Democratic candidate, but inconsistently turn out to vote at all. They appear to be one of the strongest voting blocks for the Democratic Party if they are convinced to 2 Merriam-Webster Online, s.v. “Constituency,” accessed October 1, 2014 http://www.merriam-webster.com/dictionary/constituency. 3 Richard F. Fenno, Jr. “U.S. House Members in Their Constituencies: An Exploration,” The American Political Science Review, 71(1977): 886.
  • 9. 9 turn out and vote. The DCCC has gone so far as to invest in developing a new data program, “ROSIE,” that is dedicated to getting this group to the polls.4 However, scholarly work has not caught up to that of campaigns and national parties. First, there is little consensus as to what factors truly drive this group’s decision making. Are their preferences, as many assume, based on their desire to protect their reproductive rights or are they, as recent research has shown, more linked to their economic status as unmarried women?5 Before the assertions made in popular articles about how “All the Single Ladies” are used to drive campaigns, rigorous research must be done on whether this group truly represents a distinct and important voting bloc, and if so, to whom. This thesis examines three groups of questions to develop knowledge of how and why young, unmarried women differ from other groups of voters. My research centers on these three governing questions: 1. When did young, unmarried women become a differentiated voting bloc? What are the historical trends in young, unmarried women’s party identification, policy preferences, and political behavior? Are there peaks or valleys surrounding certain historical events? 2. On what issues do young, unmarried women differ from other demographic groups in the electorate? What policy preferences separate young, unmarried women from the rest of the electorate or from other constituency groups? Are young, unmarried women more likely to diverge on social issues, economic 4Kelly Ward, ICYMI: DCCC Executive Director Kelly Ward Unveils the “Rosie” Model, DCCC Blog, May 5, 2014 accessed October 21, 2014 http://archive.dccc.org/blog/entry/icymi_dccc_executive_director_kelly_ward_unve ils_the_rosie_model/. 5 Greenberg and Seifert, “Why Unmarried Women Are the Key to 2014.”
  • 10. 10 issues, or other policy areas? 3. How can campaigns use this information to get this group of voters to turnout on Election Day? Using these findings, how can campaigns mobilize this group in coming elections and focus their messaging to convince them to vote and volunteer? Young, unmarried women showed up to vote en masse in 2012, but few plan to vote in 2014. In studying young, unmarried women as a voting bloc it is possible to discover in what ways they differ from other groups of voters and effectively persuade them to vote for a given candidate. . However, if my research suggests that young, unmarried women do not differ substantially from other voting blocs, campaigns and national parties should stop focusing on this group as an important constituency for winning campaigns and should seek out other demographics. Identifying what issues decide particular groups’ preferences helps representatives and candidates understand the American people better. By tracing developments over time, one can establish a historical explanation for changes in American political consciousness for different groups of people. Ultimately, these questions need answers so that political strategists not only have a better idea of how to effectively build their data models, but also have a well-rounded and well-researched knowledge base about whether or not their efforts should be focused on this group—young, unmarried women—in the first place. This thesis also develops a framework and methodology for other researchers to combine different variables to test the preferences, history, and affiliations of other combined demographics.
  • 11. 11 My thesis is organized as follows. My second chapter analyzes the existing literature on gender, marital status, age, and political behavior to identify gaps in extant scholarship and to guide the analysis in subsequent chapters. My third chapter outlines my methodology, identifies and explains my choice of dataset, and defines my independent and dependent variables chosen based on literature and availability in time series polls. My empirical chapters—chapters 4, 5, and 6—each focus on one dependent variable, party identification, policy preferences, and political participation. I conclude with chapter 7 detailing what the conclusions of my empirical chapters mean for politicians and political parties looking to target voters and win elections.
  • 12. 12 Chapter 2: Age, Gender, and Marital Status in Public Opinion: Separating Evidence from Stereotypes Gender, marital status, and age represent three distinct factors that appear to impact an individual’s party identification, policy preferences, and political participation. Each of these variables presents a straightforward way to compare easily categorized groups of people. A great deal of literature exists surrounding each of these categories of voters. The field of gender studies substantially contributes to questions about gender differences in public opinion and informs political research on party identification, policy preferences, and political participation. Literature on the gender gap in politics is perhaps the most rounded subfield of my research. Scholars, researchers, and political strategists have developed complex models and theories to explain political differences between men and women. However, missing from the literature is research on differences among genders (i.e. why some women hold different views and beliefs than other women)—not between genders (i.e. why some men and women differ in political preferences). It is this important intersection that I examine at length. A number of studies have also been written about the impact of both age and marital status on political preferences. These works, though frequently heavy in assumptions and lacking in objectivity, provide a background as to how scholars should evaluate different definitions of marital status to develop the most methodologically sound studies and how age should be best divided to discover meaningful trends. In exploring each subfield, I have been able to build upon the research of past scholars, replicate portions of their statistical models that I find most effective, and avoid common errors in studies of public opinion. I organize the literature review by examining each subfield—gender, marital status, and age—while noting any scholarly work that studies a
  • 13. 13 combination of subfields in order to create a knowledge base from which to study the intersection. Gender: Party Identification, Policy Preference, and Political Participation One important conclusion from the literature on gender differences is the necessity of leaving behind preconceived notions and ideas about what may cause men and women to vote differently. Not only is it easy to make assumptions about public opinion based on one’s own views and life experiences, but there is also a plethora of popular articles that rely on unsound data and baseless assumptions. As Sapiro and Conover explain in their article on gender and public opinion, “much of the exaggeration of gender difference…is caused by the fact that our day-to-day sources of information about how the public thinks are drawn from evidence derived from political and cultural elites, including interest group activists and journalists.”6 For this reason, much of the literature on gender differences in political participation, party identification, and policy preferences is dedicated to debunking common misconceptions. Several factors play a large role in the media’s characterization of voting behavior and partisanship, despite the fact that they have been largely discredited by scholars; these include inherent genetic and biological imperatives, women’s higher propensity for empathy, women’s likelihood of voting based on personality rather than policy, women’s inherent distaste for violence, and women’s natural urge to vote exclusively based upon reproductive rights and other “women’s issues.” Sapiro and Shames open their article on gender and public opinion, “The Gender Basis of Public Opinion,” by explicitly acknowledging that, “conventional 6 Virginia Sapiro and Pamela Johnston Conover, “The Variable Gender Basis of Electoral Politics: Gender and Contexts in the 1992 US Election,” British Journal of Political Science, 27 (1997): 522.
  • 14. 14 wisdom, and even some academic discussion, is intertwined with stereotypes.”7 Literature focuses on fighting against common assumptions about both gender and politics by rigorously researching potential causes and outcomes. Before it is even possible to discuss questions about voting trends or policy preferences, methodology must be informed by scholarship, not stereotypical assumptions, as to why these gender differences occur. Many authors of scholarly and popular articles suggest that genetic and biological imperatives greatly contribute to the gender gap or the differences between men and women in party identification, policy preferences, and political participation. These authors argue that men and women are simply “wired” differently and therefore have different goals and desires in every aspect of their being, including their political tendencies.8 It seems like a simple enough argument to make—men and women are different because of their biology—so why would this not be the reason they have different views and preferences? Nearly every modern scholar who has researched the gender gap, however, debunks the idea that biology could be principally responsible for the gender gap in voter turnout, party identification, or policy preferences. Scholars argue that biological differences cannot explain these disparities because, though there are marked gaps in opinion, there is still more overlap between men and women on every issue than there is disparity. This does not mean that the gender gap is rendered irrelevant, as “the difference of even 8-10 percentage points can determine the outcome 7 Virginia Sapiro and Shauna Shames, “It's the context, situation, and question, stupid: The gender basis of public opinion”, Understanding Public Opinion, ed. Barbara Norrander and Clyde Wilcox, (Washington DC: Congressional Quarterly Press, 2009), 5. 8 Francis Fukuyama, “Women and the Evolution of World Politics”, Foreign Affairs, 77 (1998): 27.
  • 15. 15 of elections.”9 It is these margins that campaigns target to swing the vote to their candidates and win elections. The gap is important for winning elections, but the overlap determines that biology cannot be the deciding factor in the differences between men’s and women’s political preferences and affiliations. Researchers also note that gender differences in opinion vary over time, suggesting that opinions and views reflect something larger and more systemic than genetic-level variations.10 While a biological explanation may provide a simple answer, it is not an empirically supported conclusion and thus cannot be a basis for further scholarship. It has also been demonstrated by several scholars that a candidate’s personal charm and the emotional response they evoke factor more greatly into a women’s decision than a man’s. Anderson counters this claim by demonstrating that more employed women turned out for Nixon than for Kennedy in 1960, suggesting that Kennedy’s charm cannot account for women’s increase in participation from 1956 to 1960. Sapiro and Conover further examine the argument that women are more likely to vote based on their emotions than men. They use the National Elections Study’s questions on “what emotional reactions the two major party candidates evoked in them” as well as questions that dealt with key concepts in campaign rhetoric such as moralism and egalitarianism.11 Their findings do not support the notion that women are more likely to vote for a candidate based upon an emotional response. In fact, they find that emotional response has little bearing at all except when men were asked about defense 9 Leonie Huddy, Erin Cassese, and Mary-Kate Lizotte, “Gender, Public Opinion, and Political Reasoning,” in Political Women and American Democracy, ed. Christina Wolbrecht, Karen Beckwith, and Lisa Baldez, (Cambridge: Cambridge University Press, 2008), 31. 10 Sapiro and Shames, 25. 11 Sapiro and Conver, “Variable Gender Basis,” 509.
  • 16. 16 attitudes, suggesting that men may be swayed more by emotional response than women. Emotional response to a candidate and candidate’s charm are not statistically supported explanations for the presence of the gender gap in voting behavior, and thus will not be a critical part of my study. In their work, Sapiro and Conover describe three approaches to the gender gap: positional, structural, and contextual. Simply put, those who put forward positional arguments suggest that men and women take into consideration the same factors when making electoral decisions, but simply have different positions on those factors. Those on the structural side of the argument say that women and men simply take different factors into consideration and place weight on different factors due to their distinct roles in society. This explanation suggests that men and women make different judgments not because they have inherently opposing views and values, but because they place importance on different issues when making political decisions. While a positional approach would lead men and women to simply vote differently, “structural explanations allow for men and women to vote similarly, but for different reasons.”12 The third factor that they consider is contextual, that the electoral context of any given election is different and highlights different issues. The 1992 election, which they use as their case study, was referred to as “The Year of the Woman” because campaigns focused heavily on traditional women’s issues, such as reproductive rights and workplace harassment, and the end of the Cold War ushered in a more peaceful era in international relations more in- 12 Ibid., 499.
  • 17. 17 line with women’s views on foreign policy.13 Sapiro and Conover find merit in each of these explanations, and it is important to keep each of them in mind when conducting studies that measure the differences in political attitudes and policy preferences between groups of individuals. There research is also a caution to remain mindful of and study the electoral context of a given time period or election when using it in my study. Scholars seem to agree that the gender gap became an important political phenomenon beginning in the early 1970s. There are several reasons this era was important. It was around this time that the gender gap in political participation began to decrease and ultimately reverse. Before the 1970s, far more men than women voted, so the women’s vote made up far less of the electorate. Therefore, there were not enough women voting to truly create a gender gap; they simply did not comprise enough of the electorate to make an aggregate difference in the outcome of elections. Immediately following the emergence of the gender gap, women identified more with the Democratic Party. The 1980s provided fascinating case studies for this developing phenomenon. Marty Gilens uses the 1980 election to study gender differences because in that election, though more women supported Reagan than other Republican candidates over the last five decades, “9.6 percent fewer women than men voted for Ronald Reagan.”14 In every other presidential election since 1960, the majority of women voted for the Democratic candidate and, except for 1992 and 1996, men 13 Michael X. Delli Carpini and Bruce A. Williams, “The Year of the Woman? Candidates, Votes and the 1992 Elections,” in Political Science Quarterly, 108 (1993), 32-33. 14 Martin Gilens, “Gender and Support for Reagan: A Comprehensive Model of Presidential Approval,” American Journal of Political Science, 32 (1988): 19.
  • 18. 18 supported the Republican over the Democratic candidate.15 This provides a reminder of a danger in studying gender: making the assumption that gender means woman. Because more men than women voted for President Reagan does not mean necessarily that women became more liberal. It could, in fact, point to men becoming more conservatively minded. In his work, Daniel Wirls looks at the intersection of age and gender finding that, “young women are dividing themselves between the two parties in roughly the same proportions as all adult Americans have for many years…young men are now going against the grain of the American electorate of recent history by identifying themselves as Republicans much more than Democrats.”16 While the electoral outcome is the same, discovering the root of gaps in voting trends is the key to understanding how to mobilize voters for one’s candidate and also to study other permutations of voting gaps. It is important to remember that the gender gap could stem from differences in views of either gender, not just women. Work on the gender gap also greatly informs my methodology as much of the research these scholars do is similar to mine, simply with different combinations of variables and questions. Most authors divide the types of questions they ask into categories such as partisan identification, policy opinions, electoral preferences, and ideology. These primary categories directly relate to my questions and their results and types of questions asked directly inform my selection of questions. The majority of empirically sound studies that study the gender gap over time also employ the American National Elections Study, the dataset I use in my own research. Marty Gilens makes a 15 Huddy, Cassesse, and Lizotte, “Gender, Public Opinion, and Political Reasoning,” 47. 16 Daniel Wirls, “Reinterpreting the Gender Gap,” The Public Opinion Quarterly, 50 (1986): 328.
  • 19. 19 particularly salient point about analysis of public opinion polls. He asserts that using a 4 point scale for analyzing opinion rather than a dichotomous agree or disagree allows for much more detailed analysis without the necessity of complex mathematics. Scholars also note the increased participation and engagement of women when they have the opportunity to vote for at least one female candidate. While this is an important question and merits extensive further research, it does not fall within the parameters of this study. Literature on the gender gap informs my study by steering my work away from common pitfalls made by scholars, such as over-reliance on stereotypes, focusing on “gender” meaning “women,” the scholarly consensus that the gender gap truly began to gain importance in the 1970s, and the added benefits of not using dichotomous variables, but including larger scales to study the degree to which individuals adhere to certain positions. My study contributes by adding in the variables of age and marital status to extant gender scholarship and examines how important gender is as compared to the other two factors of my variables. Marital Status: Party Identification, Policy Preferences, and Political Participation Because there is less of a collective understanding of the apparent causes and effects of a marriage gap in political behavior, and because there has been less scholarship dedicated to its development, there is less information to cover and fewer stereotypes to debunk surrounding the political participation, party identification, and policy gaps between married and unmarried individuals. For this reason, I focus on the methodological lessons from the scholars who have studied this phenomenon, as well as the conclusions that they reach. It is apparent that there is a marriage gap in voting preferences. In the 1984
  • 20. 20 presidential election, 63% of married people voted for the Republican candidate, while only 45% of never-married voters did.17 At the time, this didn’t create a large difference in the election overall because only 26% of the electorate wasn’t married at the time. Only 51% of adults in the United States are currently married, whereas in 1960, 72% of adults were married.18 This decline in marriage rates is seen across the spectrum, but is especially prevalent in young people. If this trend away from marriage continues it will be increasingly important to continue to learn more about how marital status impacts ideologies, voting behavior, and policy preferences. “The Demographics of a New Voting Gap”, written by Herbert Weisberg in 1987, is one of the first articles to thoroughly cover the marriage gap—the differences in party identification, political participation, and policy preferences between those who are married, divorced, or never married. Weisberg does an excellent job of setting up a framework and background for future scholars contributing to the general knowledge base as well as the best methodology to study the phenomenon of the marriage gap. Weisberg asserts that the marriage gap became an important phenomenon in the 1972 election when married people voted “about 10-15% more Republican than unmarried people.”⁠ 19 He also points out how much more important a voting bloc this group of unmarried people could become in future elections. In 1971, the voting age was lowered from 21 to 18, adding a large group of primarily never-married voters to the electorate. At the same time, marriage rates began declining, the age of first marriage was 17 Paul William Kingston and Steven E. Finkel, “Is There a Marriage Gap in Politics?,” Journal of Marriage and Family, 49 (1987): 57. 18 Ibid. 19 Herbert F. Weisberg, “The Demographics of a New Voting Gap: Marital Differences in American Voting,” The Public Opinion Quarterly, 51 (1987): 335.
  • 21. 21 increasing, and divorce rates were rising annually; unmarried people began to make up one of the fastest growing subsets of voters. Weisberg accurately predicts that recognition of this growing demographic would cause strategists and politicians to devote time and energy trying to target these unmarried voters. However, he notes problems that could arise from ascribing too much importance to marital status and too little to other factors: “party leaders that now find that their traditional racial and income appeals have led to a marriage gap in voting may choose to focus their appeals more directly on family issues that would increase this division.”⁠ 20 Underlying factors that lead to the decision to be married or not could be more responsible for a person’s political attitudes than marital status itself. For instance, people who marry young are statistically more likely to be religiously and politically conservative. They are not conservative because they are married, but married because they are conservative. This does not make marital status any less important a factor to consider when it comes to identifying voters and coordinating campaigns, but in studying public opinion and demographics it is important not to ascribe causes to voter preferences without rigorous research. Another important field to study is the participation gap between married and never-married voters. Conventional knowledge suggests that married individuals are far more reliable voters than their unmarried peers. Kingston and Finkel suggest that there are several reasons that married individuals are more likely to make it to the polls. It’s possible it is simply more likely that there is a person in their household who convinces the rest to vote. It is also possible that married people have “a greater psychological 20 Ibid., 342.
  • 22. 22 stake in the established order and thus may be more likely to participate politically.”21 They find that married people do have higher voting turnout, 14% more than singles. However, “beyond the minimal act of participation, the singles are generally the most politically involved.”22 This means that, if an unmarried person can be convinced to vote, they are more likely to also volunteer for or donate to a candidate or campaign. This is particularly interesting as it supports the idea that, if mobilized, unmarried people are much more politically active than their married peers. Women are also more likely to participate beyond the act of voting and so are young people, and to participate in non- monetary ways. This suggests that it may be true that young, unmarried women could be one of the greatest assets to campaigns and candidates. Finkel and Kingston also divide marital status dichotomously: currently married and single. They argue it is too difficult to determine the positions of widowed, divorced, or separated people without going into the details of how long they were married or how long ago they were married. This leads me to also use a dichotomous variable. I focus on currently unmarried and currently married individuals, as this is the most effective way to measure the persuasive argument that lack of secure finances motivates unmarried women to vote a certain way. In their work on the rising gender gap “Why have women become more left- wing? The political gender gap and the decline in marriage,” Edlund and Pande suggest that the “fall of over a quarter in the proportion of currently married adults, and a threefold rise in the proportion of currently divorced individuals” in the United States in the ‘70s, ‘80s, and ‘90s made women poorer in relation to men and thus more likely to 21 Kingston and Finkel, “Is There a Marriage Gap in Politics?,” 58. 22 Ibid., 61-62.
  • 23. 23 vote for the Democratic Party.23 They observe that increases in their variable “divorce risk” strongly correlates with the increasing gender gap in party preference. This suggests that voting trends may not be based entirely on one’s marital status at the time of voting, but that they may be more related to concerns about future marital status directly relating to financial stability. They suggest that the phenomenon more greatly affects women’s party affiliations because “women’s decisions to work have been predicated on a fall in income from deteriorating marriage market conditions.”24⁠ While their article faces many issues with the value judgments they make without providing research support their claims such as the idea that women and men get married as a transaction where the man provides financial support for the woman who provides sex and access to children, much of their methodology of their study is sound and interesting.25 Their works’ relation of divorce risk to the gender gap is easily replicable and will be used in my study to examine not only divorce, but also correlation of the variable “never married” to policy preferences, party identification, and political participation. This will enable me to see if it is the fear of decreased financial security that leads women to vote for Democrats, or if it is more likely to be other factors that greatly affect unmarried women. Edlund and Pande also study a similar range of issues to those I do, “attitudinal questions on women’s issues (abortion and equal roles), the relative political salience of social, welfare, and economic issues for the respondent” so 23 Lena Edlund and Rohini Pande, “Why Have Women Become Left-Wing the Political Gender Gap and the Decline in Marriage,” The Quarterly Journal of Economics, 117 (2002): 919-920. 24 Ibid., 921. 25 Ibid., 923
  • 24. 24 their choice of questions and issues is a good starting point for my study.26 Where Edlund and Pande argue that the gender gap develops from a women’s inherent economic vulnerability created by a decrease in marriage rates and an increase in divorce rates, Huddy, Cassese, and Lizotte assert, “The gender gap may originate among women who are economically autonomous from men but not necessarily economically vulnerable.”27 They suggest that this group of women may vote for Democrats because it is a party that represents well-educated unmarried women as well as low-income unmarried women’s interests. These women are more likely to work in the public sector than other workers, they are more likely to be single parents, and more likely to benefit from reform against job discrimination and for affirmative action, all causes the Democratic Party champions. Most recently, Democratic pollster Stanley Greenberg has begun to study unmarried women in-depth, citing them as the greatest hope for the Democratic Party in the 2014-midterm elections. His studies concluded that never-marrieds, divorcés, and widows were likely to vote for the Democratic Party in the midterm elections because of their vulnerable economic positions rather than their stances on “women’s issues.” This argument and persuasive evidence lead to the inclusion of divorcés and widows in my “unmarried” category.28 The largest contribution that existing scholarship on the marital gap makes to my research is the assertion that my variables should be divided between married and unmarried, that scholarship focusing on voting trends, ideologies, and policy preferences 26 Ibid., 934 27 Huddy, Cassesse, and Lizotte, “Gender, Public Opinion, and Political Reasoning,” 37. 28 Greenberg and Seifert, “Why Unmarried Women are the Key to 2014.”
  • 25. 25 are more correlated to current marital status rather than marital history. It is also important to consider the changing attitudes toward marriage in the United States such as a decrease in marriage rates, an increase in age of first marriage, and skyrocketing divorce rates. This information furthers the importance of including marital status as a variable and specifically identifying the preferences of unmarried individuals who begin to make up more of the population and a large portion of unlikely voters that could be swayed to turn out and vote for a given candidate. Age: Party Identification, Policy Preferences, and Political Participation The relation of age to policy preference, party identification, and political participation is complex and often inconclusive. Several factors create barriers to making sound judgments about the impact of age on these three variables. First, there is a scholarly debate as to whether raw age or cohort is more important—that is, is a person’s age or the political climate in which they were born more important in determining an individual’s party identification, policy preferences, and political participation? Second, it is hard to determine whether age, or other factors are more important when looking at the electorate as a whole. For instance, a larger proportion of young voters are immigrants, minorities, or first generation college students; it may be these factors, rather than age, that more greatly impact a person’s political views. This is difficult to study because these factors were not as recognized or present in older generations, but appear to play a large role in younger voters and are thus difficult to track over time. Third, a wealth of literature now exists surrounding the potential anomalies presented by the “millennial generation.” Though definitions of the exact timing of this generation’s emergence vary from those born in the late ‘70s to early ‘90s, the true marker is the level of technology
  • 26. 26 this cohort had access to in their formative years. It is hard to tell the effects the millennial generation will have on politics for years to come as they have yet to truly age out of the “young” age group and cannot be analyzed in other age brackets. However, many of these issues do not affect my study. Because I do not examine the effect of age alone on policy preference, party identification, or political participation, but rather use age as an interactive factor in my variables, many ways in which age is swayed are eliminated. For instance, if the millennial generation is truly an anomaly, then each of the groups I study in that age range should exhibit the same differences from older cohorts. Young unmarried men, young married men, young unmarried women, and young married women should demonstrate similar tendencies if millennials truly represent a unique cohort of voters. Also, because of the way I divide the years in my study, I am able to examine both cohort as well as age individually. For example, the group that I label “young” from 1952-1962 will, for the most part, be labeled “middle aged” from 1962-1972, and “older” from 1992-2002. While the same people are not studied year to year, tracing these generations over time will permit me to see if changes in attitudes seem to occur over time, or if it’s more likely that one’s cohort’s views seem to remain stagnant throughout the decades. Scholars have shown that young people have developed a tendency to vote for Democratic candidates, even if it is not clear why. Sapiro and Shames discuss the rapid increase in young people identifying with the Democratic Party and suggest this phenomenon, if it continues, has the power to continue to elect an increasing amount of Democratic candidates. Because young people, as well as unmarried individuals and women all appear more likely to vote for Democratic than Republican candidates, it
  • 27. 27 suggests that young, unmarried women would be one of the most reliable voting blocks for the Democratic Party. My study seeks to determine whether combining these factors increases the likelihood of an individual being a democrat as well as the strength of their Democratic leanings, or if the factors truly present themselves separately but when combined have little effect. Andersen’s study of working women also studies working women by generation—those born after 1930, between 1924 and 1939, and those born before 1924—she finds that the youngest group of women are the most politically active, while the oldest women are the least. This is important to note because, in general, older demographics are more likely voters. The younger individuals are the least likely population to vote.29 It will be important to examine this variable in my study to determine which group is the most politically active and thus the most advantageous to motivate for a given candidate beyond the act of voting. While some studies mentioned above strive to combine age, marital status, and gender, they do not do so in order to analyze groups voters as I do, but rather in combination with a myriad of other factors to determine which factor is the most important in determining views, rather than how the three combined would impact an individual’s preferences. This is where my scholarship adds to the study of age and political preference, it does not study age individually or age as a primary factor, but rather uses age to break up the electorate to study marital status and gender further. Conclusions There is a wealth of literature on gender, marital status, and age that studies policy 29 Norval D. Glenn and Michael Grimes, “Aging, voting, and political interest,” American Sociological Review (1968), 563.
  • 28. 28 preference, political participation, and party identification. However, what is lacking is scholarship that combines gender, marital status, and age. Studies that do combine all three factors do so to prove larger points, rather than provide a descriptive analysis focusing on the party identification, political participation, and policy preferences of the group itself. Without this type of scholarship, other studies remain uninformed and cluttered with assumptions. While existing scholarship provides a strong base of information to build upon and methodology to replicate, much is missing. This thesis takes the information acquired by other researchers, abandons practices scholars have deemed methodologically unsound and conclusions they find invalid, and strives to contribute a comprehensive analysis of a previously ignored, but evidently increasingly important demographic—young, unmarried, women.
  • 29. 29 Chapter 3: Research Design In this chapter, I describe the sources and methods that will be employed to analyze my three research questions. Specifically, the chapter describes the sources of data, the measures that I will construct, and the methods to be employed in the remainder of this thesis. I detail my choice of data set, the creation of my independent variable (AGMS), and present my choice of variables from the full American National Election Study dataset that I use in this study. Data Source The American National Elections Study (ANES) has become the principal resource that scholars employ for political research. The ANES study description describes the data set as Particularly useful in service to three kinds of analysis: 1) analysis that focuses on over time change in citizens, in their individual characteristics, in the opinions they hold, and in their political behavior; 2) analysis that looks at subgroups of citizens that are represented by few cases in a single, cross-section sample, but by many more cases when several samples are combined; and 3) analysis that is concerned with replicating results over several elections.30 Considering that my research questions touch on each of these areas, the ANES is clearly the comprehensive available. While some other studies and polls do comparably excellent jobs of developing questions and reaching diverse groups of respondents, the true value of the ANES is its historical reach and commitment to consistency. ANES has been surveying the American public via in-person interviews twice a year every two years, before and after 30 American National Election Study, accessed September 24, 2014 http://www.electionstudies.org/studypages/cdf/cdf.htm.
  • 30. 30 Election Day, since 1948. From this data they compile a full data set through 2008 making 60 years of data available for further study. Each year, a portion of the survey consists of questions that specifically target that year’s political climate and candidates. The real significance to my research comes from the ability to analyze changes over time, made easy by the ANES because since its inception the study has been committed to asking the same or very similar questions each year. These are the questions around which I will build my research, as this is a methodologically sound way to consistently map variables such as party identification, ideology, and policy preferences over time rather than having to piece together snapshots of attitudes at given moments over history from different and often incompatible sources. As with any series conducted over time, some questions are added and dropped from the survey, and some questions change over the years. Nonetheless, I attempt to select questions based not only on content, but also the number of years they were asked and the consistency of the wording. Another benefit of using this data set is that it has already been compiled with consistent variables, so the data is both manageable and easily manipulated, even though it analyzes over 900 variables and over 50,000 responses. With this number of variables studied, there is sufficient data to address each of my questions. In summary, The American National Elections Study is the best selection of a data set for my research that is used most by scholars who do similar research on opinions over time. It’s cumulative data set complied from the last 60 years of surveys is easily read and manipulated and represents a model of methodologically consistent and rigorous research, allowing researchers to focus less on quality-control of data and more on the information that can
  • 31. 31 be drawn from data manipulation. This dataset, combined with the functions of STATA, make my variables not only possible to study with the number of cases I hope to include, but also clear in their presentation and results. Coding Age, Gender, and Marital Status My independent variable combines age, gender, and marital status. Each of these factors is ascertained for each respondent in the ANES. My first step was to eliminate any respondents who chose not to respond to those questions. The study also doesn’t simply ask if respondents are married or unmarried, but includes categories for divorced, widowed, or never married, permitting me also to develop my own definition and measure of “unmarried” and to combine age, gender, and marital status into one variable, which makes it easier to track trends based on my own and accepted scholarly definitions. I create twelve possible outcomes for my independent variable using age, gender, and marital status. All of these variables are available for the period 1952-2012. I combine them to create the following variable with the following possible categorizations: Table 3.1: Individual variables combining age, gender, and marital status Variable AGMS Codes 1. Young Unmarried Women (YUW) 2. Young Unmarried Men (YUM) 3. Young Married Women (YMW) 4. Young Married Men (YMM) 5. Middle Aged Unmarried Women (MUW) 6. Middle Aged Unmarried Men (MUM) 7. Middle Aged Married Women (MMW) 8. Middle Aged Married Men (MAM) 9. Older Unmarried Women (OUW)
  • 32. 32 10. Older Unmarried Men (OUM) 11. Older Married Women (OMW) 12. Older Married Men (OMM) Age is divided into three groups: Young (18-35), Middle Aged (36-65), and Older (66+). Most studies that study age groups use similar age ranges. “Unmarried” includes all individuals who responded as never married, divorced, or separated. Though some scholars argue that divorce, separation, and widowing are fundamentally different experiences than having never been married, these differences should not greatly impact my study. Scholars who research marital status and public opinion often combine these factors because arguments that hinge on financial security, ideology, and policy preferences appear to hinge more on whether or not the respondent is currently married, as opposed to whether they have ever been married. It is also difficult to separate divorced, separated, and widowed into their own category, as it is not possible to control for length of relationship, reason for separation, or other factors which could play a role in responses to polling questions. For my results, it is not crucial to separate them from the “never married” population, so divorced, separated, and widowed are combined with never married individuals to form a group called “unmarried.” Because the ANES defines gender as a binary, I do as well. Respondents who answered that they identified as male are coded as men, respondents who answered that they identify as female are coded women, and anyone who did not respond is removed from the study. The ANES also uses the variable gender to mean sex and the rest of this paper will do the same to maintain consistency between the dataset and results. As noted above, these variables will be employed to analyze several dependent variables: party identification, policy preferences, and political participation. Party
  • 33. 33 identification is specifically asked of respondents as individual questions or groups of questions each year for the ANES and requires little manipulation or selection on my part. Policy preferences require a bit more selection, but again, the benefit of the ANES provides such a range of questions on policy issues throughout the years. It also maintains an incomparable level of consistency each year allowing for a more accurate comparison of preferences from year to year. Because the variables are so easily traced over time, the link between the dependent and independent variables is straightforward. By developing individual variables for each permutation of my independent variable (young unmarried women, young unmarried men, young married women, and so on) I will be able to trace those groups’ views, identifications, and ideologies using the questions asked each year by the ANES. Dependent Variable 1: Party Identification To examine my first dependent variable, I chart the responses of each of my twelve independent variables to the following questions: Table 3.2: Dependent Variable 1—Party Identification Variable Name in ANES Description (Years Asked) VCF0303 Party ID Summary (Since 1952) VCF0706 Party of R Vote: President (Since 1948) I choose to examine these two variables not only because they have been asked each year in nearly the exact same manner since 1952 but also because they each provide different information. It will also show whether gendered partisanship has changed over the last 60 years, when, and which combinations of age, gender, and marital status have become more or less partisan. The three-point scale is important because it shows simply which party a person is likely to vote for, which is important for the outcome of elections as it
  • 34. 34 doesn’t necessarily matter how strong of a Republican a person is when they get to the ballot box if they intend to vote the Republican ticket. This is a way to quickly gauge which party a group of voters is likely to support as a whole, while the first question provides a more nuanced approach. Dependent Variable 2: Policy Preference Next, I study policy preferences. Unfortunately, most policy issues are dependent on the political climate and have not remained the same for the last seventy years. I make an effort to choose those issues that have the most relevance to my study while also providing enough years to accurately test their trends over time. I use the following issue areas: Table 3.3: Dependent Variable 2—Policy Preference Variable Code in ANES Policy Area (Years Asked) VCF0839 Government Spending and Services on Healthcare and Education (Since 1982) VCF0838 Abortion (Since 1980) VCF0887 Federal Spending on Child Care (Since 1988) These policies were chosen because they are the areas surrounding which the most scholarship and popular literature exists. Each of these measures support for a given policy, and I will measure it as percentage support over time, as well as include more rigorous statistical analysis as necessary. Then, I look at political participation of my groups by tracing their responses to several questions on political participation Dependent Variable 3: Political Participation I examine each of these categories of voting behavior and political participation separately to determine not only how likely a group of individuals are to vote, but how
  • 35. 35 likely they are to participate beyond the act of voting. To test individual’s participation beyond voting I combine four measures of political participation—attending rallies, working for a campaign, wearing a button or sticker, or donating money—to a variable that examines whether an individual performed one or more political acts beyond registering and voting. In combining age, gender, and marital status I hope to further test the developing theory that young unmarried women are a likely group to participate beyond the act of voting. Table 3.4: Dependent Variable 3—Voting Behavior Variable Code in ANES Description (Years Asked) VCF0703 Did respondent register and vote in this year’s election? (Since 1952) VCF0718 Did respondent attend political meetings/rallies during the campaign? (Since 1952) VCF0719 Did respondent work for a party or candidate? (Since 1952) VCF0720 Did respondent display a button or sticker for a party or candidate? (Since 1956) VCF0721 Did respondent donate money to a party or candidate? (Since 1952) I organize my chapters the same way I organize my variables. My first analytical chapter focuses on the trends in young, unmarried women’s party identification and partisanship. After tracing trends over time, I examine how this group of voters (YUW) votes differently from other groups (i.e. YSM, OMW etc.), when they began to distinguish themselves as a separate voting bloc, and what may have precipitated the division. My second chapter of data analysis focuses on policy preference. Do young, unmarried women have different policy preferences than other age groups? If so, are popular articles as to what issues young, unmarried women gravitate toward accurate, or is it something else? My final analytical chapter is based on political participation, that
  • 36. 36 is, how much more or less likely are young, unmarried women to vote and participate in politics than other groups. Again, I look into the development of a gap as well as potential explanations based on timing and historical events for the causes of this gap. After analyzing the data, I include a chapter detailing what these conclusions could mean for future campaigns and politicians when it comes to analyzing this group of voters as a constituency or voting block and offer suggestions as to what further research should be conducted.
  • 37. 37 Chapter 4: The Impact of Age, Gender, and Marital Status on Party Identification The Changing Lives of American Women Before presenting an in-depth analysis of the changing attitudes of American women over the last sixty years, it is useful to describe the lifestyle changes that American women have experienced over that time period. This analysis provides an initial evaluation of the types of problems and interests that women of different age cohorts are likely to experience, and it also provides guidance in defining the age cohorts that I will employ in the subsequent analysis There are three important milestones that shape the challenges and therefore the political interests of women. First, first-birth rates—the age at which a person gives birth to their first child—for women over 35 have dramatically increased in the last forty years.31 Second the median age of first marriage has also risen dramatically and fairly steadily since as early as the 1950s.32 Finally, since the mid-1970s, workforce participation of mothers with children of all ages has steadily increased.33 These developments suggest that mothers at that time would also have changing views and priorities as they left the home and entered the workforce. These changes are important not only as standalone statistics, but also important when considering what age group a woman should be considered a part of to obtain the most meaningful data. 31 Mathews TJ, Hamilton BE. First births to older women continue to rise. NCHS data brief, no 152. Hyattsville, MD: National Center for Health Statistics. 2014. 32 U.S. Census Bureau, Current Population Survey, March and Annual Social and Economic Supplements, 2014 and earlier. 33 “Women in the Labor Force,” Department of Labor Statistics, last accessed April 20, 2015, http://www.dol.gov/wb/stats/facts_over_time.htm
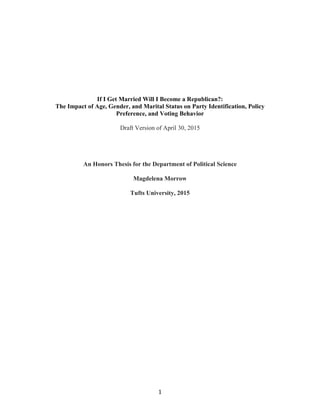
  • 38. 38 Increasing Birthrates for Women Over 35 One stark trend over the last forty years is increasing first birthrates—the age at which women give birth to their first child— for women over 35 each year with few exceptions. Since the early 1980s, first birth rates for women between 40 and 44 have also steadily and rapidly increased. The data in the graph below make clear that issues of family and career planning are no longer confined to very young women. The trend begins to take off around 1980, and first-birth rates for women between 35 and 39 have rapidly and nearly consistently increased since then. Figure 4.1: Trends in Birthrates This trend is especially important when defining what it means to be a “young woman.” Many pundits and politicians suggest that women in their twenties are likely to vote based upon issues of reproductive rights. However, this later first birth rates show that women in their mid-thirties and even forties are making decisions that were made by much younger women in previous generations. Women giving birth to their first child later in life also introduces several challenges for policymakers. With women giving birth at an older age, there is a larger demographic of voters who are intimately connected 0 2 4 6 8 10 12 2012 2010 2008 2006 2004 2002 2000 1998 1996 1994 1992 1990 1988 1986 1984 1982 1980 1978 1976 1974 1972 1970 RatePer1,000womeninspecified agegroup First Birth Rates for Women 35-39 and 40-44 35-39 40-44
  • 39. 39 to the costs of childcare, the quality of education, policies that particularly affect mothers and parents, issues of work-life balance, and a wider range of health care concerns. It is important to be mindful of this trend when looking at the changing views of women in the last sixty years. As the lifestyles of American women change, our analysis of their preferences must also change. Rising Age of First Marriage The past sixty years have also seen a steady increase in the median age of first marriage in the United States. Though the median age of first marriage has pretty steadily increased for both men and women, since the 1970s it has been a steeper increase for women. Since 1975, the median age of marriage for women has risen 30% while men have experienced a 25% increase. The graph below demonstrates these trends. Like first-birth rates, the median age of marriage begins to rise rapidly beginning in the late 1970s to the early 1980s, suggesting other changes in preferences are likely to take off in this time if marriage and first-birth rates impact a woman’s policy preferences, voting behavior, or party identification.
  • 40. 40 Figure 4.2: Trends in Marriage The rising median age of first marriage also has several impacts on the lives of Americans, and in particular American women. First, there is therefore a larger than ever population of voters who are unmarried, making them an increasingly important demographic to consider in elections and governance. Second, this trend also leads to more individuals entering a marriage with an established career path and income, a stark contrast from a more “traditional” outlook of a woman marrying a man and raising children while he makes the financial decisions for the household. Women who marry later almost certainly would hold different views than their counterparts who married younger. As the median age of marriage rises, so should an understanding of what it means to be a young unmarried woman versus an older unmarried woman. Mothers’ Labor Force Participation The percentage of women with children who are in the work force has increased for mothers with children of all ages over the past forty years. This trend is particularly 20 21 22 23 24 25 26 27 28 29 30 2014 2011 2008 2005 2002 1999 1996 1993 1990 1987 1984 1981 1978 1975 1972 1969 1966 1963 1960 1957 1954 Age Year Median Age of First Marriage in United States Men Women
  • 41. 41 salient in women with children under three years of age with labor force participation of mothers almost doubling from 1976 to 2012. Figure 4.3: Trends in Mothers’ Labor Force Participation Increased labor-force participation of mothers with children of all ages is important in particular when looking at policies related to childcare and wage equality. This also demonstrates that fewer women are putting their careers on hold long-term to raise children and run a household. This means that mothers and working women are increasingly one in the same causing both groups of women’s interests to shift. Summary: The Lives of American Women The data described above make clear that the lives of American women are vastly different than they were forty to sixty years ago. We would therefore expect both their priorities and views to be different than they were in the past. These data also demonstrates that it is important to keep an evolving view of what it means to be a “young woman” versus an “older” woman and suggests the need to at least evaluate the possibility that the hypotheses associated with younger women may actually apply to
  • 42. 42 middle-aged women as well. In the next section of this chapter, I provide such an evaluation before defining the age cohorts to be employed in the remainder of the study. Recoding Age To assess whether middle aged and younger women increasingly have similar concerns, I compared my originally proposed age range (18-35, 36-65, 66+) to a possible new age range. 34 For this test, I recoded age groups so that 18- to 35-year-olds are coded as “young,” 36- to 49-year-olds are coded as “middle-aged,” and anyone 50 years and older is coded as “older.” Though 50 at first appears to be a high cutoff for describing middle-aged individuals, consider first-birth rates for women over 35. A woman who gives birth at 35 ostensibly has a child under 18 years old living at home until she is 53 years old. This suggests that many 50 years olds may have similar concerns that women in their thirties had when age of marriage and age of first-birth were in the lower twenties. Figure 4.4 traces unmarried women’s identification with the Democratic Party over five time periods using the original age breakdowns proposed in Chapter 3 (18-35, 36-65, 66+). 34 All data in the remainder of this chapter comes from the ANES Cumulative Data File. The American National Election Studies (www.electionstudies.org) TIME SERIES CUMULATIVE DATA FILE [dataset]. Stanford University and the University of Michigan [producers and distributors], 2012.
  • 43. 43 Figure 4.4—Evolution of Partisanship Among Unmarried and Married Women (18-35, 36-65, 66+) 40 45 50 55 60 65 70 1952-1964 1965-1977 1978-1990 1991-2003 2004-2012 %Democrat Year Unmarried Women (D) Young Unmarried Women Middle-Aged Unmarried Women Older Unmarried Women 40 45 50 55 60 65 70 1952-1964 1965-1977 1978-1990 1991-2003 2004-2012 %Democrat Year Married Women (D) Young Married Women Middle-Aged Married Women Older Married Women
  • 44. 44 This figure demonstrates several important findings. First, it shows that marital status and age impact a woman’s party preferences. Second, it shows that unmarried women, using these age groups, are becoming a more cohesive voting bloc than their married counterparts. Each age group of unmarried women has trended Democrat since 1991. Third, by showing each age group of unmarried women trending similarly, it suggests that either the factors discussed in “The Changing Lives of American Women” do not significantly impact unmarried women’s party identification, or that this age breakdown is too broad to assess these trends. I test this second possibility by recoding age so that “young” represents 18- to 35-year-olds, “middle-aged” represents 36- to 49- year-olds, and “older” represents individuals who are 50 and older. Figure 4.5 traces women’s partisanship using these recoded age ranges.
  • 45. 45 Figure 4.5—Evolution of Partisanship Among Unmarried and Married Women (18-35, 36-49, 50+) 40 45 50 55 60 65 70 75 1952-1964 1965-1977 1978-1990 1991-2003 2004-2012 %Democrat Year Unmarried Women (D) Young Unmarried Women Middle-Aged Unmarried Women Older Unmarried Women 40 45 50 55 60 65 70 75 1952-1964 1965-1977 1978-1990 1991-2003 2004-2012 %Democrat Year Married Women (D) Young Married Women Middle-Aged Married Women Older Married Women
  • 46. 46 This new age range also shows that age and marital status are important factors in determining a woman’s party identification. In addition, by more finely breaking down age groups, this age range also reveals that unmarried young women’s and unmarried middle-aged women’s party identifications are increasingly similar and are moving away from their older counterparts. This indicates that as society and women’s lives change, so do their party preferences. Particularly from 1991 on, young and middle-aged unmarried women have pulled away from their older counterparts, suggesting that there is a link between partisanship and lifestyle decisions. Because this age range more accurately fits the circumstances of women’s lives today and permits for a closer examination of the increasingly similar party identifications of young and middle-aged women, this will be the age range that I employ in the remainder of my study. I generate a new variable called AGMS2, which changes the age ranges used from (18-35, 36-65, 66+) to (18-35, 36-49, 50+). Changing Partisanship of American Women Figure 4.5 demonstrates the impact of marriage on a woman’s party identification. Overall, married women are less likely to be Democrats than unmarried women. Throughout the time period studied, there is an average of an 11.5% difference between the party identification of young unmarried women and their married counterparts, and an average of a 12.3% difference between middle-aged married women and middle-aged unmarried women. However, looking at the “older” age range, there is only an average of a 3.6% gap, suggesting that the impact of marriage is more important when women are younger and more likely to be making decisions about their careers, families, and futures, rather than when they are established in their careers and have passed the age where they
  • 47. 47 would likely be considering having children. Additionally, those older women who have children are less likely to have children living at home and thus have different concerns than their younger counterparts. Unmarried women’s partisanship began to differ greatly from that of their married peers after the 1960s, and particularly in the 1970s and 1980s, suggesting that this trend is related to the ways women’s lives began to change greatly in the late 1970s and 1980s—rapidly increasing median age of first marriage and increased first-birth rates for older women—for instance. This also calls into question contemporary literature which suggests that young unmarried women have only recently become a unique demographic as this data shows that young and middle-aged unmarried women have pulled away from their older counterparts since 1952, with the exception of the 1978-1990 era. In addition to notable differences between married and unmarried women, the development of these differences over time is important. The party identification of unmarried women has changed more dramatically than that of married women, likely because the lives of unmarried women have changed more greatly over the last sixty years than the lives of married women. Additionally, married and unmarried women’s partisanship has trended in opposite directions. Unmarried women have, on average, become 11.1% more Democratic, while married women have become 5.6% less likely to identify with the Democratic Party. From 1952 to 1964, young unmarried women and young married women differed by 4.3%, with married women leaning more toward the Democratic Party. By 2003 to 2012, young unmarried women differed from young married women by 16.8% and were more likely to be Democrats. This difference is even more pronounced in middle-aged women. Between 1952 and 1964, middle-aged married
  • 48. 48 and unmarried women differed in their party identification by only 0.8%, with married women again being more likely to be Democrats; from 2003 to 2012, there was a 24.4% difference, with unmarried women far more likely to identify with the Democratic Party. This again suggests that middle-aged women increasingly have more in common with younger women than older women, likely due to their changing lifestyles.
  • 49. 49 Changing Partisanship of American Men Figure 4.6—Evolution of Partisanship Among Unmarried and Married Men 30 35 40 45 50 55 60 65 70 75 1952-1964 1965-1977 1978-1990 1991-2003 2004-2012 %Democrat Year Unmarried Men (D) Young Unmarried Men Middle-Aged Unmarried Men Older Unmarried Men 30 35 40 45 50 55 60 65 70 75 1952-1964 1965-1977 1978-1990 1991-2003 2004-2012 %Democrat Year Married Men (D) Young Married Men Middle-Aged Married Men Older Married Men
  • 50. 50 Overall, as Figure 4.6 shows, men’s party identification is far less variant than women’s in terms of age, year, and marital status. From 1952 to 2012, young married men and young unmarried men differed in their party identification by an average of 6.9%. Middle-aged married men and middle-aged unmarried men differed, on average, by 6.8%, and older married and unmarried men by 8%. In each category, except for older men from 1952 to 1964, married men identified less with the Democratic Party than unmarried men. This variation is significantly less than women’s variation by marital status, suggesting that marital status more greatly impacts a woman’s party identification than a man’s. In addition, while unmarried women of every age group were more Democratic in 2012 than they were in 1952, only older unmarried men have become more Democratic. In every other category, on average, men have become less likely to identify with the Democratic Party since 1952. Married men have become 13.6% less likely to identify as Democrats, a trend that is in the opposite direction of trend for unmarried females. Married men have also had much more varied party identification than married women. Where married women experienced an average trend away from the Democratic Party of 5.6%, married men moved away at an average of 13.5%. This demonstrates that the partisan gender gap is not just created by women moving toward the Democratic Party, but also men moving away from the Democratic Party. The continuity across age ranges throughout the years also suggests that men have been less impacted by the increasing median age of marriage, increasing first-birth rates for women over 35, and increasing labor force participation of mothers. While middle- aged and young women have trended away from their older counterparts in recent years,
  • 51. 51 men of all ages have trended more closely together, suggesting that marital status and age are less important factors for men when determining their party identification than they are for women. Figure 4.7 summarizes the current party identifications of individuals in the United States. It shows that both men’s and women’s views are impacted by their marital status and age. Marital status in particular is crucially important as the majority of unmarried individuals in each age group identify as Democrats, while the majority of married individuals do not. It also demonstrates that women’s party identifications (particularly those of middle-aged unmarried women) are more impacted by marital status and age than men’s. This suggesting that much of the focus on young unmarried women by the media who frequently assume that young unmarried women only vote based on the protection of their reproductive rights.
  • 52. 52 Figure 4.7—Impacts of Age, Gender, and Marital Status on Party Identification 2004-2012 40 45 50 55 60 65 70 75 Young Middle-Aged Older Women (D) Unmarried Married 40 45 50 55 60 65 70 75 Young Middle-Aged Older Men (D) Unmarried Married
  • 53. 53 Tracing Trends in Party of Presidential Vote 1952-2012 To study trends in presidential voting, I recoded the ANES variable on “Party of Respondent Vote” to include only individuals who voted. I analyze voter turnout in Chapter 6 below, but for the purposes of this chapter it is crucial to focus attention on those individuals who did vote. I coded the variable so that either an individual voted was listed as voting for the Democratic candidate or “other.” My aim is to evaluate the assertion that young unmarried women are becoming one of the strongest Democratic voting blocs. One important area in which the pundits are right is in the rapidly increasing tendency of unmarried women to vote for the Democratic Party. The data suggests that this trend is true, but with a few qualifications. First, though the partisanship of young unmarried women has changed the most drastically since 1952, with unmarried women being 30% more likely to vote for a Democratic presidential candidate in the 2004 to 2012 era than they were in the 1952 to 1964 era, unmarried women of each age group have substantially moved toward the voting for the Democratic Party for president since 1952. The party that unmarried women cast their presidential vote for has changed the more over the last sixty years than any other group of voters, suggesting that while the party identification of men has trended away from the Democratic Party contributing to the gender gap in voting, when it comes party of presidential vote, the gender gap may more greatly occur due to women’s changing attitudes. These findings are summarized in the following table, Table 4.2.
  • 54. 54 Table 4.1 Summary of Party of Presidential Vote Demographic Group Percent Change in Vote for Democratic Presidential Candidate 1952- 2012 Percent Vote for Democratic Presidential Candidate 2004- 2012 Young Unmarried Women 30 80 Young Married Women 3 54 Middle-Aged Unmarried Women 18 71 Middle-Aged Married Women 3 51 Older Unmarried Women 21 66 Older Married Women 2 49 Young Unmarried Men 5 65 Young Married Men 3 52 Middle-Aged Unmarried Men -7 56 Middle-Aged Married Men 0 52 Older Unmarried Men 3 63 Older Married Men -2 46 It is clear from this table that by far the greatest changes in partisan voting behavior toward the Democratic Party occurred among unmarried women of all ages. Figure 4.8 traces the party of presidential vote of individuals over the past sixty years and reveals several interesting trends. First, it shows that the party of presidential vote of unmarried women has been trending Democratic for the last forty to fifty years—this is not a new phenomenon. It also shows that the party of presidential vote of young and middle-aged unmarried women pulled away from that of older unmarried women immediately following the lifestyle changes of the late 1970s and early 1980s as well as the feminist movement. It appears that as women married later, had children later, were more likely to be working mothers, and had experienced the social and legal empowerment of the feminist movement, they felt the Democratic presidential candidates were a better fit for their interests.
  • 55. 55 The long history of young and middle-aged women increasingly voting for Democratic presidential candidates is also important because it demonstrates that recent elections were not an anomaly due to candidate or recent events. There was a leap between the 1991 to 2003 era and the 2004 to 2012 era in almost every demographic category for Democratic candidates, but this is likely due to the abysmal approval of President Bush and the overwhelming appeal of President Obama among many groups of people in 2008. Some of the large jump in unmarried women’s Democratic tendencies might be attributed to the high-profile female candidates in the 2008 election. However, because there were women on both sides of the aisle, this more likely influenced the turnout of women more than their partisanship. This will be discussed in Chapter 6. Figure 4.8 also demonstrates the consistency of married women, unmarried men, and married men’s party of presidential votes since 1952. These groups have varied far less than their unmarried female counterparts over the last sixty years and have also trended less consistently, responding more to individual eras rather then consistently and strongly trending toward or away from the Democratic Party. Ultimately, studying the party of presidential vote of these demographic breakdowns demonstrates the increasing importance of turning unmarried women for the Democratic presidential candidate and, as the volume of this demographic grows, the importance of other parties to reach out to this demographic to be able to win presidential elections.
  • 56. 56 Figure 4.8 Tracing Party of Presidential Vote 1952-2012 20 30 40 50 60 70 80 90 1952-1964 1965-1977 1978-1990 1991-2003 2004-2012 %VotedforDemocratic President Year Unmarried Women Young Unmarried Women Middle-Aged Unmarried Women Older Unmarried Women 20 30 40 50 60 70 80 90 1952-1964 1965-1977 1978-1990 1991-2003 2004-2012 %VotedforDemocratic President Year Married Women Young Married Women Middle-Aged Married Women Older Married Women 20 30 40 50 60 70 80 90 1952-1964 1965-1977 1978-1990 1991-2003 2004-2012 %VotedforDemocratic Candidate Year Unmarried Men Young Unmarried Men Middle-Aged Unmarried Men Older Unmarried Men 20 30 40 50 60 70 80 90 1952-1964 1965-1977 1978-1990 1991-2003 2004-2012 %VotedforDemocratic President Year Married Men Young Married Men Middle-Aged Married Men Older Married Men
  • 57. 57 A Word On Race In addition to the impacts of age, gender, and marital status shown above, the inclusion of race as a variable may impact results. To test this I examine the impacts of age, gender, and marital status among black and white respondents on an individual’s party of presidential vote. Over the time period studied, more than 80% of black respondents of all ages, genders, and marital statuses voted for the Democratic Presidential candidate. These results are shown in Table 4.2. Because there were so few black respondents in the ANES, I divide the time period studied into two eras—1952 to 1990 and 1991 to 2008—to create a large enough sample size to look at the impacts of age, gender, and marital status on black individual’s party of presidential vote. Table 4.2: Summary Party of Presidential Vote—Black Voters Demographic Group Percent Vote for Democratic Presidential Candidate 1952- 1990 Percent Vote for Democratic Presidential Candidate 1991- 2008 Young Unmarried Women 95 97 Young Married Women 89 100 Middle-Aged Unmarried Women 93 99 Middle-Aged Married Women 93 94 Older Unmarried Women 90 95 Older Married Women 82 95 Young Unmarried Men 84 91 Young Married Men 84 88 Middle-Aged Unmarried Men 84 95 Middle-Aged Married Men 87 95 Older Unmarried Men 86 96 Older Married Men 92 92
  • 58. 58 This data suggests it is not the changing support of African American respondents that account for the trends in the impacts of age, gender, and marital status on partisan voting behavior as there is so little variation among black respondents’ support for Democratic presidential candidates in the era studied. I test whether the impacts of age, gender, and marital status remain when only white respondents are studied. The findings are shown in Figure 4.9 below. Before 1990 there is little to no impact of age, gender, or marital status on party of presidential vote. By the 1991 to 2008 era stark trends emerge, particularly between married and unmarried respondents, suggesting that there was likely something about the 1980s that led these changes to occur so strongly. Additionally, the presence of strong trends among white voters suggest that the impacts of age, gender, and marital status on voting result from changing behavior and partisanship of white voters, not from African American voters’ increased participation or partisanship.
  • 59. 59 Figure 4.9: White Respondents’ Partisan Voting Behavior 20 25 30 35 40 45 50 55 60 Young Middle Older %VotedforDemocrat White Women 1952-1990 Unmarried Married 20 25 30 35 40 45 50 55 60 Young Middle Older %VotedforDemocrat White Men 1952-1990 Unmarried Married 20 25 30 35 40 45 50 55 60 Young Middle Older %VotedforDemocrat White Women 1991-2008 Unmarried Married 20 25 30 35 40 45 50 55 60 Young Middle Older %VotedforDemocrat White Men 1991-2008 Unmarried Married
  • 60. 60 Conclusion It is clear from the data presented in this chapter that age, gender, and marital status all impact an individual’s party identification. Historically, young women’s—and, increasingly, middle-aged women’s—preferences differ greatly due to their marital status, while unmarried and married men’s preferences are more similar. Where middle- aged unmarried women have moved with younger unmarried women closer to the Democratic Party and away from their older counterparts, men of all ages and marital statuses (except for older unmarried men) have become increasingly close in their party affiliations and have all moved noticeably away from the Democratic Party. Each of these trends is crucially important to an analysis of voting behavior and policy preferences, particularly when examining how to win elections. Only three groups of individuals studied here have become markedly more Democratic over the past six decades—young unmarried women, middle-aged unmarried women, and older unmarried men—and two of these groups are growing rapidly as the median age of marriage rises. It will thus be crucially important for Democrats to reach out to and harness these groups of voters in order to win elections. Table 4.3 Summary of Support for the Democratic Party Demographic Group Percent Change in Support for Democratic Party 1952-2012 Percent Support for Democratic Party 2004-2012 Young Unmarried Women 7 66 Young Married Women -6 49 Middle-Aged Unmarried Women 17 71 Middle-Aged Married Women -8 47 Older Unmarried Women 9 57 Older Married Women -3 47
  • 61. 61 Young Unmarried Men -9 55 Young Married Men -15 43 Middle-Aged Unmarried Men -6 54 Middle-Aged Married Men -15 44 Older Unmarried Men 7 57 Older Married Men -11 43 The increasing support of young and middle-aged unmarried women for Democratic candidates is understandable when their changing life circumstances are taken into consideration as these lifestyle changes are more strongly supported by the Democratic Party. As women delay having children and increasingly work outside of the home even when they have young children, family planning and reproductive rights are obviously important. Further, childcare, healthcare, and education are also increasingly important factors for these women as they consider combining family and work outside of the home. In the following chapter, I analyze each of these group’s policy preferences to ascertain what the driving forces are behind these changing party identifications.
  • 62. 62 Chapter 5: Exploring the Impact of Age, Gender, and Marital Status on Policy Preferences In this chapter, I present analyses of ANES data to explore the influence of age, gender, and marital status on policy preferences.35 My focus is on three questions from the ANES: federal spending on childcare, support for an increase in government spending and government services for health and education, and views on abortion. I chose these policies because the literature suggests they may be the policies that create gaps in party preference between groups of individuals, and also because the analysis in the previous chapter suggested that changing lifestyles (child birth, marriage, work) have changed, which should lead to changing preferences. Specifically, I expect to find a substantial gap between young and middle aged individuals as compared to their older counterparts in terms of views on federal spending on childcare. I also expect middle-aged individuals, particularly women, to increasingly care about childcare spending because of the ways their lifestyles have changed over the past several decades. Finally, I expect there to be marked gender difference on government spending, as well as a noted impact of age and marital status on an individuals’ views, as many authors posit that government spending and services are a primary driver of the gender gap. I expect these trends to look similar to those seen in party identification, as partisanship is often directly linked to the role and size of government. I anticipate young and middle-aged unmarried women will have increasingly similar views on government services and spending, reflecting the 35 All data in this chapter comes from the ANES cumulative data file. The American National Election Studies (www.electionstudies.org) TIME SERIES CUMULATIVE DATA FILE [dataset]. Stanford University and the University of Michigan [producers and distributors], 2012.
  • 63. 63 impact of increased labor force participation of mothers, older median age of first marriage, and increased first-birth rates for women over 35. I expect there to be the least gender variance on abortion, as the literature suggests that views on abortion vary little between genders. However I do expect there to be a marital and age gap. I expect that movement over time will not reflect the changing lives of American women, but simply that abortion has become less taboo over the last thirty years that the question was asked. For this chapter, like the last, I use the following age ranges: “young” represents individuals 18 to 35 years old, “middle-aged” represents individuals 36 to 49 years old, and “older” represents individuals 50 and older. Ultimately, I anticipate seeing the most significant results in opinions on federal spending on childcare and government services and spending. Federal Spending on Childcare The American National Elections survey asks several questions about the respondent’s views on federal spending in various areas. In this section, I examine a question from the ANES which asks the respondent if they think federal spending on childcare should be increased, remain the same, or decrease. This question has been asked since 1988. I trace trends in opinion of federal spending on childcare for each group in AGMS2 to find trends over time. The results confirm many hypotheses laid out at the beginning of this section and remain consistent with findings in previous chapters. In each group, young individuals are 13-16% more likely to support increased federal funding for childcare than their older counterparts. Young unmarried women are, on average, 14% more likely to favor increased federal funding for childcare than older unmarried women. Young married women are, on average, 17% more likely to favor
  • 64. 64 increased federal funding for childcare than older married women. Young unmarried men are, on average, 13% more likely to favor increased federal funding for childcare than older unmarried men. Finally, young married men are, on average, 13% more likely to support increased funding for childcare than older married men. Additionally, in each combination of gender and marital status, young-and middle-aged individuals’ views have moved together.
  • 65. 65 Figure 5.1 Evolution of Support for Increased Federal Spending on Childcare Among Unmarried and Married Women 35 40 45 50 55 60 65 70 75 1978-1990 1991-2003 2004-2012 %SupportIncreasedFunding Years Unmarried Women Young Unmarried Women Middle-Aged Unmarried Women Older Unmarried Women 35 40 45 50 55 60 65 70 75 1978-1990 1991-2003 2004-2012 %SupportIncreasedFunding Years Married Women Young Married Women Middle-Aged Married Women Older Married Women
  • 66. 66 Figure 5.1 shows several important trends, both when assessing the impacts of marital status, age, and gender on one’s policy preferences, but also how these impacts have changed over time. It is unsurprising that there was a decline in support for increased spending in the 1991 to 2003 era, as it contains the majority of the Clinton era of welfare reform and a balanced budget and entered into the Bush era of no new taxes and a desire for a smaller government. However, while each of the groups’ support for increased federal funding on childcare dropped, what is particularly interesting is the rate at which these drops occurred. While one would expect young unmarried and young married women to be the most supportive of federal funding for childcare, these groups experienced the steepest declines. Young unmarried women’s support for increased federal funding of childcare decreased by 10% from 1978 to 2012, whereas middle-aged unmarried women’s support dropped 4%, and older unmarried women’s support dropped a less than 1%. The picture is slightly different for married women. Young married women’s support dropped 13%, middle-aged women’s support dropped 9%, and older women’s support dropped 11%. While these drops are in and of themselves important, what they mean for the relationships between age groups is more telling. The steep drop in support by young women, and the slower decrease in support by middle-aged women, particularly middle- aged unmarried women, has led young and middle-aged unmarried women to have nearly identical preferences. This supports the hypothesis that middle-aged women increasingly have similar concerns to their younger peers as a result of older ages of first marriage, increased first-birth rates for women over 35, and increased labor force participation of mothers. As people become parents older, older individuals have to take into
  • 67. 67 consideration the cost of childcare and thus would be more likely to support an increase in federal funding for childcare. It is also important to note that in each age group, unmarried individuals were more likely to support increased federal funding for childcare for two primary reasons. They might be considering future families and have established careers that they would like to retain even after having children necessitating some form of childcare. Alternatively, they are unmarried parents who rely on childcare to be able to both parent and work.
  • 68. 68 Figure 5.2 Evolution of Support for Increased Federal Funding for Childcare Among Unmarried and Married Men 30 35 40 45 50 55 60 65 1978-1990 1991-2003 2004-2012 %SupportIncreasedFunding Years Unmarried Men Young Unmarried Men Middle-Aged Unmarried Men Older Unmarried Men 30 35 40 45 50 55 60 65 1978-1990 1991-2003 2004-2012 %SupportIncreasedFunding Years Married Men Young Married Men Middle-Aged Married Men Older Married Men