1. FACULTEIT ECONOMIE EN
BEDRIJFSWETENSCHAPPEN
KU LEUVEN
Contributions to the analysis of credit risk data
using advanced survival analysis techniques.
Proefschrift Voorgedragen tot
het Behalen van de Graad van
Doctor in de Toegepaste
Economische Wetenschappen
door
Lore DIRICK
NUMMER 500 2015
2.
3. Committee
Advisor:
Prof. Dr. Gerda Claeskens KU Leuven
Co-advisor:
Prof. Dr. Bart Baesens KU Leuven
Chair:
Prof. Dr. Piet Sercu KU Leuven
Members:
Prof. Dr. Tony Bellotti Imperial College, London
Prof. Dr. Ricardo Cao Universidade da Coru˜na
Prof. Dr. Ir`ene Gijbels KU Leuven
Daar de proefschriften in de reeks van de Faculteit Economie en
Bedrijfswetenschappen het persoonlijk werk zijn van hun auteurs, zijn
alleen deze laatsten daarvoor verantwoordelijk.
i
4.
5. Acknowledgments
This thesis concludes almost four years of intensive research, and is the
result of the effort and both indirect and direct support of many people.
I am very grateful for the financial support, provided by the Research
Foundation - Flanders.
First of all, I would like to express profound gratitude to my advisor
Prof. Gerda Claeskens and co-advisor Prof. Bart Baesens. Thank you
for giving me the opportunity to start this PhD project four years ago.
Though only having met briefly before I started, you have both shown
your full support and faith in my abilities from the very beginning. Thank
you both for passing on your great passion for research and guiding me
through my PhD process. Gerda, thank you for always being there when I
needed help, even though supervising five other (post)-doctoral students,
having a busy teaching schedule, your own research to do and a family!
I am still puzzled how you manage to combine all this. Bart, thank you
for passing on your credit risk insights, the interesting contacts with banks
and your help regarding my post-PhD job search. And yes, thank you for
all the great pizza lunches!
Special thanks also go to the other members of the supervisory commit-
tee: Prof. Tony Bellotti, Prof. Ricardo Cao and Prof. Ir`ene Gijbels. The
constructive comments during the doctoral seminars thanks to their deep
insights and expertise in the field led to a significantly improved quality of
the thesis.
I additionally want to thank Professor Bellotti for the very interesting
research stay at Imperial College in the final year of my PhD programme.
iii
6. iv Acknowledgements
These two months in London were amazing, both on a personal and on
an academic level. I really enjoyed our weekly meetings discussing the
research, and it has been a great honor to collaborate for my final PhD
project. Thanks to everyone in my London office for giving me such a
warm welcome, especially to Zhana, who made me feel at home from the
very beginning. I want to express my gratitude to FWO (Fonds voor
Wetenschappelijk Onderzoek) for supporting me with a grant to make this
research stay financially feasible.
My sincere appreciation goes out to Prof. Andrey Vasnev for raising the
idea of introducing unobserved heterogeneity in mixture cure models, and
collaborating on this project. Your remarks and help have substantially
improved the second chapter of this thesis.
Furthermore, I am thankful that KU Leuven provided me with the
facilities to carry out this doctoral research. The weekly organized semi-
nars of the LSTAT group have broadened my knowledge and gave me the
opportunity to regularly meet our nice colleagues from the statistics de-
partment in Heverlee. Running simulation studies and analyzing big data
sets, the computer power provided by the VSC (Vlaams Supercomputer
Centrum) was indispensable. Thank you for the financial and administra-
tive support when attending several conferences in Belgium and abroad.
Because of this support, I was able to finetune my own presentation skills,
attended many interesting presentations and met amazing people.
For my research, real data sets from banks were essential. I am ex-
tremely grateful for all the banks who were willing to provide this data,
despite the legal difficulties regarding confidentiality. The third chapter
in this thesis would not have been there without your faith in me and my
research.
To my colleagues of ORSTAT, it has been such a pleasure meeting you
all. Jonathan and Andreas, thank you for the numerous healthy lunches at
“soup away” at the beginning of my PhD. Some colleagues who were there
at the start of my PhD left by now, but I want to thank them for memorable
moments together, among others, my first conference (the BSS meeting
in Liege): thank you Vishva, Chang, Marjolein, Steffi and Jean-Marc.
7. Acknowledgements v
Special thanks go out to Charles, with whom I spent many coffee breaks
discussing PhD and life in general. Thank you for the continuing friendship
even though seperated by the North Sea. Thanks to my current colleagues
Eugen, Ali, Thomas, Deniz, Peter, Ruben, Nicolas, Viktoria, Ines and Roel
for being so enthusiastic organizing many social events among colleagues:
watching world cup games, playing volleyball, throwing barbecues,. . . I will
miss you and I cherish the memories of these great times together. Special
thanks go out to Roel for the great chats and laughs while sharing an office.
I will definitely miss you making fun of me every time I was amazed once
more by the nice view from our office.
To all the Operational Research-colleagues of ORSTAT, the colleagues
at the Operations Management research group and the colleagues at LIRIS:
thank you for the occasional chats during coffee break and lunch. Special
thanks go to Aim´ee, having a related PhD topic funded by the same project
it was always nice to catch up about our research.
Having ambitious friends is a blessing, though not always easy when
ambition moves your friends all over the country. For my long-time group
of six friends, however, this has not proven to be a problem. I am so proud
of what everyone has achieved and always happy when I can brag about
every single one of you! Nina and Eva, sharing every step of our lives since
kindergarten, I couldn’t have wished for better friends to literally share my
entire life with. Nina, being the person I shared my oldest memory with, I
think it is amazing that we have both chosen to do a PhD after our studies.
It was great to talk about academics and parallels on our workfloor, even
though the differences in our fields. Eva, thank you for sharing our love
for music. From making “musicals” together when we were in primary
school to playing music together on weddings in recent years, these are
the moments I cherish. Ilse, Marie and Floor, thank you for joining our
group of three in high school. I highly value the memories of all our trips
together, and hope many more are to come in the future. Ilse, thank you
for being the only one keeping me company in Leuven. The Scrabble and
beer nights were welcome distractions after an exhausting day of research.
I want to thank Linde, along with tons of knowledge and international
8. vi Acknowledgements
experience the most valuable product of my student years. I highly value
the intense friendship we have built over the last few years, and am ex-
tremely grateful you were back in Belgium in the finishing months of my
PhD.
To all the friends I met during my business engineering studies, the
people I shared a house with, the friends of Hannes who have become my
friends over the years, my quizteam, the music bands I was part of and
everyone who cannot be placed in the previous categories but with whom
I shared memorable moments: thank you!
Thank you Karine, Bernard, Michiel, Laurens, Roxanne and Lieze for
being such an amazing family to Hannes, and by extension, myself. Thank
you for many nice dinners, helping us move all the time (yes, it happend
quite a lot!) and the nice weekends in Oostende and London.
Last but definitely not least I want to thank my family and boyfriend
Hannes. Thank you Hannes, for always being there. Thank you for con-
vincing me to start a PhD programme. Thank you for supporting me in
every decision I took during my PhD, and in the international adventure
that lays ahead. I know this is not the easiest thing to do, but I am so
greatful that you are by my side. Mama and papa, I just don’t know where
to start. I am where I am now thanks to your unconditional love and sup-
port. You are not just my parents, but also the people I can talk to about
anything, and I cannot thank you enough for this. Anneleen, you are not
just my sister but also my very best friend. You living in Hong Kong is
not always easy, but knowing that you are happy there with Max is a big
comfort to me and the rest of the family. Luckily, technology lightens the
burden (thank you, Skype and Whatsapp)! I am beyond happy that you
are coming to Belgium especially for my defense. Dries, thank you for
being the funniest and smartest brother. I am so happy you are having a
blast on your exchange semester in Australia while I am writing this thesis,
and am proud your graduation is approaching as well!
Lore Dirick Leuven, September 2015.
9. Introduction
Since the late eighties, a set of recommendations for regulating the bank-
ing industry was being published by the Basel Committee on Banking
Supervision (BCBS). This committee of banking supervisory authorities
initially contained the G-10 (a group of ten countries that agreed to par-
take in the “General Arrangements to Borrow (GAB)”) central bank gov-
ernors. Although not having an explicit authority, the policies described
in these Basel Accords tend to be implemented by most BCBS member
countries. Currently, (among others) all G-20 major economies (an inter-
national forum to promote and pertain international financial stability) are
represented in the BCBS.
The Basel Accords have changed the strategies of financial institutions
significantly. The 2004 Basel II Accord, superseding the 1988 Basel I Ac-
cord, played a particularly important role in this strategy shift. One of
the key goals of this accord was the encouragement of continuous improve-
ments in risk measurement. To achieve this, the Basel II Accord stipulated
that large banks should be allowed to use risk assessment based on their
own models to determine the minimum amount of capital they need to hold
as a buffer against unexpected losses. The credit crisis in 2008 led to sub-
stantial criticism on the Basel II Accord and this statement in particular,
as many banks were being said to have entered the crisis with insufficient
liquidity buffers. The need for more strict regulations became apparent,
and the requisite of minimum capital requirements was supplemented by
other forms of reserves in the Basel III Accord, in this way complementing
the Basel II accord rather than superseding it.
vii
10. viii Introduction
0 5 10 15 20
0.20.40.60.81.0
Time
S(t)
Figure 1: A survival function
Notwithstanding the criticism, the importance of Basel II should not
be underestimated, as this accord gave rise to a more model-based focus
in the banking industry. With typically a major focus on basic regression
techniques such as logistic regression for modelling “good” versus “bad”
customers, growing research in other areas of statistics and machine learn-
ing, which were known but less explored in this context, was a result. One
of these areas, and at the same time the backbone of this dissertation, is
survival analysis.
With important initial applications in actuarial sciences through life
tables, survival analysis is a widespread method in the biomedical context
and deals with the analysis of the duration time until a certain event, such
as the time of death in biological organisms. Other fields where survival
analysis is used are engineering (where it is often referred to as “reliability
analysis”) and sociology (“event history analysis”). A typical property of
survival analysis is that this method can deal with censored data. Re-
capturing the biological example, censoring takes place when death is not
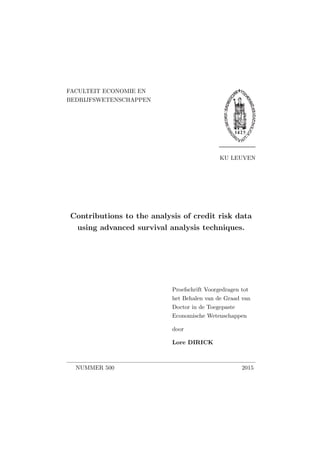
observed for certain subjects in the sample. Typically, a survival function
or curve is drawn (See Figure 1). This function represents S(t) = P(T > t),
11. Introduction ix
or in words, the probability that the time of the event of interest is later
then some specified time t, for every t.
Defining loan “default” (or, as an extension, “early repayment”) as the
event of interest, the appropriateness of using survival analysis in the credit
risk content becomes apparent. The advantage of using this method in
this context, as opposed to more frequently used classification techniques,
is that
(1) It is possible to compute a “probability of default” or a PD-estimate,
which is a key parameter in credit scoring, at every point in time
during the loan term.
(2) One can predict the expected time of default (more information on
this can be found in Chapter 3).
Despite the fact that there are certain analogies between medical sur-
vival and survival in a credit loan context, there are also differences that
might make the standard survival approach inappropriate for the analysis
of credit data. The main problem is that typically, a very high proportion
of credit data is right-censored, not only because the customer default is
not observed during the observation period, but simply because default
does not take place in the entire loan lifetime. To model a so-called “in-
susceptible” part of the loan population, mixture cure models can be used.
A survival curve using a mixture cure model with cured fraction 0.3 is
shown in Figure 2. Where a non-mixture survival function goes to zero
when t → ∞, the survival function goes to the cured fraction when using
a mixture cure model. Although survival models in a non-mixture context
make their appearance in this thesis (in Chapter 3), mixture cure models
play a central role in every chapter.
In Chapter 1, the mixture cure model, for single and multiple events,
is explained in more detail. As there is typically a missing data-problem,
as there is no complete information on which part of the population is
“susceptible” to default (or early repayment) and which part is not, an
appropriate version of Akaike’s information criterion (AIC) is derived and
applied to these models.
12. x Introduction
0 5 10 15 20
0.00.20.40.60.81.0
Time
S(t)
Figure 2: A survival function using a mixture cure model
Certain loan applicant characteristics that would affect the time of
default or early repayment, might not be observed. In Chapter 2, this
problem is addressed by incorporating “unobserved heterogeneity” in the
mixture cure model. For model fitting purposes, a hierarchical expectation-
maximization algorithm is derived.
In Chapter 3, we take a step outside the mixture cure framework, and
perform a benchmark study comparing several survival techniques (both
mixture and non-mixture survival models). These survival analysis tech-
niques are applied to ten different data sets from five financial institutions,
and evaluated using three different types of evaluation metrics: receiver op-
erating characteristics curves, default time prediction and expected future
values of the loan.
Standard mixture cure models include time-independent covariates in
the survival analysis part of the model. Chapter 4 extends the mixture cure
model such that time-dependent covariates can be included. The method is
applied to real life credit data including both personal (time-independent)
13. Introduction xi
information of the loan applicants and macro-economic factors that change
over time.
The various chapters in this thesis can be found in:
(i) Dirick, L., Claeskens, G. and Baesens, B. (2015). An Akaike infor-
mation criterion for multiple event mixture cure models. European
Journal of Operational Research, 241:449–457.
(ii) Dirick, L., Claeskens, G., Vasvnev, A. and Baesens, B. (2015). A
hierarchical mixture cure model with unobserved heterogeneity using
the EM-algorithm. Working paper, submitted.
(iii) Dirick, L., Claeskens, G. and Baesens, B. (2015). Time to default in
credit scoring using survival analysis: a benchmark study. Working
paper, submitted.
(iv) Dirick, L., Bellotti, T., Claeskens, G. and Baesens, B. (2015). Macro-
economic factors in credit risk calculations: including time-varying
covariates in mixture cure models. Working paper, submitted.
14.
15. List of abbreviations
abbreviation meaning
AFT Accelerated failure time
AIC Akaike information criterion
AICcd Complete-data Akaike information criterion
AUC Area under the curve
B-spline Basis spline
BCBS Basel committee on banking supervision
Cox PH Cox proportional hazards
EFT Expected future value
EM (algorithm) Expectation-maximization (algorithm)
FV Future value
GDP Gross domestic product
MAD Mean absolute deviation
MV Macro-economic variable
P-spline Penalized spline
PD Probability of default
PE Probability of early repayment
PM Probability of maturity
ROC Receiver operating characteristics
TVC Time-varying covariate
xiii
20. xviii Table of contents
4.8 Discussion . . . . . . . . . . . . . . . . . . . . . . . . . . . . 122
5 General conclusions and research perspectives 125
General conclusions and research perspectives 125
List of figures 127
List of tables 131
Bibliography 137
Doctoral dissertations from the Faculty of Economics and
Business 149
21. Chapter 1
An Akaike information criterion
for multiple event mixture cure
models
Abstract
We derive the proper form of the Akaike information criterion for
variable selection for mixture cure models, which are often fit via the
expectation-maximization algorithm. Separate covariate sets may be
used in the mixture components. The selection criteria are applicable
to survival models for right-censored data with multiple competing
risks and allow for the presence of a non-susceptible group. The
method is illustrated on credit loan data, with pre-payment and de-
fault as events and maturity as the non-susceptible case and is used
in a simulation study.
This chapter is based on Dirick, L., Claeskens, G. and Baesens, B.
(2015). An Akaike information criterion for multiple event mixture
cure models. European Journal of Operational Research, 241:449–
457.
1
22. 2
An Akaike information criterion for multiple event mixture
cure models
1.1 Introduction
The topic of credit risk modeling has now become more important than
ever before. The introduction of compliance guidelines such as Basel II
and Basel III has a huge impact on the strategies of financial institutions
nowadays. The Basel Accords aim at quantifying the minimum amount of
buffer capital so as to provide a safety cushion against unexpected losses
(Van Gestel and Baesens, 2008). A key credit risk parameter is the prob-
ability of default (PD) measuring the likelihood of an obligor to run into
arrears on his/her credit obligation.
PD models are typically constructed using classification techniques
such as logistic regression (Baesens et al., 2003). However, the timing
when customers default is perhaps of even more interest to analyze since
it can provide the bank with the ability to compute the profitability over
a customer’s lifetime and perform profit scoring. The problem statement
of analyzing when customers default is commonly referred to as survival
analysis (see, e.g., Bellotti and Crook, 2009). It is the purpose of this
chapter to provide a valid model selection criterion for variable selection
inside such survival models, specifically applied to credit risk modeling,
with as particular characteristics allowing for defaults, maturity and early
repayments in a mixture cure rate model and allowing for right-censored
data.
In this chapter we deal with right-censored failure times in a mixture
model context. This implies that there are two sources of incompleteness:
(i) the right-censoring causes some of the event times to remain unobserved,
it is only known that the event of interest did not yet take place, and (ii)
not for all observations it is known to which component of the mixture
model they belong; in fact, only when an observation is uncensored, we
have this information. For this type of cure rate models no information
criteria have yet been derived.
For incomplete and partially observed data, Cavanaugh and Shumway
(1998) derive a version of the Akaike information criterion (AIC Akaike,
1973) that makes use of the expected complete data log-likelihood, rather
23. 1.1. Introduction 3
than the observed log-likelihood. They coined the name AICcd to this
criterion. The use of the likelihood for the observed cases is discouraged
since a comparison of this ‘model’ likelihood to a ‘true’ likelihood for the
observed cases only is rarely of interest. By working with the complete
data log-likelihood, and considering the Kullback-Leibler (KL) distance
between the model and true data generating process for the complete data,
the AICcd is able to select models, taking unobserved and latent variables
into account. The method uses directly the output of the expectation-
maximization (EM) algorithm (for more information on the EM-algorithm,
we refer to McLachlan and Krishnan, 2007). We explain its definition and
use below. For a comprehensive explanation of the AIC, see Claeskens and
Hjort (2008, Chap. 2).
Similar variations on the AIC are studied by Claeskens and Consentino
(2008), who use the output of an EM algorithm to define variable selec-
tion methods for models with missing covariate data in a linear regression
setting and by Ibrahim et al. (2008) for missing data variable selection in
generalized linear models.
For the case of right-censored data (not in a mixture), Liang and Zou
(2008) work with an accelerated life time model and propose for that model
a finite sample correction to the standard AIC, motivated from an expo-
nential model with constant censoring. For parametric survival models
Suzukawa et al. (2001) derive a version of the AIC taking the censoring
into account, though require a non-standard estimation method for prac-
tical use. Fan and Li (2002) used a smoothly clipped absolute deviation
penalty for the semiparametric Cox proportional hazard models, Hjort and
Claeskens (2006) derived a focussed information criterion, while Xu et al.
(2009) define an AIC based on the profile likelihood for proportional hazard
mixed models, see also Donohue et al. (2011) for a related model selection
approach. None of these papers made use of the EM algorithm to de-
fine the variable selection criterion, and neither did they consider mixture
models.
In Section 1.2 we first consider the Akaike information criterion for
the case of a mixture cure model with one event of interest and a group
24. 4
An Akaike information criterion for multiple event mixture
cure models
non-susceptible to this event. In Section 1.3 we extend the applicability
of the AIC to the model recently proposed by Watkins et al. (2014) that
provides a simultaneous modeling of multiple event times, potentially right
censored, in the presence of a non-susceptible group. While parametric
survival models can be used as in the approach of Watkins et al. (2014), in
this chapter we use the semiparametric Cox proportional hazard model for
the susceptible part(s) of the mixture model and we use logistic regression
for the incidence part. Simulation results are given in Section 1.4 and an
application to credit loan data is presented in Section 1.5.
1.2 The mixture cure model for a single event
Mixture cure models were motivated by the existence of a subgroup of
long-term survivors, or ‘immunes’ in a medical context. This subgroup,
with survival probabilities set equal to one, is incorporated in a model
through a mixture distribution where a logistic regression model provides a
mixing proportion of the ‘non-susceptible’ cases and where a survival model
describes the cases susceptible to the event of interest. Such models were
introduced by Farewell (1982) in a parametric version, and later generalized
to a semi-parametric mixture model combining logistic regression and Cox
proportional hazards regression by Kuk and Chen (1992), see also Sy and
Taylor (2000b). Recently, Cai et al. (2012a) introduced the R-package
smcure to estimate such semi-parametric mixture models.
Tong et al. (2012) use a mixture cure approach to analyze the credit
risk of a specific customer, where the event of interest is the time of default
when customers stop paying back their loans. This setting is characterized
and distinguishes itself from typical medical settings by a heavy right-
censoring, since most customers do not default. A relatively large group of
non-susceptible cases is expected to be present. Part of the explanation of
this high percentage of censoring is that both prepayments and maturity
(loan completely paid back on time) are considered censored for default.
For a separate analysis of default and prepayment, see, e.g., Stepanova and
Thomas (2002a).
25. 1.2. The mixture cure model for a single event 5
1.2.1 Model notation
We denote the ‘true’ event time by U and the censoring time by C. We
assume independence between event times and censoring times. Denote
by Y a binary random variable where Y = 1 expresses susceptibility to
the event of interest and Y = 0 indicates that the event will never hap-
pen. When U > C, the event is right-censored; the observed event time
T = min(U, C). Let the indicator δ = I(U ≤ C), thus δ = 1 indicates non-
censored observations. The combination of values for Y and δ generates
three different states:
(1) Y = 1 and δ = 1: uncensored and susceptible, so the event takes
place during the observation period of the data;
(2) Y = 1 and δ = 0: censored and susceptible, no event during the
observation period, but it will eventually take place;
(3) Y = 0 and δ = 0: censored and non-susceptible, no event is observed,
nor will it take place in the future.
Note that values for T and δ are fully observed while Y is only observed
when δ = 1 and is latent otherwise. Similarly, we do not observe U when
δ = 0. The sample information consists of values (Ti, δi), for i = 1, . . . , n,
together with some covariate information.
The incidence model component uses logistic regression to model P(Y =
1; z) = π(z, b) with logit{π(z, b)} = z b for a r-vector of covariates
z = (z1, . . . , zr) . For the latency model, a semiparametric Cox propor-
tional hazard regression model is used such that the survival probability
at time t, conditional on Y = 1, is modeled as
S(t | Y = 1; x, β) = exp − exp(xT
β)
t
0
h0(u | Y = 1)du ,
with h0 the unspecified baseline hazard function and x a q-vector of covari-
ates x = (x1, . . . , xq) , which may or may not contain the same components
as z. Denote that in our notation, while conditioning on Y , the arguments
x and β are separated by a semicolon, as these are the respective covariate
and parameter vectors and no conditioning arguments. This yields the
26. 6
An Akaike information criterion for multiple event mixture
cure models
so-called “unconditional” survival function, for given values of x, z of the
covariates and parameters b, β
S(t; x, z, β, b) = π(z, b)S(t | Y = 1; x, β) + 1 − π(z, b), (1.1)
and the observed likelihood
Lobs(b, β) =
n
i=1
{π(zi, b)f(ti | Yi = 1; xi, β)}δi
×{(1 − π(zi, b))+π(zi, b)S(ti | Yi = 1; xi, β)}1−δi
,(1.2)
with f(ti | Yi = 1; xi, β) the event density function for given covariate x
and corresponding parameter vector β, conditional on Y = 1. The relation-
ship between this conditional event density function and the conditional
survival function is given by
f(ti | Yi = 1; xi, β) = h(ti | Yi = 1; xi, β)δi
S(ti | Yi = 1; xi, β),
with h(ti | Yi = 1; xi, β) the conditional hazard function. The complete
likelihood, given full information on Y , can be expressed as:
Lcomplete(b, β) = 1−π(zi, b)
(1−Yi)
π(zi, b)Yi
×h(ti | Yi = 1; xi, β)δi,Yi
S(ti | Yi = 1; xi, β)Yi
.
1.2.2 The Akaike information criterion for single event mod-
els
For estimation of mixture cure models, Cai et al. (2012a) explain the use
of the expectation-maximization (EM) algorithm to deal with the latent Y
values. If Y = Y ∗ would be observed for all cases, the log-likelihood for the
data triplets (Ti, δi, Yi) could be used in the AIC to lead to the (infeasible)
AICinfeasible = −2 log LT,δ,Y (Θ; Ti, δi, Y ∗
i ) + 2d, (1.3)
where d counts the number of parameters in the model, and Θ is the
maximum likelihood estimator of the parameter vector Θ.
27. 1.2. The mixture cure model for a single event 7
The AIC estimates the expected value of the Kullback-Leibler discrep-
ancy between the model and the unknown true data-generating process,
without having to know this true process.
In the general case with random variables R = (R1, . . . , Rn), a model
f(r; Θ), with r an instance of R, and the density of the true data-generating
process g(r), the Kullback-Leibler discrepancy is given by KL{g, f(·; Θ)} =
Eg log
g(R)
f(R; Θ)
, where the subscript g reminds of using the true den-
sity function g to compute the expectation. Define Θ0 as the least false
parameter value that minimizes the KL discrepancy between the model
density f(·; Θ) and the true density g, Θ0 = arg minΘ KL{g, f(·; Θ)}.
Since Eg[log g(R)] does not vary when searching through several candi-
date models, minimizing KL{g, f(·; Θ)} over different models is equivalent
with minimizing the quantity DR(Θ) = Eg{−2 log f(R; Θ)}, where the
expectation is computed using the true density function of the data.
In our notation R = (T, δ, Y ), which can be split in an observed vector
Robs = (T, δ) and a “missing” part Rmis = Y indicating that Y is not
always observed. The expected complete-data log likelihood can be written
as
Q∗
(Θ) = E[Y ][log fT,δ,Y (T, δ, Y ; Θ)|T, δ]
=
n
i=1
log fT,δ,Y (Ti, δi, Yi = 0; Θ)P(Yi = 0 | Ti, δi; Θ)
+ log fT,δ,Y (Ti, δi, Yi = 1; Θ)P(Yi = 1 | Ti, δi; Θ).
Note that this is the conditional expectation of the log likelihood over Y
given T and δ.
By rewriting the true joint density of the vector R, with r = (t, delta, y),
as g(r) = gY |T,δ(y|t, δ) · gT,δ(t, δ), and knowing that the expression of
Q∗(Θ) is depending on T and δ, the expected value of Q∗(Θ) is DR(Θ) =
E[T,δ][−2Q∗(Θ)]. Because Θ is estimated through Θ, DR(Θ) is a random
variable and the AIC procedure estimates E[DR(Θ)] using the sample in-
formation.
As used in the EM algorithm, for two values, Θ1 and Θ2 of the param-
28. 8
An Akaike information criterion for multiple event mixture
cure models
eter vector Θ = (b, β) the expected complete-data log likelihood applied
to our problem can be estimated by, see also Cai et al. (2012a),
Q(Θ2 | Θ1) =
n
i=1
log fT,δ,Y (Ti, δi, Yi =0; Θ2)P(Yi =0 | Ti, δi; Θ1)
+ log fT,δ,Y (Ti, δi, Yi =1; Θ2)P(Yi = 1 | Ti, δi; Θ1).(1.4)
Denote the first partial derivative ˙Q(Θ2 | Θ1) = ∂
∂Θ2
Q(Θ2 | Θ1) and the
second partial derivative ¨Q(Θ2 | Θ1) = ∂
∂Θ2∂Θ2
Q(Θ2 | Θ1). The EM ap-
proach proceeds by maximizing Q(Θ2 | Θ1) over Θ2, and by replacing the
current Θ1 by the maximizer. These steps are iterated until convergence.
The resulting value of Θ is denoted by Θ.
In the context of missing data, Claeskens and Consentino (2008) prove
in their Theorem 1 that for a model density f that is two times continuously
differentiable with respect to Θ, and which has a bounded expectation
of the second derivative in a neighborhood of Θ0, which belongs to the
interior of a compact parameter space, if n(Θ−Θ0) (Θ−Θ0) is uniformly
integrable, with the prime denoting a transpose, then
E[DR(Θ) − Q(Θ|Θ)]/n = trace{I−1
(Θ0) · J(Θ0)}/n + o(1/n),
where I(Θ) = E{− ¨Q(Θ | Θ)/n}, and J(Θ) = Var{ ˙Q(Θ | Θ)}/n.
Following Cavanaugh and Shumway (1998), by first taking a Taylor
series expansion of ˙Q(Θ0 | Θ) around Θ, leads to estimate J(Θ0) by
I(Θ)I−1
o (Θ)I(Θ), and further to estimate I(Θ0) by Ioc(Θ), where
Ioc(Θ) = −n−1 ∂2Q(Θ | Θ)
∂Θ · ∂Θ
, Io(Θ) = −n−1
n
i=1
∂2 log fT,δ(Ti, δi; Θ)
∂Θ · ∂Θ
.
This leads us to define the complete data AIC by
AICcd = −2Q(Θ | Θ) + 2 trace{Ioc(Θ) · I−1
o (Θ)}. (1.5)
Note that this derivation has relaxed the strong assumption of Cavanaugh
and Shumway (1998) to have the model correctly specified, that is, they
assumed that g(r) = f(r; Θ0). By working with least false parameter
values, we avoided this strong assumption.
29. 1.2. The mixture cure model for a single event 9
The computation of Io, which requires the joint density of (T, δ), not
including Y , is facilitated by the use of the supplemented EM-algorithm
(Meng and Rubin, 1991). The EM-algorithm implicitly defines a mapping
Θ → M(Θ) = (M1(Θ), . . . , Md(Θ)) from the parameter space to itself
such that Θ
(m+1)
= M(Θ
(m)
) for m = 0, 1, . . . . A Taylor series expansion
in the neighborhood of Θ yields that
(Θ
(m+1)
− Θ) ≈ (Θ
(m)
− Θ) DM, where DM =
∂Mj(Θ)
∂Θi Θ=Θ
,
a d × d-matrix evaluated at Θ = Θ. Meng and Rubin (1991) further show
that I−1
o = I−1
oc (Id − DM)−1, with Id a d × d identity matrix. For more
details on the computation of DM, we refer to Chap. 12 of Gelman et al.
(2004) and Section 3.3 of Meng and Rubin (1991). Using (1.5), this leads
to the AICcd as we use it in this chapter,
AICcd = −2Q(Θ | Θ) + 2 trace(Id − DM)−1
= −2Q(Θ | Θ) + 2d + 2 trace{DM(Id − DM)−1
}. (1.6)
This criterion differs in two aspects from the infeasible AIC in (1.3). First,
the expected complete data likelihood is used, and second, there is a correc-
tion to the penalty term that takes the complexity of the modeling process
due to the missing information into account. When all data are observed,
DM = 0 and the penalty reduces to the classical one.
We wish to mention that the mixture regression criterion of Naik et al.
(2007) as an extension of the AIC to select both the number of components
in the mixture and the variables within each component is not suitable for
our purpose. Indeed, we know exactly the number of components in the
mixture from the problem content, moreover even partial cluster mem-
bership is known. Only for censored observations the group membership
is unknown. In addition, the mixture regression criterion assumes fully
observed cases, while these data here are intrinsically censored.
30. 10
An Akaike information criterion for multiple event mixture
cure models
1.2.3 AIC explicitly incorporating censoring
An alternative treatment of the censored observations is to treat the cen-
sored times as “missing” event times. The model that we wish to find
should be well for describing the true event times U, and not only for the
observed times T. Therefore, we start by writing the joint log likelihood
of (U, Y ) as, with Θ = (β, b),
Ln(Θ; U, Y ) =
n
i=1
log PY (zi, b) + log ˜fY (Ui; β) ,
where PY (zi) = π(zi, b) when Yi = 1 and PY (zi) = 1 − π(zi, b) when
Yi = 0. Note that, with Ci the censoring time for observation i, if Ti ≤
Ci, the true event time is observed and Ui = Ti, while if Ti > Ci, the
true event time Ui is not observed.We define ˜fY (ui; Θ) = fT|Y (ti | Yi =
1; β)δi fU|Y (ui | Yi = 1; β)(1−δi) when Yi = 1 and take ˜fY (ui) = 1 when
Yi = 0. The Q-function for use in the EM-algorithm and the AIC can here
be defined as,
Q(Θ2; Θ1) =
n
i=1
log π(zi, b2)
+E[U] log ˜fY (Ui | Yi = 1; Θ2) | Ti; Θ1 w1i(Θ1)
+
n
i=1
log (1 − π(zi, b2)) + log 1 (1 − w1i(Θ1)),
where w1i(Θ1) = P(Yi = 1 | Ti = t; Θ1) and the expectation ‘E[U]’ is
here computed with respect the model density of true event times U, given
Y = 1 and using parameter value Θ1. Recall that, if Ti ≤ Ci, the true
event time is observed and Ui = Ti. Then we have that
E[U] log ˜fY (Ui | Yi = 1; Θ2) | Ti; Θ1
=
n
i=1
δi log fT|Y (Ti | Yi = 1; Θ2)
+
n
i=1
(1 − δi)E[U][log fU|Y (Ui | Yi = 1; Θ2) | Ti; Θ1].
31. 1.3. AIC for multiple event mixture cure models 11
This leads to defining the function Q for use in an EM-algorithm in the
following way,
Q(Θ2 | Θ1) =
n
i=1
log π(zi, b2)w1i(b1, β1)
+
n
i=1
log(1 − π(zi, b2)){1 − w1i(b1, β1)}
+
n
i=1
δi log fT|Y (Ti | Yi = 1; β2)w1i(b1, β1)
+
n
i=1
(1 − δi)
∞
ci
log fU|Y (ui | Yi = 1; β2)fU|Y (ui | Yi = 1; β1)dui
P(Ti ≥ Ci | Yi = 1; β1)
w1i(b1, β1),
with
w1i(Θ) = P(Yi = 1 | Ti = t; Θ)
=
π(zi; b) log fU|Y (Ui | Yi = 1; β)
π(zi, b) log fU|Y (Ui | Yi = 1; β)) + (1 − π(zi, b))
for δi = 0
1 for δi = 1.
Defining the AICcd proceeds as in Section 1.2.2 using this function Q. The
resulting AICcd has a correct Kullback-Leibler interpretation for right-
censored data from a mixture distribution. This way of incorporating the
censoring provides (in models without mixture) an alternative to the AIC
proposed by Suzukawa et al. (2001).
1.3 AIC for multiple event mixture cure models
We extend the parametric competing risk model of Watkins et al. (2014)
by allowing for the semiparametric Cox proportional hazard model. In
this model one distinguishes multiple events (e.g., default, prepayment) for
which the time to event is important and considers another class of events
(such as maturity) which happen at a fixed time. This class encompasses
the group of ‘immunes’ in Section 1.2. For the multiple event mixture cure
model, censored loans are the loans that are still being repaid. As a result,
32. 12
An Akaike information criterion for multiple event mixture
cure models
although these loans will eventually experience one of these three events,
the eventual outcome is not clear yet. For the formulation of this model,
three indicators are used:
(1) Ym, indicating that the loan is considered to be mature, so repayed
at the indicated end date of the loan;
(2) Yd, indicating that default takes place;
(3) Yp, indicating that early repayment takes place.
Note that this set of (Ym, Yd, Yp) is exhaustive and mutually exclusive.
However, when an observation is censored, it is not known which event type
will occur. In analogy to the eqs. (1.1) and (1.2), the survival function,
unconditional on the Y -triplet for given values of the covariates xp, xd and
z, can be written as (denote πp(z) = P(Yp = 1; z), πd(z) = P(Yd = 1; z))
S(t; xp, xd, z) = πp(z)Sp(t | Yp = 1; xp)
+πd(z)Sd(t | Yd = 1; xd) + 1 − πp(z) − πd(z) ,
with Sp and Sd denoting the survival functions for, respectively, prepay-
ment and default. Note that mature loans are handled as special cases,
as maturity should not be considered as a real event. Hence, there is no
survival function for maturity, or the survival function could simply be
considered to be equal to one until the maturity date. Using the subscript
‘1’ for default (d) and ‘2’ for prepayment (p), the corresponding observed
likelihood is given by
Lobs(Θ) =
n
i=1
2
j=1
πj(zi, bj)fj(ti |Yj,i = 1; xj,i, βj)
Yj,i
1−
2
j=1
πj(zi, bj)
Ym,i
δi
× 1−
2
j=1
πj(zi, bj) +
2
j=1
πj(zi, bj)Sj(ti |Yj,i = 1; xj,i, βj)
1−δi
,
where Θ = (bp, bd, βp, βd). Note the flexibility of this model; each model
part may employ its own set of covariates, hence the vectors xd, xp and z
may be different. We rewrite this model for use in an EM algorithm such
that the AICcd of (1.6) may be applied for model selection. For this pur-
pose, we start from the complete likelihood, hence the likelihood expression
33. 1.4. Simulation study 13
under the assumption that full information on Y = (Ym, Yd, Yp) is present
Lcomplete(Θ; δi, Yi, Ti)
=
n
i=1
2
j=1
πj(zi, bj)
Yj,i
1 −
2
j=1
πj(zi, bj)
Ym,i
×
2
j=1
hj(t | Yj,i = 1; xj,i, βj)δi
Sj(tj,i | Yj,i = 1; xj,i, βj)
Yj,i
.
Converting to the log likelihood and computing the expected value this
time using the model density with parameter Θ1 leads us to the Q-function
as given in (1.4),
Q(Θ2 | Θ1) = Ef [log Lcomplete(Θ2; Ti, δi, Yi) | Ti, δi; Θ1]
=
n
i=1
2
j=1
wji log(πj(zi, bj)) + wmi log(1 −
2
j=1
πj(zi, bj))
+
2
j=1
δi log(hj(ti | Yj = 1; xj,i, βj))
+ wji log(Sj(ti | Yj = 1; xj,i, βj)) .
Note that conditional expectations of Yj,i (j = 1, 2), Ef Yj,i | Ti, δi; Θ1],
are computed here with respect to the model density using parameter Θ1
and are denoted by wji with wmi = 1 − w1i − w2i and for j = 1, 2,
wji = wji(Θ) = P(Yj = 1 | T = ti, δi; Θ)
=
πj(zi, bj)Sj(ti; βj)
2
k=1 πk(zi, bk)Sk(ti; βk) + (1−
2
k=1 πk(zi, bk))
for δi = 0
1 for Yj,i =1; δi = 1
0 for Yj,i =0; δi =1.
1.4 Simulation study
1.4.1 Simulation settings
All computations were performed in R (R Core Team, 2014), adapting the
library smcure (Cai et al., 2012a) to produce the AICcd values.
34. 14
An Akaike information criterion for multiple event mixture
cure models
variable v1 v2 v3 v4 v5
Distr. Ber(0.7) Γ(λ = 2.74, r = 1.3086) N(1, 1) N(1, 2) Ber(0.66)
Table 1.1: Distributions of z1–z5 used in the simulation study.
Three different simulation settings were used. For each simulation set-
ting, 100 simulation runs with n=5000 observations and 5 variables were
executed. The probability of being susceptible, that is (1 − π(v)) was gen-
erated using the relationship π(v) =
exp(b v)
1 + exp(b v)
, with variables v1–v5
of which the distributions are stated in Table 1.1 and with parameters b
as in Table 1.2. True Y -values are consequently generated via a Bernoulli
distribution using these probabilities π(v). For the uncured part of the
population, Weibull default times (shape parameter = 1, scale parameter
= 0.5) were generated, using the same five variables v1–v5 with the dis-
tributions and parameter values β as in Tables 1.1 and 1.2. For the first
two simulation settings, censoring times were uniformly distributed on the
interval [0, 1]. For setting 3, censoring times were uniformly distributed
on the interval [0, 20], in order to lower the amount of censoring compared
to settings 1 and 2. Each time we performed an exhaustive model search,
thus (25 − 1)2 = 961 AICcd’s were calculated for every simulation run.
The purpose of this simulation study is to examine to what extent the
AICcd is capable of selecting the correct covariate vectors x = (v1, v4) and
z = (v1, v2, v5). Note that, because of the presence of all types of covari-
ate distributions in the credit risk context, the distributions in Table 1.1
are not restricted to normal distributions, but also gamma and Bernoulli
distributions are included.
In the first simulation setting, the censoring percentage was 60% (hence,
around 3000 observations were censored, δ = 0) and 80% of the observa-
tions were susceptible (Y = 1). For setting 2, we mimicked the situation of
the data example (see Section 1.5), resulting in the uncensored percentage
nearly equal to 10%, and the susceptible percentage of the observations
equal to 20%. For setting 3 the censoring time interval was increased
35. 1.4. Simulation study 15
parameter (intercept) b1 b2 b3 b4 b5 β1 β2 β3 β4 β5
Setting 1 & 3 3 3.5 -1 0 0 -1 2.5 0 0 -1 0
Setting 2 1 1.5 -1.5 0 0 -1.8 2.5 0 0 -1 0
Table 1.2: Simulation study. Parameter values of the true model.
from [0,1] to [0,20], resulting in more observed defaults, and less censor-
ing. Because of this, the real default time was observed for 70% of the
observations, with 80% susceptible observations as in setting 1.
For comparison purposes, four other versions of AIC were calculated:
AICcs = −2 log LCox (ˆβ, x) + 2dCox,
AICcl = −2 log LCox (ˆβ, x) + 2dCox,Log,
AICls = −2 log LLog (ˆb, z) + 2dLog,
AICll = −2 log LLog (ˆb, z) + 2dCox,Log.
The first subscript of the AIC’s is either c or l, which stands for “Cox”
or “Log” and indicates the likelihood of the survival or logistic part of
the mixture only. The second subscript indicates whether a “short” (s) or
“long” (l) penalty term was used. A short penalty term means that the
parameters accounted for are only calculated by the model specified in the
first subscript, and a long penalty term incorporates all the parameters.
The penalty is defined to be twice the number of considered parameters.
The reason for comparing the AICcd to those at first sight rather naive
AIC-calculations, is because in practice, those AICs might by some re-
searchers be in use instead of the corrected version with complete-data log
likelihoods when analyzing mixture cure models. We want to investigate
whether it is reasonable to use those AICs. We are not aware of other
model selection criteria for mixture cure models.
36. 16
An Akaike information criterion for multiple event mixture
cure models
Settings Method Mean rank Log - Log + Cox - Cox + Total - Total +
MAX 961 3 2 2 3 5 5
1 AICcd 107.85 1.14 0.90 0.02 1.68 1.16 2.58
AICcs 163.13 1.63 1.51 0.00 0.66 1.63 2.17
AICcl 163.91 1.70 1.19 0.00 0.67 1.70 1.86
AICls 155.26 1.43 0.44 0.67 1.58 2.10 2.02
AICll 151.67 1.46 0.48 0.67 1.13 2.13 1.61
2 AICcd 59.81 0.00 1.32 0.17 1.44 0.17 2.76
AICcs 95.06 0.88 1.51 0.01 0.83 0.89 2.34
AICcl 94.95 1.02 1.07 0.01 0.76 1.03 1.83
AICls 162.64 0.02 1.46 1.99 1.55 2.01 3.01
AICll 159.58 0.02 1.43 2.00 1.17 2.02 2.60
3 AICcd 13.01 0.00 0.84 0.00 0.91 0.00 1.75
AICcs 79.53 1.28 1.49 0.00 0.41 1.28 1.90
AICcl 80.39 1.35 0.99 0.00 0.41 1.35 1.40
AICls 151.68 2.58 1.16 1.06 2.32 3.64 3.48
AICll 147.33 2.59 1.17 1.06 2.02 3.65 3.19
Table 1.3: Simulation settings 1 – 3, 100 runs for an exhaustive search.
Averages for underfitting (-) and overfitting (+) in terms of variables as
compared to the true model, for each part of the mixture model, and for
the combined parts (total).
1.4.2 Simulation results
Table 1.3 summarizes some model selection aspects of the AICs. The
results of all simulation runs were averaged. Next to the type of AIC
used, we list the ranking (among the 961 models) of the true model as
simulated. The next four columns indicate the average number of variables
that were lacking in the selected model (-) or were unnecessarily included
in the selected model (+) for the log-component and the Cox-component
respectively as compared to the “true” model. The last two columns are
the joint averaged over- and underselection values.
The simulated data were generated using three true variables for the
log-model, and two variables for the Cox-model. The first line in Table 1.3
indicates the maximum value possible for each column of the table. A
37. 1.4. Simulation study 17
perfect selection would give a mean rank of 1 (= the “true” model is always
selected), and 0-values for all the other entries, indicating that all necessary
variables are present in the model, and all the unnecessary variables are left
out. AIC is known to be an efficient model selection method with regard
to mean squared prediction error (Claeskens and Hjort, 2008, Chap 4),
though not to be consistent hence we do not expect to find small ranks for
the true model here. Moreover, the chosen settings are quite demanding
with large percentages of censored data (especially for settings 1 and 2),
which are typical to credit risk studies, as opposed to medical studies where
those percentages are usually much smaller.
The simulation study indicates that for these settings the Cox part of
the log-likelihood is dominant, both in magnitude and for model selection
purposes. In Table 1.3, we see that AICcd outperforms the other criteria
regarding the mean rank of the true model for all three settings. Overfitting
proportions are favorable for the low-censored setting (setting 3), but quite
high for setting 1 and 2. On the other hand, underfitting proportions are
low for the AICcd compared to the other measures. This is an important
result as underfitting (missing important predictors) is considered worse
than overfitting. When looking at the change in result as the censoring
percentage changes, it becomes clear that high percentages of censored
cases on one hand (setting 2) and a big discrepancy between observed
versus true defaults (setting 1) have a negative impact on the performance
of any information criterion. This gives us a strong indication that it would
be advisable to incorporate additional information (such as in the multiple
event models) to reduce the number of censored cases.
A comparison with the simpler criterion that just counts the number of
parameters is for the chosen settings not behaving too badly, since it turns
out that the correction term involving DM takes values in a bounded
range, and is here not influencing the model order too much. Again, we
stress that no other information criteria have yet been developed for these
mixture models, which could have made the comparison more interesting.
For comparisons of AICcd in regression models to other AIC-like versions
we refer to Cavanaugh and Shumway (1998).
38. 18
An Akaike information criterion for multiple event mixture
cure models
Description Type
v1 The gender of the customer (1=M, 0=F) Categorical
v2 Amount of the loan Continuous
v3 Number of years at current address Continuous
v4 Number of years at current employer Continuous
v5 Amount of insurance premium Continuous
v6 Home phone or not (1=N,0=Y) Categorical
v7 Own house or not (1=N, 0=Y) Categorical
v8 Frequency of payment(1=low/unknown, 0=high) Categorical
Table 1.4: Credit loan data. Description of the variables.
1.5 Variable selection for a credit loan dataset
1.5.1 Data and method
The survival analysis techniques were applied to personal loan data from a
major UK financial institution. All customers are UK borrowers who had
applied to the bank for a loan. The data set consisted of the application
information of 50,000 personal loans, together with the repayment status
for each month of the observation period of 36 months. We note that the
same data were also used in Stepanova and Thomas (2002a) and later by
Tong et al. (2012). In this chapter only a subset of the loans with loan term
36 months were used for the analysis (containing n =7521 observations).
An account was considered as a default (censoring indicator=1) if it
was at least 90 days in arrears. When an account was not in arrears or
only in arrears for less than 90 days, the account was considered as a non-
default (censoring indicator=0). As for most credit data, the percentage of
defaults within the observation period was very low: default was only ob-
served for 376 of the 7521 observations. In Section 1.5.3 we reconsider this
dataset taking prepayments and maturity into account, hereby reducing
the number of censored cases.
For each observation, we considered eight candidate covariates, see Ta-
39. 1.5. Variable selection for a credit loan dataset 19
ble 1.4. In the model selection approach of Section 1.5.2, we searched
through all subsets of the collection of eight covariates, and this for both
model components, resulting in (28 − 1)2 = 65025 AICcd values, where
we have excluded empty latency and incidence models. Using the same
method of exhaustive search for the modeling approach in Section 1.5.3
would result in over 16 581 375 AICcd calculations ((28 − 1)3), because
this time three different covariate vectors are considered. Therefore, in-
stead of an exhaustive search, a genetic algorithm was used to find a good
model, for which we used the package GA in R (Scrucca, 2013). We used
this package with AICcd in the binary representation indicating the pres-
ence (1) or absence (0) of a specific variable, and with all default settings,
i.e., population size 50, crossover probability 0.8, mutation probability 0.1.
For the model selection purpose, this algorithm starts with randomly in-
cluding and excluding some variables. The algorithm consists of several
“generations”, and at the end of each generation, the AICcd-values of the
inspected models are evaluated, and the models with the lowest AICcd-
values are withheld in the next generations. Starting from those models,
small changes are made with the purpose to find models with even lower
AICcd-values.
1.5.2 Variable selection for the time to default
After calculating the AICcd values for each of the considered models, the
models were sorted according to their resulting AICcd values. Seven mod-
els will be discussed and compared: the five best models according to the
AICcd, the full model and (again according to AICcd) the best model un-
der the restriction that the latency and incidence model should contain the
same covariates; see Table 1.5.
We observe that for all the five best models, the same latency model
is selected whereas the incidence model covariates vary. For this dataset,
the incidence model seems to require more variables. Whereas variables
v2 (amount of the loan), v3 (number of years living at a current address)
and v8 (frequency of the payment) are never included in the latency part
40. 20
An Akaike information criterion for multiple event mixture
cure models
Model AICcd Rank Part v1 v2 v3 v4 v5 v6 v7 v8
Best 7372.85 1 Incidence 1 0 1 1 1 1 1 1
Latency 1 0 0 1 1 1 1 0
Second best 7373.06 2 Incidence 1 1 1 1 1 1 1 1
Latency 1 0 0 1 1 1 1 0
Third best 7385.11 3 Incidence 1 1 0 1 1 1 1 1
Latency 1 0 0 1 1 1 1 0
Fourth best 7385.28 4 Incidence 1 1 1 1 1 1 1 0
Latency 1 0 0 1 1 1 1 0
Fifth best 7385.79 5 Incidence 1 0 1 1 1 1 1 0
Latency 1 0 0 1 1 1 1 0
Full 7446.92 215 (Both) 1 1 1 1 1 1 1 1
Same covariate 7397.87 17 (Both) 1 0 0 1 1 1 1 0
Table 1.5: Credit loan data. Variables contained in the five best models
according to AICcd, the full model and the AICcd-best model with the same
parameters in both model parts. The value of AICcd, as well as its ranking
is given.
of the best five models, those three variables are also the ones left out in
the incidence model, but at the most with two at the same time. The full
model only ranks 215th with regard to AICcd value. The same covariate
model, for this dataset, uses the same covariates as for the latency part
of the best five models. Its rank is 17, with a difference in AICcd values
as compared to the best model equal to about 25, clearly showing the
preference for the separate covariate parts.
In the credit risk context, a widely used method to evaluate binary clas-
sifiers is by means of the receiver operating characteristics curves. These
curves give the percentage of correctly classified observations for each pos-
sible threshold value. The specific measure of interest is the area under the
curve (AUC), which can also be used in the context of survival analysis
(Heagerty and Saha, 2000). We computed the AUC values for five models
of interest, when predicting default at three different time instances (18,
41. 1.5. Variable selection for a credit loan dataset 21
Month Best Second best Third best Full Same covariate
18 0.710 0.709 0.695 0.707 0.703
24 0.700 0.700 0.683 0.700 0.688
36 0.688 0.685 0.664 0.684 0.671
Table 1.6: Credit loan data. AUC values for the top three models ac-
cording to AICcd, the full model and the AICcd-best model with the same
variables in both model parts, when predicting default at 18, 24 and 36
months respectively.
Part Int. v1 v2 v3 v4 v5 v6 v7 v8
Inc. (ˆb) -1.586 -0.311 – -0.036 -0.044 0.001 0.002 0.328 -0.380
(se) (0.210) (0.155) – (0.009) (0.014) (0.0002) (0.285) (0.129) (0.120)
Lat. (ˆβ) – 0.551 – – -0.066 0.0003 0.852 0.024 –
(se) – (0.177) – – (0.019) (0.0002) (0.304) (0.172) –
Table 1.7: Credit loan data. The parameter estimates for the time to
default with their standard errors (se) for the AICcd-best model for the
incidence (Inc.) and latency (Lat.) parts of the model. Variables not
selected were not estimated.
24 and 36 months). Each time, 2/3 of the data was used as a training set,
and 1/3 as a test set. The AUC-values can be found in Table 1.6.
In Table 1.7, the parameter estimates of the best model according to
AICcd can be found. Positive b-parameters have a positive impact on the
probability of being susceptible, and positive β-parameters shorten the
time until default. As a result, working at the same employer for a longer
time period decreases the risk to default, as well as having a home phone
and owning a house (binary variables decoded as 1 = no and 2 = yes).
The gender of a subject has an ambiguous effect on default: whereas being
male lowers the probability of being susceptible, we see that the time until
default when susceptible is shorter for men.
Figure 1.1 presents the estimated survival curves for two randomly
42. 22
An Akaike information criterion for multiple event mixture
cure models
0 5 10 15 20 25 30 35
0.850.900.951.00
Months
Survival
Figure 1.1: Credit loan data. Estimated survival curves for two observa-
tions using three models. In solid line type (black) we show the estimates
for the selected best model, the dashed lines (blue) use the same-covariate
best model, while the dotted lines (red) give the estimated survival curve
using the Cox proportional hazard model, ignoring the mixture.
chosen persons in the dataset (namely a male person, not possessing a home
phone and working at the same employer for a relatively short time, and a
female person, possessing a home phone and working at the same employer
for a relatively long time). We consider estimates obtained in the best
mixture cure model with different covariates for both model parts, in the
best such model with the same covariates, and in the best Cox proportional
hazard model with all variables except for the customer’s gender. This was
the model selected by the AIC using the partial likelihood and penalizing
for the number of parameters in the model.
For the female person, the estimated survival percentages were rel-
atively high, and all three approaches give reasonably close estimates.
43. 1.5. Variable selection for a credit loan dataset 23
However, for the male person with lower values for the estimated survival
probabilities, we observe a clear difference with the estimates from the
mixture model and with that of the Cox proportional hazard model. The
estimated proportion in the mixture was equal to 12.81 % for this subject,
clearly suggesting the need of the mixture model. For this data example,
the use of the same covariates leads to larger estimated probabilities for
survival.
1.5.3 Variable selection for the multiple event model
As stated before, the multiple event model does not only incorporate de-
fault, but also early repayment, resulting in two incidence models and two
latency models. For this dataset there are 3.6% observations (269 cases)
for which maturity has occurred (so, which are belonging to the “cured”
fraction), 5% (376 cases) were in default, and 39.8% (2992 cases) have
prepayments. The remaining 51.6% are truly censored observations.
The genetic algorithm used is part of the package GA in R by Scrucca
(2013), with default settings, as described in Section 1.5.1. Despite the fact
that genetic algorithms are quite successful and efficient, it is never certain
that the final outcome will yield the overall lowest AICcd value. However,
the genetic algorithm we used was also applied to the data example for
the mixture cure model in Section 1.5.2, resulting in precisely the same
selected model as with the exhaustive search. The resulting model for the
joint analysis of default and prepayment with parameter estimates can be
found in Table 1.8. The interpretation of the parameters in Table 1.8 is
similar to the mixture cure-interpretation. Again, we see that not having
a home phone increases the probability and shortens the time for default
(both positive ˆb- and ˆβ values). A longer working duration at the same
employer, however, decreases the probability of default but has no signif-
icant result on the time until default according to the model selected by
the genetic algorithm using AICcd. The number of parameters included in
the latency model of default has gone from five parameters in the mixture
cure model to four parameters in the multiple event incidence model. A
44. 24
An Akaike information criterion for multiple event mixture
cure models
Part Intercept v1 v2 v3 v4 v5 v6 v7 v8
ˆbd -0.837 -0.084 -0.00007 -0.038 -0.094 0.001 0.481 – -0.479
ˆβd – 0.118 – – – 0.0001 0.342 – 0.106
ˆbp 0.648 -0.174 -0.00001 -0.020 -0.014 -0.00001 0.083 – -0.084
ˆβp – 0.073 -0.00003 – – – -0.359 -0.081 0.163
Table 1.8: Credit loan data. The parameter estimates for the multiple
event incidence model as found by the genetic algorithm.
possible explanation is that since more information is gained by adding an
early repayment part, less predictors are needed for the time until default.
For the early repayment parameters, we notice that five variables are in-
cluded in the latency part. We see that male subjects tend to have a lower
chance to belong to the early repayment group (b < 0), but when belong-
ing to that group, they tend to prepay earlier than female subjects. Note
that the same variables are included for the two incidence models, where
only v7 is not in the incidence model. This is a result of the fact that the
respective probabilities are estimated in one multinomial logit model (as
we have now three groups: early repayment, default and maturity). The
sign of ˆbd and ˆbp gives the relation between default and early repayment
respectively, in relation to maturity. For example: the multinomial log-
odds for a certain subject to belong to the early repayment-group versus
the mature group are expected to increase by 0.083 units (ceteris paribus)
when the subject does not have a homephone, however, the log-odds to
belong to the default-group compared to the mature group are even more
elevated (increase by 0.481 units).
As a final illustration, the default and early repayment curves were
plotted in Figure 1.2 for the same two random observations as for the mix-
ture cure model. The male person incurs a higher risk regarding default,
and a lower propensity regarding early repayment.
45. 1.6. Discussion 25
0 5 10 15 20 25 30 35
0.40.50.60.70.80.91.0
Months
DefaultandEarlyRepayment
Figure 1.2: Credit loan data. Estimated probabilities for default and early
repayment for two observations. The green (steeper) lines represent early
repayment, and the flatter lines default. The solid line represents a female
person, possessing a home phone and working at the same employer for a
relatively long time, and the dashed lines a male person, not possessing a
home phone and working at the same employer for a relatively short time.
1.6 Discussion
The development of advanced survival models for credit risk data is in
current progress. With this chapter we contributed with the derivation
of a proper variable selection method. We have used the popular Akaike
information criterion as the basis of the selection procedure. By making
use of the output of the EM procedure for model fitting, we obtained
a relatively simple criterion and have implemented this procedure in R,
making use of existing packages for fitting mixture cure models.
46. 26
An Akaike information criterion for multiple event mixture
cure models
Our simulation study and the data analysis have illustrated that using
different covariate vectors may lead to better models regarding AUC value
and regarding to model ranking according to AICcd. Not restricting to
same-covariate models for mixture modeling is worthwhile, our variable
selection approach easily allows for such general modeling strategies. The
use of a genetic search algorithm in combination with the AICcd provides
a handy way of incorporating many variables.
47. Chapter 2
A hierarchical mixture cure model
with unobserved heterogeneity
using the EM-algorithm
Abstract
The specific nature of credit loan data requires the use of mixture
cure models within the class of survival analysis tools. The con-
structed models allow for competing risks such as early repayment
and default on one hand, and for incorporating maturity, expressed
as an insusceptible part of the population, on the other hand. This
chapter further extends such models by incorporating unobserved
heterogeneity within the risk groups. A hierarchical expectation-
maximization algorithm is derived to fit the models and standard
errors are obtained. Simulations and a data analysis illustrate the
applicability and benefits of these models, and in particular an im-
proved event time estimation.
This chapter is based on Dirick, L., Claeskens, G., Vasvnev, A. and
Baesens, B. (2015). A hierarchical mixture cure model with unob-
served heterogeneity using the EM-algorithm. Working paper, sub-
mitted.
27
48. 28
A hierarchical mixture cure model with unobserved
heterogeneity using the EM-algorithm
2.1 Introduction
The analysis of credit risks via survival analysis takes advantage of the
nature of time-to-event data, in particular by its ability to naturally cap-
ture the specifics of default, prepayment and maturity events. While first
those events were examined and modeled individually, see for example Ba-
nasik et al. (1999), Stepanova and Thomas (2002a), Andreeva (2006) and
Bellotti and Crook (2009), these models were soon extended by allowing
for a cured fraction while modeling early repayment or default, known as
mixture cure models, see Tong et al. (2012) and Dirick et al. (2015). The si-
multaneous analysis of all different events is evident in Deng et al. (2000),
Pavlov (2001), Ciochetti et al. (2002), Dirick et al. (2015) and Watkins
et al. (2014).
In this chapter we extend such multiple event models for credit risk
data by acknowledging the fact that there are different kinds of customers.
For example, some people are risk-averse, others might be risk-neutral or
even risk-seeking. While this characteristic is not observed, our approach
makes it possible to incorporate unobserved heterogeneity in the models.
More specifically, we construct an expectation-maximization (EM) algo-
rithm that simultaneously deals with the mixture cure model with multi-
ple events and with a number of subgroups for each of the modeled events.
We explain the implementation of such a hierarchical EM algorithm for
the credit risk models.
This chapter gives the first simulation study of the mixture cure models
with unobserved heterogeneity. An application of the model for personal
loan data from a UK bank reiterates the importance of the unobserved
heterogeneity for credit risks. In the simultaneous modeling of compet-
ing events, similar to Watkins et al. (2014) we find that the explanatory
variables can act in different directions upon incidence and duration; and,
variables exist that are statistically significant in explaining only incidence
or duration.
In another context, Deng et al. (2000) showed that there exists signifi-
cant heterogeneity among mortgage borrowers which generated discussion
49. 2.1. Introduction 29
in this area, though not many researchers followed their lead. Recently
Burda et al. (2015) employed an approach to build a semiparametric com-
peting risk model with unobserved heterogeneity for the analysis of un-
employment in the US. Their Bayesian method does not involve the EM-
algorithm, and introduces unobserved heterogeneity through an infinite
mixture of generalized inverse Gaussian densities.
Despite the fact that in this chapter the focus is on competing risks for
loan data, the model is not restricted to these types of data and is applica-
ble in a large range of situations where competing risks (and a possibility
of not undergoing the risk or an “insusceptible” part of the population)
and a certain amount of censoring are present. In the biomedical context,
many disease-related research uses these models when there are several
possible death causes (for example Lunn and McNeil, 1995), when there is
a cured fraction of the patients (see, e.g., Bremhorst and Lambert, 2014)
or the combination of both (e.g. Ng et al., 2002). In the economic con-
text, an interesting example is given in Berrington and Diamond (2000),
where first-partnership formation (competing risks are cohabitation and
marriage) of males and females born in 1958 in Britain is studied. An
insusceptible population part can then be defined as the subjects that will
never marry or cohabitate, however, censoring is present through the sub-
jects that have not yet entered the first-partnership at the moment of the
study, but will afterwards. Burda et al. (2015) use another application
where the time to moment of exit from unemployment is modeled (to the
same versus another industry where they had been employed previously).
The chapter is organized as follows. Section 2.2 gives the hierarchical
mixture cure model with unobserved heterogeneity. Section 2.3 details the
EM-algorithm. The simulation study is summarized in Section 2.4 and
the empirical application is in Section 2.5. Concluding comments are in
Section 2.6 followed by the theoretical derivations in the appendix.
50. 30
A hierarchical mixture cure model with unobserved
heterogeneity using the EM-algorithm
2.2 The hierarchical mixture cure model
We observe life times Ti and a set of covariates. The life times Ti rep-
resent the time until an event j ∈ {1, . . . , J} takes place, or until the
observation is censored. In the latter case, the general censoring indicator
δi for observation i is equal to 0, indicating that none of the competing
events was observed. Additionally, each observation has J event-specific
censoring indicators, denoted by δj,i. As it is assumed that events are
mutually exclusive, the rationale is that the occurrence of a certain event
causes the observation to be censored from any other event type. Note
that δi = J
y=1 δy,i. For censored observations (δj,i = 0 for every j and,
consequently, δi = 0), it is unknown which of the event types will be ex-
perienced eventually, or in other words, the event “group” that a censored
observation belongs to is unknown. This group membership is represented
by a partially observed variable Y ∈ {1, . . . , J}, with Y being observed
only when δi = 1.
Denote by πj(z, b) = P(Y = j; z, b) the probability of belonging to
a certain group j, with j ∈ {1, . . . , J}, given the covariate vector z and
the vector of coefficients b. For this discrete distribution it holds that (for
a fixed z) 0 ≤ πj(z, b) ≤ 1 and that J
j=1 πj(z, b) = 1. The estimation
of πj(z, b) is done through a multinomial logistic regression model with
a covariate vector z and corresponding parameter vector b. For j = J it
holds that πJ (z, b) = 1 − J−1
y=1 P(Y = y; z, b) with for j ∈ {1, . . . , J − 1},
πj(z, b) = P(Y = j; z, b) =
exp(zT bj)
1 + J−1
y=1 exp(zT by)
. (2.1)
The probability of not having experienced any event by time t is then given
by
S(t; x, z, b, β) =
J−1
y=1
πy(z, b)S(t | Y = y; x, βy) + πJ (z, b), (2.2)
where S(t | Y = j; x, βj) is the probability of not having experienced the
event j by time t. The proof of the identifiability of (2.2) is in Appendix
51. 2.2. The hierarchical mixture cure model 31
2.7.1. The survival probabilities S(t | Y = j; x, βj) use a covariate vector
x, which may be different from, overlapping with, or be identical to the
covariate vector z.
In group J the subjects are insusceptible to any of the considered
events, or in other words “cured”, which is originating from medical studies
considering cured patients, see e.g. Kuk and Chen (1992), Sy and Taylor
(2000b), Peng and Dear (2000). In the model, the cured or insusceptible
group has a survival probability S(t | Y = J) = 1 for every t and does not
depend on x or on any parameters.
To incorporate heterogeneity, in a hierarchical model we assume that
all J − 1 main groups, thus except for the “insusceptible” Jth group, may
be further divided into Kj subgroups, of which observations experience
the same event and have a similar covariate structure but differ with re-
gard to their event time structure. So instead of immediately modeling
survival function S(t | Y = j, x; βj) which depends on main group mem-
bership only, the survival structure depends on the subgroups as well. The
probability of not having experienced event j at time t when belonging
to subgroup k is modeled by a semi-parametric Cox proportional hazards
model and given by
ST|Yj,Y
(t | Yj = k, Y = j; x, βjk)
= exp − exp(xT
βjk)
t
0
h0(u | Yj = k, Y = j)du , (2.3)
with h0 the unspecified baseline hazard function, estimated using Bres-
low’s estimator. The latent variable Yj which takes values in {1, . . . , Kj}
represents the subgroup membership for group j ∈ {1, . . . , J − 1} and βjk
is the parameter vector related to the survival function of subgroup k in
main group j. For further use we define the probability of belonging to
subgroup k as τk|j = P(Yj = k | Y = j).
52. 32
A hierarchical mixture cure model with unobserved
heterogeneity using the EM-algorithm
2.3 The joint likelihood and EM-algorithm for
the hierarchical model
The likelihood contribution of an observation i = 1, . . . , n is given by
fT,δ,Y ,Y
(ti, δi, ˜y, y; b, βY, ˜Y )
= fT,δ|Y ,Y
(ti, δi | Yi = ˜y, Yi = y; xi, βy˜y) · τYi|Yi
· πYi (zi, b),
where, for a given j and k, the likelihood contribution is, recall δi =
J
y=1 δy,i:
fT,δ|Yj,Y
(ti, δi | Yj = k, Y = j; xi, βjk)
= hT|Yj,Y
(ti | Yj = k, Y = j; xi, βjk)δj,i
×ST|Yj,Y
(ti | Yj = k, Y = j; xi, βjk), (2.4)
with h being the hazard function, formally,
hT|Yj,Y
(ti | Yj = k, Y = j; xi, βjk) = h0(t | Yj = k, Y = j) exp(xT
βjk).
The joint hierarchical log likelihood of (Ti, Yi, ˜Yi) now takes the form
Lh
n(b, βY,Y
; Y1, . . . , Yn, Y1, . . . , Yn, T1, . . . , Tn, δ1, . . . , δn) (2.5)
= log
n
i=1
fT,δ,Y ,Y
(ti, δi, ˜y, y; b, βy˜y)
= log
n
i=1
fT,δ|Y ,Y
(Ti, δi | Yi, Yi; xi, βY,Y
) · τYi|Yi
· πYi (zi, b) .
2.3.1 The expected complete-data log likelihood
Since the main group indicators Yi as well as the subgroup indicators Yi
are not fully observed, the EM-algorithm (Dempster et al., 1977) is used
in order to maximize the log likelihood. In this iterative procedure, the
parameter estimates of the r-th EM-iteration are used along with the ob-
served information to compute the expected complete-data log likelihood
of the (r + 1)-th EM-iteration, formally,
53. 2.3. The joint likelihood and EM-algorithm for the hierarchical
model 33
Qh
(b, βY,Y
)(r+1)
| (b, βY,Y
)(r)
=
n
i=1
E[log fT,δ,Y ,Y
(Ti, δi, Yi, Yi; b, (βY,Y
)(r+1)
) | Ti; (βYi,Yi
)(r)
]
=
n
i=1
E[log πYi (zi, b(r+1)
) | Ti; b(r)
] + E[log τ
(r+1)
Yi|Yi
| Ti; β
(r)
Yi,Yi
]
+E[log fT|Y, ˜Y (Ti, δi | Yi, Yi; xi, β
(r+1)
Y,Y
) | Ti; β
(r)
Yi,Yi
] . (2.6)
Note that this is the expected value of the likelihood conditional on Ti,
with parameter estimates of iteration r. Rewriting the first term gives
E[log πYi (zi, b(r+1)
) | Ti; b(r)
] =
J
y=1
P(Yi = y | Ti = ti, xi) log πy(zi, b(r+1)
),
with P(Yi = j | Ti = ti; xi) the probability of belonging to group j, con-
ditional on the censoring or event time. This probability is for uncensored
cases either 1 or 0. It is a weighted average of the time densities in the
censored case,
P(Yi = j | Ti = ti, xi)
=
πj(zi, b(r)
)fT|Y =j(ti | Y = j; xi, β
(r)
j )
J
y=1 πy(zi, b(r)
)fT|Y =y(ti | Y = y; xi, β
(r)
y )
if δi = 0
1 if δi = 1 and Yi = j
0 if δi = 1 and Yi = j
≡ wj(β(r)
; ti, xi).
As the density fT|Y =j(ti | Y = j; xi, β
(r)
j ) itself is composed of the sub-
group time densities with their respective subgroup probabilities, τj|k,
wj(β(r)
; ti, xi)
=
πj(zi, b(r)
)
Kj
˜y=1 τ˜y|jfT |Yj ,Y (ti | Yj = ˜y, Y = j; xi, β
(r)
j˜y )
J
y=1 πy(zi, b(r)
)
Ky
˜y=1 τ˜y|yfT |Yy,Y (ti | Yy = ˜y, Y = y; xi, β
(r)
y˜y )
if δi =0
1 if δi = 1 and Yi = j
0 if δi = 1 and Yi = j,
and using (2.4) along with the fact that δj,i = 0 when δi = 0,
54. 34
A hierarchical mixture cure model with unobserved
heterogeneity using the EM-algorithm
wj(β(r)
; ti, xi)
=
πj(zi, b(r)
)
Kj
˜y=1 τ˜y|jST |Yj ,Y (ti | Yj = ˜y, Y = j; xi, β
(r)
j˜y )
J
y=1 πy(zi, b(r)
)
Ky
˜y=1 τ˜y|yST |Yy,Y (ti | Yy = ˜y, Y = y; xi, β
(r)
y˜y )
if δi =0
1 if δi = 1 and Yi = j
0 if δi = 1 and Yi = j.
(2.7)
For the second term in (2.6) we get that
E[log τ
(r+1)
Yi|Yi
| Ti; β
(r)
Yi,Yi
] =
J
y=1
Ky
˜y=1
P(Yj,i = ˜y, Yi = y | Ti = ti, xi) log τ
(r+1)
˜y|y
=
J
y=1
Ky
˜y=1
P(Yj,i = ˜y | Yi = y; Ti = ti, xi)P(Yi = y | Ti = ti, xi) log τ
(r+1)
˜y|y ,
with P(Yj,i = k | Yi = j; Ti = ti, xi) the probability of belonging to sub-
group k, given the event type j and the censoring or event time. Similarly
to (2.7), we get
P(Yj,i = k | Yi = j, Ti = ti; xi)
=
τ
(r)
k|j fT|Y =j, ˜Yj=k(ti | Y = j, Yj = k; xi, β
(r)
jk )
Kj
˜y=1 τ
(r)
˜y|j fT|Y =j, ˜Yj=˜y(ti | Y = j, Yj = ˜y; xi, β
(r)
j˜y )
≡ vk|j(β
(r)
j ; ti, xi),
for j ∈ {1, . . . , J − 1} and k ∈ {1, . . . , Kj}. By consequence,
E[log τ
(r+1)
Yi|Yi
| Ti; β
(r)
Yi,Yi
] =
J−1
y=1
Kj
˜y=1
v˜y|y(β(r)
y ; ti, xi)wy(β(r)
; ti, xi) log τ
(r+1)
˜y|y .
As opposed to the main groups where δj,i gives partial information on
membership, no prior information is available for subgroup membership
thus τ does not depend on a covariate vector. In the first iteration of the
EM-algorithm, a value for τk|j is chosen for each k such that K
k=1 τk|j = 1
for each j. Without prior information, a logical starting value for τk|j is
1/Kj with Kj the total number of subgroups in main group j. In the next
55. 2.3. The joint likelihood and EM-algorithm for the hierarchical
model 35
steps of the EM-algorithm, τk|j is updated as follows (see Appendix 2.7.2
for details),
τ
(r+1)
k|j = τ
(r+1)
k|j (x1,. . ., xn) = P(Yj =k | Y =j) =
n
i=1v
(r)
k|ji
(β
(r)
j , ti, xi)
n
.(2.8)
Similarly, the third term of (2.6) is given by
E[log fTi|Yi, ˜Yi
(Ti | Yi, Yi; xi, β
(r+1)
Y,Y
) | Ti; β
(r)
Y,Y
]
=
J
y=1
Ky
˜y=1
v˜y|y(β(r)
y ; ti, xi)wy(β(r)
; ti, xi)
× log fTi,yi,˜yi (Ti | Yi = y, Yi = ˜y; xi, β
(r+1)
y˜y )
=
J−1
y=1
Ky
˜y=1
v˜y|y(β(r)
y , ti, xi)wy(β(r)
; ti, xi)
× log fTi,yi,˜yi (Ti | Yi = y, Yi = ˜y; xi, β
(r+1)
y˜y ).
The resulting hierarchical complete-data log likelihood is then given by
Qh
(b, βY,Y
)(r+1)
| (b, βY,Y
)(r)
(2.9)
=
n
i=1
wJ (β(r)
; ti, xi) log πJ (zi, b(r+1)
)
+
J−1
y=1
wy(β(r)
; ti, xi) log πy(zi, b(r+1)
)
+
Ky
˜y=1
wy(β(r)
; ti, xi)v˜y|y(β(r)
y ; ti, xi) log τ
(r+1)
˜y|y
+ log fTi,yi,˜yi (Ti | Yi = y, Yi = ˜y; xi, β
(r+1)
y˜y ) ,
2.3.2 Initialization and iterative E- and M-step
The three main steps of the computational algorithm are performed as
follows:
a) Initialization stage
56. 36
A hierarchical mixture cure model with unobserved
heterogeneity using the EM-algorithm
1) Determine the number of subgroups Kj for each of the J-1 main
groups. Whereas the number of main groups J is fixed by the data
structure, the number of subgroups is not. It is suggested to try
several values for Kj, and evaluate the results (see also Section 2.5.2).
2) Initialization of w: Set w
(0)
j (β(0)
; ti, xi) = δj,i for every j. Hence,
the initial value is 1 for an observed event of category j and is 0
otherwise.
3) Initialization of b: Fit a multinomial logit model to w(0) using co-
variate vector z, in order to retrieve an initial estimate ˆb
(0)
.
4) Initialization of β: Obtain estimates ˆβ
(0)
j,k at each subgroup level.
The parameter estimates of the multiple event mixture cure model
(Dirick et al., 2015) without heterogeneity can be used to set the
initial values for the J−1
y=1 Ky parameter vectors. Remark: The Kj
initial values for every j ∈ {1, . . . , J − 1} should be different for the
algorithm to work more efficiently.
5) Initialization of τ: τ
(0)
k|j = 1/Kj if no information about subgroups.
6) Initialization of densities: Compute density fT|Y =j, ˜Yj=k(ti | Y =
j, Yj = k; xi, βj,k), baseline hazard h0(u | Yj = k, Y = j) through
Breslow’s estimator and the survival function ST|Yj,Y
(ti | Yj = k, Y =
j; xi, βj,k) values (using (2.3)) for each observation, using the initial
ˆβ
(0)
j,k-estimates.
b) E-step
1) Compute π
(1)
j (zi, b) for each j, using ˆb
(0)
.
2) Compute w
(1)
j (β; ti, xi) for each j, using ˆβ
(0)
.
3) Compute v
(1)
k|j (βj; ti, xi) for each k and each j, using ˆβ
(0)
j .
c) M-step
1) Update b: Obtain a new estimate ˆb
(1)
using the w
(1)
j (β; ti, xi)’s of
the E-step.
57. 2.3. The joint likelihood and EM-algorithm for the hierarchical
model 37
2) Update βjk: Obtain a new estimate ˆβ
(1)
j,k using mixture weights
w
(1)
j (β; ti, xi) and v
(1)
k|j (βj; ti, xi). Method: The likelihood contribu-
tion corresponding to the event times can be written as
J−1
j=1
Kj
k=1
n
i=1
wj(β; ti, xi)vk;j(βj; ti, xi)
× log hT,j,k(ti; xi, βjk)δj,i
ST,j,k(ti; xi, βjk)
=
J−1
j=1
Kj
k=1
n
i=1
wj(β; ti, xi)vk;j(βj, ti, xi)δj,i log hT,j,k(ti; xi, βjk)
+wj(β; ti, xi)vk;j(βj; ti, xi) log ST,j,k(ti; xi, βjk)
=
J−1
j=1
Kj
k=1
n
i=1
vk;j(βj; ti, xi) δj,i log wj(β; ti, xi)hT,j,k(ti; xi, βjk)
+wj(β; ti, xi) log ST,j,k(ti; xi, βjk) .
For the last step, we used log wj(β; ti, xi)δj,i = 0 and δj,iwj(β; ti, xi) =
δj,i. we can use log(wj(β; ti, xi)) as an offset variable.
This way of writing illustrates that β can be estimated using stan-
dard software for fitting Cox proportional hazards models, such as the
coxph-function in R, with an additional offset variable log(wj(β; ti, xi))
and weights equal to vk|j(βj; ti, xi). A similar reasoning has been
used by Cai et al. (2012a).
3) Update densities: Obtain a new estimate of fT|Y=j, ˜Yj=k(ti |Y =j, Yj =
k; xi, βjk), h0(u | Yj = k, Y = j) and ST|Yj,Y
(ti | Yj = k, Y =
j; xi, βjk), using ˆβ
(1)
j,k.
Repeat the E- and M-step with all updated estimates, until parameter
convergence. The algorithm stops when the sum of the absolute value of
the relative differences between ˆβ
(r+1)
,ˆb
(r+1)
and ˆβ
(r)
,ˆb
(r)
is smaller
than 10−6.
Note that a computational issue can arise for some observations, as
fT|Y =j, ˜Yj=k(ti | Y = j, Yj = k; xi, βjk) for all subgroups k ∈ {1, . . . , Kj}
58. 38
A hierarchical mixture cure model with unobserved
heterogeneity using the EM-algorithm
in one of the main groups j ∈ {1, . . . , (J − 1)} can be very small or
even 0. As a result, vk|j(βj; ti, xi) can go to infinity for all Kj sub-
groups of group j. As
Kj
k vk|j should be equal to 1, this issue is solved
by putting vk|j(βj; ti, xi) = 1/Kj for every k when the denominator of
vk|j(βj; ti, xi) < 10−10 for a certain observation i. Intuitively, when a cer-
tain observation is seemingly found to not belong to any of the subgroups
of a main group j, its subgroup probabilities should be equal.
2.3.3 Standard errors through the SEM-algorithm
The typical execution of the EM-algorithm does not automatically produce
standard errors of the parameter estimates, for an overview, see Jamshidian
and Jennrich (2000). This method, introduced by Meng and Rubin (1991),
is widely used in various applications for standard error estimation when
applying the EM-algorithm, see for example Segal et al. (1994) and Cai
and Lee (2009). Meng and Rubin (1991) show that a numerically stable
asymptotic variance-covariance matrix can be obtained using the supple-
mented EM-algorithm, more specifically, V = I−1
oc (Id −DM)−1, where Ioc
is the negative second hessian matrix of the expected complete-data log
likelihood, with Θ = (b, βY,Y
), define
Ioc = −
∂2Qh Θ | Θ
∂Θ · ∂ΘT
.
The matrix Id is the identity matrix with dimension d × d, with d equal to
the length of the parameter vector Θ. The d × d-matrix DM can be inter-
preted as the matrix rate of convergence of the EM-algorithm. The idea be-
hind this is that, implicitly, a mapping Θ → M(Θ) = (M1(Θ), . . . , Md(Θ))T
is defined by the EM-algorithm from the parameter space to itself such
that for r = 0, 1, . . ., M( ˆΘ
(r)
) = ˆΘ
(r+1)
. A Taylor series expansion in the
neighborhood of ˆΘ yields that
(Θ
(r+1)
− Θ) ≈ (Θ
(r)
− Θ) DM, where DM =
∂Ml(Θ)
∂Θm Θ=Θ
,
a d × d-matrix evaluated at Θ = Θ. In practice, DM is obtained by
numerically differentiating M(Θ). For more information on the computa-
59. 2.4. Simulation study 39
tion of DM, we refer to Meng and Rubin (1991, Section 3.3). We have
implemented this procedure to obtain standard errors of the estimators.
2.4 Simulation study
2.4.1 Simulation settings
To validate the model, a simulation study was conducted. In each simu-
lation run, a dataset of size n = 7500 was constructed with three event
groups A, B and C, and two subgroups for groups A and B (C is the
“cured” group). There are three variables, generated respectively by x1 ∼
N(−2, 1), x2 ∼ N(2.6, 1.2) and x3 ∼ N(3, 2). These variables in com-
bination with b-parameters shape the event group memberships of the
observations when using a multinomial logit transformation. As a result,
we get the probability of belonging to group j ∈ {A, B}:
πi,j(zi, b) = P(Y = j; b) =
exp(zT
i bj)
1 + exp(zT
i bA) + exp(zT
i bB)
,
in this simulation study we took z = x. The general model formulation
(Section 2.2) allows for z and x to be different. The value πi,C = 1−πi,A −
πi,B.
In total three settings were explored which differ solely with regard to
the values of b (which can be found in Table 2.1), resulting in different
group sizes. In Setting I, there is a low number of “cured” (group C) cases
of around 12%. Setting II contained around 35% cured cases, and Setting
III around 67%. For all settings, the remainder of cases was approximately
evenly split over groups A and B.
The event times differ for the two subgroups of A and B. Because
of this, there are different parameter vectors for the survival functions
of the subgroups. See Table 2.1 for the generating parameters β. To
model the subgroups, for each main group the observations are randomly
split into two groups of equal size, with event times generated using a
Weibull distribution each with a covariate vector βAk and corresponding
scale parameter λ and shape parameter 1/ν, see Table 2.1. The event
60. 40
A hierarchical mixture cure model with unobserved
heterogeneity using the EM-algorithm
Setting I Setting II Setting III
βA1 βA2 βB1 βB2 bA bB bA bB bA bB
(intercept) - - - - 0.7 0.2 -0.6 0.3 -0.7 -1.1
λj 0.7 0.9 0.5 0.8 - - - - - -
νj 0.6 1 0.7 1.1 - - - - - -
xj,1 -0.2 0 0.3 1.3 0.7 -0.4 0.8 -1.2 0.5 -1.5
xj,2 0.1 0.4 -0.5 -0.1 0.6 1.2 -0.1 -0.3 -1.2 -0.4
xj,3 -0.5 -0.3 0.1 0.3 0.2 -1 0.6 -1 0.7 -1.3
Table 2.1: Generating values for the parameter vectors β and b in the
simulation study.
times for observations in the insusceptible group C are all the same, for
these simulations we put these equal to 103. Finally, some censoring was
introduced. For both simulation settings, the censoring distribution was
Censor ∼ Unif(0, 200), leading to 15 − 20% censoring in the main groups
A and B.
2.4.2 Simulation results
According to the simulation settings in Section 2.4.1, 1000 simulation runs
were conducted. Three types of models are fitted and compared, (i) a
homogeneous model with three main groups and no subgroups, Kj=1, (ii)
a model with heterogeneity assuming two subgroups for both groups A and
B, which corresponds to the data generation, and (iii) a model with too
much heterogeneity as compared to how the data were generated, we use
three subgroups for both main groups A and B.
Model without heterogeneity
We evaluate the estimation of the parameters in a misspecified model,
assuming that there is no heterogeneity. Table 2.2 shows the mean of
the parameter estimates over all simulation runs along with their standard
61. 2.4. Simulation study 41
deviations. We observe that the parameters of the incidence model are well-
estimated. The main interest, however, lies in the estimates ˆβ, since the
model without heterogeneity forces to estimate only one β per main group,
whereas the data are generated with two parameters β for both A and B.
It is observed that abandoning the heterogeneity might lead to undetected
effects. An example for this is βB,1: the model estimates are between
0.542 and 0.644 when using no subgroups, whereas the two generating
values βB1,1 = 0.3 and βB2,1 = 1.3. It seems that the model favors weaker
relationships, which results in estimated βs that are relatively small in
absolute value.
ˆβA
ˆβB
ˆbA
ˆbB
SettingI
int. 0.862 (0.166) 0.386 (0.192)
xj,1 -0.083 (0.023) 0.542 (0.03) 0.643 (0.089) -0.432 (0.101)
xj,2 0.13 (0.024) -0.275 (0.022) 0.412 (0.07) 0.975 (0.087)
xj,3 -0.271 (0.018) 0.153 (0.017) 0.187 (0.082) -0.977 (0.085)
SettingII
int. -0.479 (0.125) 0.382 (0.15)
xj,1 -0.076 (0.03) 0.621 (0.039) 0.757 (0.05) -1.16 (0.075)
xj,2 0.134 (0.023) -0.262 (0.026) -0.125 (0.031) -0.353 (0.038)
xj,3 -0.257 (0.019) 0.163 (0.02) 0.549 (0.042) -0.969 (0.046)
SettingIII
int. -0.591 (0.148) -0.954 (0.182)
xj,1 -0.061 (0.042) 0.644 (0.053) 0.456 (0.049) -1.426 (0.087)
xj,2 0.155 (0.038) -0.257 (0.035) -1.184 (0.05) -0.454 (0.045)
xj,3 -0.238 (0.029) 0.168 (0.028) 0.628 (0.039) -1.25 (0.053)
Table 2.2: Mean and standard errors of the parameter estimates for the
model without heterogeneity over 1000 simulation runs, for Setting I (with
cure rate around 12%), Setting II (35% cure rate) and Setting III (67%
cure rate).
Model with heterogeneity: two subgroups
The mean parameter estimates for all settings over 1000 simulation runs
for a model with heterogeneity can be found in Table 2.3. The param-
62. 42
A hierarchical mixture cure model with unobserved
heterogeneity using the EM-algorithm
eter estimates for b in the right panel are close to the estimates for the
model without heterogeneity, resulting in good estimates with respect to
the simulated parameters and similar standard errors for all settings. The
estimates ˆβ in the left panel show that the two subgroups are well-identified
for groups A and B. When comparing the estimates ˆβ with the true pa-
rameter values used for simulation (see Table 2.1), we note that in general
a higher cure rate does not disturb the estimation of β. However, it should
be noted that standard errors are larger for subgroup A1 when comparing
with other subgroups. Additionally, standard errors tend to go up when
the cured fraction is larger. This first phenomenon can be explained by
the fact that the parameters of both subgroups in A lie closer to each
other as compared to the subgroup parameters of B. This possibly makes
estimation more difficult. The second phenomenon is explained by the
smaller number of cases in groups A and B for Setting III in comparison
with Setting I. Because approximately 2/3 of the observations is cured in
Setting III, only around 600 observations are member of each subgroup in
this setting. This leads to less accuracy and higher variation in parameter
estimation.
In Table 2.4, the percentage of correctly classified observations for the
model with two subgroups are listed on the diagonal of the middle part.
When comparing these results with the percentages of correctly classified
observations of the model without heterogeneity (on the left part of the
same table), we observe a high percentage of correctly classified observa-
tions for all settings. Note that classification is better for groups A and B
in the model with two subgroups, this is offset by a worse classification of
the cured cases C, especially in Setting I. In general, we note that classifi-
cation on the main group level does not incontestably favor one model over
another. This is not an unexpected result, as classification is driven by the
parameters b, which only marginally change when changing the number of
subgroups (see the b-parameters in Tables 2.2 and 2.3). A simular result
was observed when looking at the b-parameters of a model when having
three subgroups (see also Section 2.4.2).
The main advantage of the use of a heterogeneous model when there
64. 44
A hierarchical mixture cure model with unobserved
heterogeneity using the EM-algorithm
Classified as (in %)
no heterogeneity two subgroups three subgroups
A B C A B C A B C
SettingI
Realgroup
group A 94.74 0.56 4.70 95.55 0.65 3.79 95.63 0.66 3.71
group B 0.66 94.70 4.64 0.80 95.80 3.40 0.82 95.82 3.36
group C 12.89 9.50 77.62 17.95 13.95 68.09 18.60 14.06 67.34
SettingII
Realgroup
group A 92.64 0.15 7.21 93.58 0.15 6.26 93.66 0.16 6.18
group B 0.16 91.03 8.80 0.21 91.66 8.14 0.21 91.74 8.04
group C 4.87 5.61 89.52 7.43 6.85 85.72 7.72 7.03 85.25
SettingIII
Realgroup
group A 89.08 0.05 10.87 90.07 0.06 9.87 95.63 0.66 3.71
group B 0.05 88.65 11.30 0.06 89.45 10.48 0.82 95.82 3.36
group C 1.36 2.21 96.43 2.38 2.78 94.84 18.60 14.06 67.34
Table 2.4: Percentage of observations classified to each of the groups
over 1000 simulation runs. The left part shows this for the model without
heterogeneity, the middle part for the correct model with two subgroups for
A and B, and the right part gives the classification percentages for the
overspecified model with three subgroups for A and B. The percentages of
correct classification are on the diagonals of each part.
is some heterogeneity in the data lies in the possibility to model more
accurate event times. To illustrate this, we investigate the estimates of
the survival probabilities of the subjects using (i) a model without hetero-
geneity and (ii) with two subgroups per main group, and compare these
estimates to the true survival probabilities of the simulated data. For the
1000 simulation runs, we considered the true survival rate in each sub-
group (A1, A2, B1, B2), for each decile from 0.2 to 0.7 when sorting all
7500 event times. These are compared to the average estimated survival
probability of all observations in groups A1, A2, B1 and B2, first using a
homogeneous model, and secondly using a model with two subgroups. The
result can be found in Table 2.5.
For each simulation setting at each of the six listed time deciles, the