SGS305 Final Research Paper Democracy Research Methods Professor Charles Ripley
Thesis (Final Draft)
1. Governmental Transition and Ethno-Political Marginalization: Changing
Democracies and Ethnic Tension
Lora G. Adams
Hendrix College
Abstract:
When a country experiences major shifts in the style governance (whether towards or away from
democracy), ethnic cleavages gain new significance in the emerging political atmosphere. In this
adjustment, the government’s decisions about which groups have political voice can act as
catalysts to pre-existing ethnic tensions. Rapid gains in democracy can politicize previously non-
political ethnic identities, and rapid loss of democracy can marginalize or even exclude certain
ethnic groups. Both of these outcomes could increase the salience of ethnic cleavages, which in
turn increases the risk of ethnically motivated conflict. In this paper, I investigate whether major
changes in levels of democracy lead to polarization or marginalization of ethnic groups through
statistical analysis and case studies. Though my thesis states that rapid democratization will lead
to an increase in politically relevant groups and that rapid loss of democracy will lead to an
increase in politically discriminated/powerless ethnic groups, the statistical results point to the
larger role of economics and development in ethno-political representation.
2. 2
INTRODUCTION
The relationship between a government and its citizens can be seen as a dialogue, a
shifting but continuous effort to define what it is to be a nation and who is included in it. Such a
definition often includes ethnic/religious identities, which serve as overarching definitions of
societal membership. Societies define their membership through various avenues, a major one
being participation in governance. Participating in the political process is a dialogue of its own,
one between the state and the people. Groups, however, are often excluded from governance by
the government itself. Those in power have the ability to impede certain groups from
participating in one of the main activities that defines them as members of a society, leaving
portions of the population excluded from politics and setting a precedent for their exclusion in
other arenas. It is in this atmosphere that ethnic tensions are prone to rise and the chance of
conflict prone to rise with them. Though there are multiple circumstances that can prompt a
government to exclude certain populations from political decision-making processes, this paper
concentrates on the pressures on the government to maintain control after a change in
governance, mainly through the loss or gain of democracy.
LITERATURE REVIEW AND THEORETICAL FRAMEWORK
The relationship between this dialogue of nationalism and ethnicity has been heavily
researched, though mostly from the perspective of nation-building. In his extensive writings on
nationalism and nation-building, Haas defines nationalism as a type of “rationalization” for the
configuration of a group into a nation as the world modernizes, which can help or hinder
3. 3
domestic harmony. His main argument states that the pressures of modernization and combating
cleavages (of ethnicity, language, class, or religion) cause a previously accepted national myth to
fail, causing previously “assimilated” people to no longer be assimilated (1986). I argue that this
is manifested in the political sphere, that whatever latent ethnic tensions there were before the
transition are heightened by the transition itself, leaving certain ethnic groups not already in
power vulnerable to political marginalization or even complete exclusion.
Not all governmental discrimination is gradual. Major political and economic transitions
can act as “watershed events that dramatically alter society,” especially concerning in-group and
out-group identity (Deitelbaum and Kunovich 2004). These “watershed events” activate pre-
existing ethnic cleavages. One result of this aggravation may be increased ethnic nationalism, a
call for a sovereign political unit for a specific ethnic or racial group. The implication of there
being only one correct ethnic group per nation necessitates the exclusion of and delineation from
“outsider” ethnic groups (Deitelbaum and Kunovich 2004). I argue that a change in the level of
democracy can constitute a “watershed” event that results in increased exclusion of outsider
groups, shown through increased levels of ethno-political marginalization.
Another causal mechanism for the increase in ethnic salience during times of major
transition is the actions of the state itself. While ethnic nationalism can prompt the development
of a state, eventually the state becomes external from its ethnic identities. This separation gives
the state the capacity to manipulate ethnic relations. Shu-yun refers to this as “the alienation of
the state” (1999), and it is this phenomenon that allows the government to pick and choose
participants in political decision-making processes separate from itself.
To manipulate ethnic cleavages and combat any loss of power, states can use different
strategies to maintain control. The state can maintain a dominant group (which its leaders may be
4. 4
a part of), holding the society together by giving this group the power to dominate all others
(again, highlighting the differences between the dominant and non-dominant groups, increasing
ethnic salience). The state can also take a clientelist approach, buying ethnic loyalty through
favors. This approach has the incentive to keep ethnic groups divided, because competition for
state favoritism between groups keeps the government in control. The state can also take on an
absolutist policy, emphasizing a non-ethnic national loyalty and suppressing competing loyalties
(to ethnic groups or religion, for example) (Shu-yun 1999).
These strategies are often used to maintain control during times of stability, but I argue
that governments increase their reliance on their current manipulative strategies and may even
employ new ones in the periods after a major political transition when the lack of stability and
predictability make their power more ambiguous. All of these state strategies to manipulate
ethnic nationalism show that the process of increased salience of ethnic cleavages after major
political transition is not necessarily a natural one. Sometimes it stems from very purposeful
decisions by new governments to attempt control over an inherently chaotic transition period.
Even so, these attempts at control result in increased marginalization and exclusion of portions of
the population, with the potential to turn into ethnic conflict.
During periods of instability, regional power holders are often motivated by the
possibility of power to urge popular support for their own ethnic nationalities within their
territory, a process sometimes called “ethnic disaggregation” (McAdam et. al 2001). We can see
a clear example of this ethnic disaggregation in the break up of Yugoslavia in the early 1990s.
Politicians artificially heightened the ethnic conflict that eventually led to the dissolution of
Yugoslavia with their own agendas for a national identity, and ethnic cleavages were made
increasingly salient and contentious through politically driven nationalism (Besirevic 2010).
5. 5
Though perhaps not as intuitive a claim, rapid democratization holds risks for increased
ethnic tension just as a rapid increase in authoritarianism does. Even allowing increased political
participation along ethnic lines “politicizes ethnicity” and aggravates ethnic cleavages (Shu-yun
1999). Democratization itself is not a guarantee of peaceful government, a peaceful
governmental transition, or the easing of ethnic cleavages. In general, presence of ethnic
minorities makes peaceful democratic transitions less likely, and discriminatory politics and
politics divided along ethnic lines are more reliant on levels of income inequality than the levels
of democracy (Epstein et al. 2012). When ethnic groups have a sudden gain in political voice,
they simply have a new route to pursue ethnic goals. With these new mobilization opportunities,
the ethnic groups themselves can insert ethnic difference into the rhetoric of political issues.
Ethnically oriented political organizations and parties compete to be the representative group for
their respective ethnic groups (Jeram and Bertrand 2009), which increases the motivation to
delineate all the more firmly the differences between ethnicities. This means that the attempts at
marginalization would come from the politicized ethnic groups moving through the government
instead of the government itself. Moves towards democratization hold just as much potential for
enhanced ethnic cleavages as moves towards autocracy.
A deeper look into the relationship between national identity and ethno-political
marginalization before conflict and war would add greatly to the existing literature, which
mainly concentrates on the endogenous relationship between ethnic conflict and ethno-political
marginalization or the process by which state-building nationalism occurs, only briefly handling
instances in which nationalism fails to hold nations together. It would also allow room for more
diverse prescriptive measures in preventing out of control ethnic divisions and ethnic conflict for
governments in the midst of systemic change.
6. 6
THEORY AND HYPOTHESIS
My hypothesis states that governmental transition will lead to higher ethno-political
marginalization when the change is quantitatively negative and an increased number of ethnic
political groups when the change is quantitatively positive, both of which increase the salience of
ethnic cleavages. When citizens become uncertain about their connection to the state, ties to an
overarching national identity weaken. With this weakening on the individual level, ties rooted in
a national narrative meant to fortify national unity also weaken. Thus instead of an overarching
national identity, people turn to different facets of social identity, like ethnicity, to define
themselves and others. This process increases the salience of ethnic cleavages, inducing different
ethnic groups to further delineate themselves from each other. When the government experiences
a major transition towards democracy, space opens up for ethnic groups previously politically
marginalized, or that have fear of being marginalized in the current instability, to politicize and
use ethnic identity as political identity. When a government experiences a dramatic loss of
democracy, the ethnicity of the ruling powers is likely to establish dominance by politically
marginalizing or even excluding other ethnic groups (Cederman et. al. 2006). As discussed
above, this process can also be encouraged and catalyzed by the government that is itself
recovering from upheaval in an attempt to establish control or by individual figures looking for
political gain.
Though good for democratizing, increased political participation through the increased
presence of institutions and the guarantee of civil liberties may assist in an increased in ethnic
tension. This is especially true when ethnic groups, already disoriented from the departure from
7. 7
their previous relationship with the government, are likely to participate along ethnic lines,
politicizing ethnicity and provoking ethnic nationalism (especially as groups define themselves
even more specifically through political party membership) (Shu-yun 1999). Institutionalized
constraints on the exercise of power by the executive do not affect this politicization of ethnicity,
because the executive has even less power to affect the way ethnic groups vote.
Fewer institutions and civil liberties in the daily lives and political participation of
citizens mean the government has increased control in the way people live their lives. This is
especially true with the decrease in the number and influence of institutions that constrain the
main executive, giving this position more power to manipulate ethnic relations directly. More
authoritarian governments are more likely to emphasize one ethnic identity over the rest, of the
strongest minority group and/or the group to which the government itself belongs, sometimes
even suppressing or attempting to eliminate other minority groups from the political sphere (Shu-
yun 1999). The emphasized ethnic group may be nudged by this state of change to conflate the
national identity more heavily with its own ethnic identity, increasing the salience of ethnic
cleavages with other minority groups. These same minority groups have obvious cause to feel
threatened by such a major shift in what to expect from their national leaders (their previous
dealings with the government potentially null and void) and thus turn to ethnic identity and
loyalties for security. The increased politicization of ethnicity after a move towards democracy is
an effect of the institutionalized emphasis placed on membership in one ethnic group or another.
This same institutionalized emphasis on ethnicity after a severe loss of democracy increases the
likelihood for a rise in ethnic tensions just the same. Increased ethnic tension, however, is a
product of the transition itself, not the direction of the transition. Whether the country makes a
sudden move towards democracy or towards autocracy, it is the sudden move that interrupts
8. 8
predictable dialogue between the government and its citizens and politically aggravates pre-
existing ethnic cleavages.
Ethno-political marginalization is a multi-faceted and multi-rooted phenomenon, and thus
certain controls will be in place to isolate changes in the government/citizen relationship as the
main cause. I will first control for ethnic fractionalization. Ethnic fractionalization is a very
common measure of ethnic diversity, measuring the number of ethnic groups in a country.
Ethnic fractionalization has been shown to negatively correlate with economic growth and
positively correlate with ethnic conflict, so it is also factor (though not a direct cause) of two of
my controls, GDP per capita and previous violence. Therefore, ethnic fractionalization must be a
control in the measure of ethnic political marginalization.
I predict that recent conflict itself will be a strong and endogenous predictor for ethno-
political marginalization and will be positively correlated. Violence, like my independent
variable, increases the salience of ethnic differences. As the people caught in violent conflict are
pressured to choose sides for their own safety (the protection of an armed group considered more
safe than being caught in the crossfire), they will search for those most similar to themselves in
belief and behavior, forcing them to define what it means to belong to and not belong to a group.
This increases the salience of ethnic difference, even causing ethnic groups to amplify the
importance of these differences. This encourages the politicization of ethnicity in more
democratic societies and the marginalization of minorities by majorities in less democratic
societies. This amplification of difference also fuels more violence as groups relate to each other
less and less. Taking this into account, I will control for previous conflict by a margin of five
years.
9. 9
As pointed out by Schneider and Wiesehomeier, it has been empirically shown that rich
countries are better able to manage diversity than poorer ones (meaning that it has been shown
that GDP is negatively correlated to violent ethnic conflict) (1999). As we have read with Shu-
yun, countries with a higher capacity to influence the individual lives of their citizens (whether
indirectly through institutions and civil liberties or more directly through the lack these) are more
likely to manipulate existing ethnic cleavages and thus increase the likelihood of increased ethnic
marginalization in politics (1999). I will thus control for this factor through the variables GDP
per capita (a measure of a country’s wealth) and urbanization (a measure of a country’s
development).
Though polity measures how democratic a government is, it does not account for
institutional design (the distribution of state power), which also has an impact on the political
marginalization of minorities. A government with more centralized power combined with
assimilation rhetoric makes it likely that a single national group will dominate politics
(Rodrigues 2013). Ethnically diverse countries have utilized a federal model of governance to
address the problem of minority representation. This is under the logic that more local
governance leads to higher minority participation in politics, thus combatting minority
marginalization on the national level. As explored by Daniel Rodrigues, federalism itself may be
irrelevant for small homogeneous countries but necessary for larger, heterogeneous ones (2013).
This emphasis can have the opposite effect, however, when the federalism is divided down
ethnic, religious, or linguistic lines. Sometimes used as a divide-and-rule strategy by the
dominant political/ethnic group, minorities of each federal entity are subsequently marginalized
by the local minority in power (Mehretu 2012).
10. 10
Thus the form of government can decrease the likelihood of ethno-political
marginalization in some cases and increase it in others. The distribution of power in government
can be measured horizontally (between the branches and other similar divisions of government)
and vertically (from the top to the bottom, from the heads of state to local officials). I thus
control for the horizontal sharing of power with a variable for levels of federalism (how state
power is allotted across a territory). I control for the vertical sharing of power through the
presence of a president (a concentration of power in the executive) or a parliament (power
distributed to more local representatives).
Though recent studies have shown that economic inequality between individuals does not
increase the risk for violent conflict, several studies by Gudrun Østby (2008) have shown that
horizontal economic inequality (inequality along identity-based cleavages, like ethnicity coupled
with ethnic polarization have been linked to an increased likelihood for civil conflict. These
same studies also argue against purely ethnic (and not economic) polarization having significant
effect on the likelihood of violence. I argue that, on the contrary, horizontal economic
polarization is a factor in increased ethnic tension. Since the average income for each ethnic
group in each country is not readily available, I use more conventional measures of income to
control for economic inequality (the income of the highest ten percent of the population in a
country and the percent of people in the same country that live on under two dollars a day).
The quality of governance can affect a country’s ability to effectively marginalize
specific ethnic groups with any precision or success. It may be that no groups in general can
effectively participate in governance if the government itself is too weak and ineffectual.
Whether more authoritarian or more democratic, a national government must have effective
control over its territory and its people to have the ability to purposely include or exclude
11. 11
anyone. I will thus control for quality of governance through the variable of freedom from
corruption.
METHODS
I have employed a large-n study using five different measures of ethno-political
marginalization. These include the number of included groups, the number of excluded groups,
the percent of the population that is discriminated in the government, the percent that is
powerless in the government, and the number of ethno-politically relevant groups in total. To
avoid any problems with correlation between these dependent variables, each one was run
against the independent variables (polity change, absolute polity change, crossing zero, and
transitional polity change) and the controls in a separate regression. The independent variables
and the controls were added to each regression one by one, creating the staggered effect of the
variables in the analysis section of this paper. This was in order to visualize when certain
variables became or ceased to be statistically significant in relation to the other variables.
The primary independent variables of polity change and absolute polity change are taken
from the Polity IV data set to represent change in levels of democracy in one-year increments on
a scale of negative ten to ten (counting zero), with negative ten representing complete autocracy
and positive ten representing complete democracy. A polity score is measured by combining
three criteria: the presence of institutions and procedures through which citizens can express
effective preferences about alternative policies and leaders, the existence of institutionalized
constraints on the exercise of power by the executive, and the guarantee of civil liberties to all
citizens in their daily lives and in acts of political participation. Depending on the extent of each
of these criteria, a country is judged to be more or less democratic and given a score on the polity
12. 12
scale ranging from negative ten to ten. Polity change indicates the direction and magnitude of the
change up or down the scale, and absolute polity change indicates the magnitude of the change
regardless of direction.
In order to tease out the nuances of a simple ten to negative ten scale, I include two
“secondary” independent variables, which are meant to augment the understanding of the
primary independent variables. These two “secondary” variables (crosses zero and transitional
polity change) indicate whether the change in polity score from one year to the next crosses zero
on the polity scale. Zero is a threshold on this scale between authoritarian governance and
democratic governance. Two instances of change may have the same absolute polity change
score, but the one that crosses zero has arguably made a more significant jump than the one that
stays on one side of the scale. Thus a change from -9 to -2 is not as significant as a change from -
5 to 6 (indicating a transition between authoritarianism and democracy). Even the addition or
subtraction of the (effective) ability to vote is a major difference between autocratic and
democratic governance not represented without crossing zero. This “crosses zero” variable is
coded as a one for crossing zero and a zero for not.
The magnitude of the change, however, continues to matter even when comparing two
instances where both changes crossed zero on the scale. A small change in polity score of -2 to 2
does not indicate much actual difference in governance on the ground, as a score of zero
indicates very little state strength in general. A weak state hovering close to zero on the polity
scale does not have the power or reach to realistically and purposefully marginalize groups based
on their ethnicity. The absolute polity change (the magnitude of the change) is still relevant when
crossing zero. I thus control for “transitional polity change.” Not crossing zero is coded as a zero
and crossing zero is coded as equal to the variable of absolute polity change, effectively
13. 13
weighting the “crossing zero” variable according to the magnitude of the change.
The five measures of the dependent variable of ethno-political marginalization (the number
of included groups, number of excluded groups, percent of the population that is discriminated in
the government, percent that is powerless in the government, and the total number of ethno-
politically relevant groups) are all taken from the Cederman, Girardin, and Wimmer data set
from their paper on the subject (2006). A group is defined as “included” if its leader(s) serve in
governmental positions, if its members share ethnic ties to leading politicians, and/or there are
specific institutional arrangements that give it political power (like power-sharing and
consociationalism). Excluded groups are defined as those lacking these traits. A group is defined
as “powerless” when the members hold no political power either at the national or the regional
level but are not explicitly discriminated against. A group is defined as discriminated when the
members are subjected to active, intentional, and targeted discrimination with the intent of
excluding them from both regional and national power. Finally, Cederman defines a group as
politically relevant if at least one significant interest group claims to represent the interests of an
ethnic group or if ethnicity is the basis for political discrimination.
Previous violent conflict (a control) is measured through the Uppsala Conflict Data
Program, which has data on conflict from 1946 to 2008, including location, battle deaths, and
onset/duration data. For my control, I use the onset year (the year the conflict began) plus the
duration (the number of months the conflict lasted) to measure whether or not conflict occurred
within five years of the change in polity, with a one indicating “yes” and a zero indicating “no.”
The controls GDP per capita and percent urban are both taken from the World Bank World
Development Indicators data set. These two variables, however, are strongly correlated and thus
are run separately in the regression tables in the section below. The income of the top ten percent
14. 14
and the percent of people who live under $2.00 per day are also from the World Bank.
The control for the distribution of power is to be measured by two variables taken from a
book on corruption in different forms of government by John Gerring and Strom C. Thacker
(2008). The first is unitarianism, a variable I rename “federalism,” which measures if a state’s
government is non-federal (a unitary system with power concentrated in a centralized
government), semi-federal (power is constitutionally divided between territorial political units
but still under a centralized government), or federal (power is constitutionally divided between
territorial political units with little or no centralization of power). These are coded as zero, one,
and two, respectively. The second is parliamentarianism, which measures if a state is presidential
(power is centralized in an executive figure), semi-presidential (power is concentrated in an
executive figure but shared across one or more other branches of government), or parliamentary
(power is distributed among representatives of the legislative branch). These are also coded as
zero, one, and two, respectively.
The control of freedom from corruption was taken from the Heritage Foundation’s
Economic Freedom Index. It is coded on a scale from one to one hundred, with one hundred
indicating “very little corruption” and zero indicating a “very corrupt government.” This scale
was primarily derived from data from Transparency International’s Corruption Perceptions
Index, which itself is on a scale of zero to ten. The Heritage Foundation converts the data into a
scale of one hundred by multiplying the Transparency International score by ten. The data for
freedom from corruption is limited by year, as corruption has only recently begun to be
quantified. To prevent it from constricting the number of observations for all other regressions, it
is added to the regression only at the very end, as seen in the charts in the next section.
15. 15
ANALYSIS
Each of the dependent variables (included groups, excluded groups, powerless
population, discriminated population, and total ethno-politically relevant groups) was run in a
separate regression that included all independent variables1
(absolute polity change, polity
change, crosses zero, and transitional polity change) and all controls2
, each added to the
regression one by one. The number of observations decreased significantly further into the
staggered regressions due to the limitations of the data.3
Only columns showing relevant changes
in significance are shown in the tables below for easier interpretation.
After testing, the data indicates that changes in polity inconsistently affect the levels
ethno-political marginalization and do not affect the politicization of ethnic groups. Absolute
polity change was not significantly correlated with any of the dependent variables, indicating that
the magnitude of a change alone is not a significant factor in the marginalization or politicization
of ethnic groups. However, though the magnitude alone did not prove to be significant, the
direction of the change (the polity change variable) was significantly positively correlated with
the proportion of the population that is politically powerless. The only other dependent variable
significantly correlated with any of the independent variables was the proportion of the
population that is politically discriminated, which was positively correlated with transitional
polity change and crossing zero. Thus, the magnitude and the direction of a change in polity are
significant factors in ethno-political discrimination when crossing zero. These and other
explanations for the variation in the other three dependent variables are explored below.
1
Independent variables were run in a correlation matrix and were not correlated above the 0.5 level.
2
The controls “GDP per capita” and “Urbanization” were run separately, as they were correlated above the 0.5
level.
3
To combat this effect, the variables “Freedom from corruption,” “Parliamentarianism,” and “Federalism” were
added late in the regression, as they restricted the number of observations dramatically.
16. 16
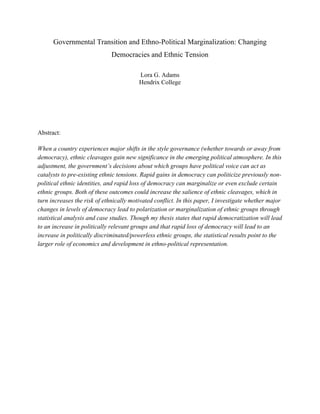
Table 1
Column1
(3)
(4)
(6)
(12)
(13)
(14)
VARIABLES
Included
Groups
Included
Groups
Included
Groups
Included
Groups
Included
Groups
Included
Groups
Absolute
polity
change
-‐0.00757
-‐0.0103
0.00588
0.111*
0.0953
0.101
[0.0114]
[0.0114]
[0.0319]
[0.0641]
[0.0965]
[0.0923]
Polity
change
0.0120
0.0130
-‐0.0358
-‐0.113*
-‐0.134
-‐0.136
[0.0110]
[0.0110]
[0.0311]
[0.0629]
[0.0908]
[0.0868]
GDP
per
capita
0.000593*
0.000622*
-‐0.00304
-‐0.119**
[0.000356]
[0.000356]
[0.0142]
[0.0491]
Ethnic
fractionalization
2.916***
2.882***
2.821***
2.442***
2.609***
2.701***
[0.0669]
[0.0676]
[0.199]
[0.265]
[0.536]
[0.496]
Previous
conflict
0.197***
0.0257
-‐0.423**
-‐0.445
-‐0.642*
[0.0561]
[0.156]
[0.174]
[0.340]
[0.332]
Income
of
highest
10%
0.00481
-‐0.000315
0.00664
0.0169
[0.00656]
[0.00902]
[0.0231]
[0.0209]
Number
under
$2/day
0.00488***
0.0169***
0.00327
0.00293
[0.000445]
[0.000942]
[0.00885]
[0.00831]
Year
0.000734
-‐0.00621
-‐0.0231
[0.0137]
[0.0633]
[0.0599]
Transitional
polity
change
0.0347
-‐0.0372
0.00325
[0.0782]
[0.122]
[0.118]
Crosses
zero
-‐1.061
-‐0.146
-‐0.968
[1.234]
[1.854]
[1.787]
Parliamentarianism
-‐0.168*
0.109
-‐0.0126
[0.0898]
[0.195]
[0.188]
Federalism
0.0910
-‐0.0882
-‐0.214
[0.109]
[0.266]
[0.251]
Urbanization
-‐0.00637
-‐0.0300***
[0.00397]
[0.00754]
Freedom
from
corruption
0.0251***
0.0209**
[0.00953]
[0.00825]
Observations
7,558
7,558
781
311
119
119
R-‐squared
0.201
0.203
0.338
0.684
0.370
0.422
Standard
errors
in
brackets
***
p<0.01,
**
p<0.05,
*
p<0.1
20. 20
Table 5
Column1
(2)
(4)
(5)
(10)
(12)
(13)
(14)
VARIABLES
Total
Ethno-‐
Politically
Relevant
Pop
Total
Ethno-‐
Politically
Relevant
Pop
Total
Ethno-‐
Politically
Relevant
Pop
Total
Ethno-‐
Politically
Relevant
Pop
Total
Ethno-‐
Politically
Relevant
Pop
Total
Ethno-‐
Politically
Relevant
Pop
Total
Ethno-‐
Politically
Relevant
Pop
Absolute
polity
change
0.00817***
0.00543**
0.000340
-‐0.00917
-‐0.00817
0.00275
0.00245
[0.00235]
[0.00230]
[0.00567]
[0.0130]
[0.0129]
[0.00773]
[0.00773]
Polity
change
0.00108
0.00145
-‐0.00477
-‐0.00390
0.000142
-‐0.00129
-‐0.00164
[0.00228]
[0.00223]
[0.00554]
[0.0128]
[0.0127]
[0.00728]
[0.00726]
GDP
per
capita
-‐0.000165**
-‐6.85e-‐05
-‐0.00179
0.00393
-‐0.00129
[7.34e-‐05]
[7.19e-‐05]
[0.00168]
[0.00459]
[0.00393]
Ethnic
fractionalization
0.242***
0.0170
0.137**
0.147***
-‐0.0202
-‐0.0135
[0.0137]
[0.0340]
[0.0559]
[0.0534]
[0.0430]
[0.0415]
Previous
conflict
0.0509***
0.0168
-‐0.00275
-‐0.00654
-‐0.0635**
-‐0.0600**
[0.0113]
[0.0275]
[0.0351]
[0.0352]
[0.0273]
[0.0278]
Income
of
highest
10%
-‐0.00307***
-‐0.00612***
-‐0.00813***
-‐0.00321*
-‐0.00293*
[0.00114]
[0.00172]
[0.00182]
[0.00185]
[0.00175]
Number
under
$2/day
0.000173
4.22e-‐05
-‐0.000153
-‐3.96e-‐05
[0.000180]
[0.000190]
[0.000709]
[0.000695]
Year
-‐0.000664
0.000633
0.00479
0.00446
[0.00266]
[0.00277]
[0.00508]
[0.00501]
Transitional
polity
change
-‐0.00684
-‐0.00340
-‐8.90e-‐05
-‐0.000339
[0.0159]
[0.0158]
[0.00981]
[0.00984]
Crosses
zero
0.152
0.0736
-‐0.0558
-‐0.0489
[0.250]
[0.249]
[0.149]
[0.149]
Parliamentarianism
-‐0.0771***
-‐0.0743***
-‐0.00762
-‐0.00685
[0.0177]
[0.0181]
[0.0156]
[0.0157]
Federalism
-‐0.0533**
-‐0.0356*
-‐0.0292
[0.0221]
[0.0213]
[0.0210]
Urbanization
0.000941
0.000265
[0.000802]
[0.000631]
Freedom
from
corruption
-‐0.000856
-‐0.00103
[0.000764]
[0.000690]
Observations
7,558
7,558
811
317
311
119
119
R-‐squared
0.002
0.048
0.012
0.087
0.128
0.111
0.111
Standard
errors
in
brackets
***
p<0.01,
**
p<0.05,
*
p<0.1
21. 21
The independent variable of polity change is only statistically significant concerning the
proportion of the population that is politically powerless (as seen in Table 4). It is positively
correlated, meaning that an increasing polity score coincides with a higher proportion of the
population being politically powerless. Since my hypothesis states that an increase in polity score
would mean an increase in total ethno-politically relevant groups (with which no independent
variables were correlated), that part of the hypothesis is incorrect. Instead, polity change had a
positive relationship with the “powerless” variable of ethno-political marginalization, a
relationship I had predicted would be negative. Again, powerlessness is defined here as not
represented in government but also not purposefully excluded. As a country becomes more
democratic, indicating that the government provides more avenues for political participation and
representation than before, groups that are excluded from governance are probably less likely to
be so because the government has purposefully marginalized them. Instead, it becomes more
likely that are not represented in government for non-political reasons, as other statistically
significant variables indicate (again seen in Table 4).
Both economic inequality variables are significantly correlated with the proportion of the
powerless population (Table 4) as well. These are the income of the top ten percent (positively
correlated) and the number that live on less than two dollars a day (negatively correlated). This
indicates that a wealthier upper class and a decrease in poverty coincide with a rise in the
powerless population. A wealthier upper class may open up the possibility for money to have an
increased role in politics, and increased democracy weakened by the influence of the wealthy
means that those who cannot afford representation may be politically marginalized by
economics. This is supported by the negative correlation between freedom from corruption and
the proportion of the powerless population, meaning an increase in the powerless population
22. 22
correlates with an increase in corruption. Though a decrease in poverty coinciding with an
increase in the proportion of powerless groups may seem counter-intuitive, it may still be a
question of income. Even as more people begin to make more than two dollars a day, these
people have a ways to go before rising above the poverty line. Even if they are not actively
discriminated against, the simultaneous increases in the wealth of the wealthy and levels of
corruption may work to keep poorer ethnic groups from effectively participating in governance.
Ethnic fractionalization is also significantly positively correlated with powerless
population (Table 4), meaning that more ethnic groups indicate a higher proportion of
powerlessness. A higher number of ethnic groups also means indicates the many of the groups
themselves are smaller than in a country with only a few large groups. As with the poorer ethnic
groups in relation to the wealthy ones, the high number of smaller ethnic groups may have to
work harder than the larger groups to have political influence. Their minimized capacity for self-
representation in government keeps them from easily attaining political influence (this would of
course be the opposite for the few small yet wealthy ethnic groups, though they would be in the
minority in an ethnically fractionalized country).
The only other dependent variable that is correlated with any of the independent variables
was the proportion of the discriminated population. Both transitional polity change and the
crosses zero variable are positively correlated with the proportion of the discriminated population
(Table 3), meaning that increased ethno-political discrimination coincides with crossing the
threshold between autocracy and democracy (zero), especially when the magnitude of the
crossing is larger. What is particularly interesting is that the direction of the change in polity
score (the variable “polity change”) is not statistically significant. So while making a drastic
transition between an autocratic government and a democratic government is strongly correlated
23. 23
with an increase in the proportion of the population discriminated against, it does not matter
whether this transition is to autocracy or democracy.
My hypothesis was that the direction of the change (polity change) would be negatively
correlated with ethno-political marginalization, especially this particular measure
(discrimination) that indicates purposeful marginalization by those in power. This was not the
case. The data shows that changes in polity do matter concerning the level of discrimination, but
to matter they must cross zero on the polity scale. This supports the assertion that when we can
no longer describe a government using its previous label (autocratic or democratic), the change
in governance is more significant on the ground than when a government experiences a similar
change in polity score but remains autocratic or democratic.
Though the other three dependent variables (the number of included and excluded groups
and the total number of ethno-politically relevant groups) are not significantly correlated with
any of the independent variables, there are a few controls that are consistently statistically
significant concerning these three variables. The first is previous violence, which is positively
correlated with the number of excluded groups and negatively correlated with the number of
included groups and the total number of ethno-politically relevant groups (Tables 2, 1, and 5,
respectively). This means that when violence is recent or present, the number of excluded groups
goes up and the number of included groups and ethno-politically relevant groups goes down.
This makes sense, as whatever groups are fighting to maintain or gain control would be reluctant
to share their power, meaning more groups are excluded from governance and fewer are
included. In times of violent turmoil, it could also be dangerous to call attention to one’s ethnic
group by using one’s ethnicity as a political tool, as both emphasizing ethnic difference and
having a vocal political presence could draw the violence to a certain ethnic group. It follows
24. 24
that the presence of violence would coincide with a decreased number of ethno-politically
relevant groups. For these three variables, the presence of violence has more of an effect ethno-
political marginalization and the politicization of ethnic groups than whether or not the
government is in transition, again refuting my hypothesis.
The control variables involving economics and development (income of the highest 10%,
number that live on under two dollars a day, GDP per capita, and urbanization) also continue to
have a significant correlation with these three variables. GDP per capita and urbanization in
particular have an interesting negative relationship with the number of included groups (Table 1).
One might think that a wealthier, more developed country would have less of a problem with the
marginalization of ethnic groups, as the literature indicates, but the data indicates that the
opposite is true. This may be because countries with more wealth and development have
resources worth monopolizing, whether monetary or natural. This is motivation for those with
political influence to take control of what makes the country wealthy, excluding rival groups in
the process. Again, all this suggests that money and resources have a stronger connection to
ethno-political marginalization than a change in polity score when it comes to included,
excluded, and ethno-politically relevant groups.
Concerning the power-sharing variables (federalism and parliamentarianism), only
federalism is significantly correlated with any of the dependent variables. Federalism (horizontal
power-sharing across a territory) is negatively correlated with both the number of excluded
groups (Table 2) and the total number of ethno-politically relevant groups (Table 5), meaning
increased horizontal power-sharing in government coincides with a lower number of excluded
and politically relevant ethnic groups. This is particularly interesting in the case of the number of
politically relevant groups, because federalism is significant when run with GDP per capita and
25. 25
not significant when run with urbanization (which are run separately in the final columns
because of the strong correlation between them) (again, Table 5). This indicates that the level of
federalism matters when the wealth of a country is taken into account but is still less important
than how developed that country has become (how urbanized it is). This may be because the
territorial distribution of power matters less when there are more and larger urban centers that
encompass a larger proportion of the population. Urban centers are also the centers of
government, and so the more of the population having direct access to governance may matter
more for the number of politicized ethnic groups than how power is distributed across an entire
territory. This only matters enough to make federalism no longer statistically significant, it
seems, because the effect of urbanization on the number of ethno-politically relevant groups is
not itself statistically significant.
Lastly, the staggered regressions indicate that state strength (or freedom from corruption,
as it has been operationalized) often affects the significance of other variables, even when
freedom from corruption itself is not necessarily statistically significant. Many variables that are
consistently significant or not significant change when the variable freedom from corruption is
added, the significant losing significance and the previously insignificant gaining it. This occurs
in all five tables, though freedom from corruption itself is only statistically significant in Tables
1, 2, and 4 (included groups, excluded groups, and powerless population). Corruption’s effect on
such a wide variety of variables points to an equally wide variety of causal mechanisms,
indicating that the data may need to be re-examined. Later examinations of polity change and
ethno-political marginalization would need to re-explore the appropriate controls to make sure
that no important factors are missing. This may also be a function of the severely limited
observations by the time the corruption variable is added in. This is an unfortunate result of data
26. 26
constrained by availability, but it is also obvious that the freedom from corruption variable is an
extremely important control that would significantly alter the results of the regressions if
removed.
DIFFICULTIES: ISOLATING THE INDEPENDENT VARIABLES
As explored in the section above, ethno-political marginalization is a complex
phenomenon that is influenced by a highly diverse set of factors that apply to different aspects of
marginalization in different ways. No variable was statistically significant across all five of the
dependent variables, including any of the controls, though every variable but absolute polity
change and year was significantly correlated to at least one dependent variable. The number of
control variables needed to isolate changes in levels of democracy as a major factor in
marginalization resulted in a drastic decrease of observations with each variable added to the
regressions.
Instead of supporting the statistical significance of the primary independent variables in
relation to the powerless population as intended (Table 4), the “secondary” independent variables
were statistically significant on an entirely separate measure of ethno-political marginalization
(the discriminated population, Table 3). The primary and secondary independent variables,
though they concern the same polity scores and the same polity scale, are never simultaneously
significant. Though the significance of crossing zero and transitional polity change support the
hypothesis that the presence and magnitude of polity change matter concerning political
discrimination, absolute polity change (the most simple measure of magnitude) was never in fact
significant. It is clear that the dependent variables are not the only source of complexity, as the
independent variables also contain an unexpected diversity of influence on the dependent
27. 27
variables. These limitations make it difficult to come up with generalizable explanations for the
variance of the dependent variables as each has a unique set of significant causal mechanisms
and a unique relationship to the independent variables.
CONCLUSION
Though it is difficult to draw generalizable conclusions from these results about the true
relationship between changes in polity and ethno-political marginalization (besides the fact that
there intermittently is one), the other variables significantly correlated with ethno-political
marginalization can provide some indication of what factors affect this complicated and multi-
faceted variable. Economic variables frequently factor into levels of what we might call “passive
marginalization,” marginalization by structural factors as opposed to the intentions of those in
power, suggesting that ethnic divisions can be drawn down equally divisive socioeconomic lines.
Levels of state strength, wealth, and development point to a government’s ability and motivation
to exclude groups, and structures of power-sharing may help negate the effect of more
marginalizing influences.
According to these results, organizations or activists that emphasize political
representation rights for marginalized populations would do well to concentrate on economic
inequality and government accountability to achieve their goals. Though the exact relationship
between governmental transition and the marginalization of ethnic groups remains complicated
and difficult to isolate, there is obviously still value in examining these times of transition more
closely to disentangle the threads of what conditions facilitate ethno-political marginalization in
order to combat them.
28. 28
Works Cited
Cederman, Lars-Erik, Luc Girardin, and Andreas Wimmer. 2006. “Getting Ethnicity Right: An
Expert Survey on Power Distributions among Ethnic Groups.” Center for Comparative
and International Studies 1-19.
Deitelbaum, Catherine and Robert M. Kunovich. 2004. “Ethnic Conflict, Group Polarization, and
Gender Attitudes in Croatia.” Journal of Marriage and Family 66(December): 1089-1107.
Epstein, David, Bahar Leventoglu, and Sharyn O’Halloran. 2012. “Minorities and
Democratization.” Economics and Politics 24(3): 259-278.
Gerring, John and Strom C. Thacker. 2008. A Centripetal Theory of Democratic Governance.
Cambridge: Cambridge University Press.
Haas, Earnest B. 1986. “What is Nationalism and Why Should We Study It?” International
Organization 40(Summer): 707-744.
McAdam, Doug, Sidney Tarrow, and Charles Tilly. 2001. “Dynamics of Contention.”
Cambridge University Press (Cambridge).
Mehretu, Assefa. 2012. “Ethnic Federalism and Its Potential to Dismember the Ethiopian State.”
Progress in Development Studies 12(2-3): 113-133.
Østby, Gudrun. 2008. “Polarization, Horizontal Inequalities and Violent Civil Conflict.” Journal
of Peace Research 45(2): 143-162.
Rodrigues, Daniel. 2013. “Considerations on the Role of Federalism in Managing Ethnic
Plurality in Multinational States in Conflict Prevention.” International Relations 4(2): 104-
117.
29. 29
Schneider, Gerald and Nina Wiesehomeier. 2010. “Diversity, Conflict, and Growth: Theory and
Evidence.” Diversity 2(9): 1097-1117.
Shu-yun, Ma. 1999. “Reciprocal Relation Between Political Development and Ethnic
Nationalism.” Social Science Journal 36(2): 369-379.
Wimmer, Andreas. 1997. "Who owns the state? Understanding ethnic conflict in post-colonial
societies", in Nations and Nationalism 3 (4):631-665.
Wimmer, Andreas. 2002. Nationalist Exclusion and Ethnic Conflict: Shadows of Modernity.
Cambridge: Cambridge University Press.