
Recommended
Recommended
More Related Content
Viewers also liked
Viewers also liked (11)
Similar to Pamphlet Readability for Cancer Patients
Similar to Pamphlet Readability for Cancer Patients (20)
Pamphlet Readability for Cancer Patients
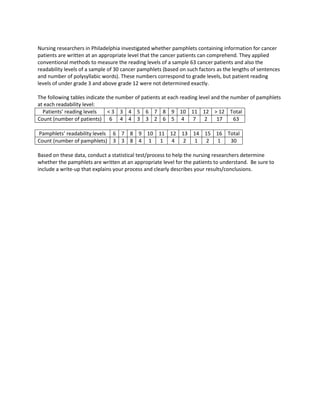
- 1. Nursing researchers in Philadelphia investigated whether pamphlets containing information for cancer patients are written at an appropriate level that the cancer patients can comprehend. They applied conventional methods to measure the reading levels of a sample 63 cancer patients and also the readability levels of a sample of 30 cancer pamphlets (based on such factors as the lengths of sentences and number of polysyllabic words). These numbers correspond to grade levels, but patient reading levels of under grade 3 and above grade 12 were not determined exactly. The following tables indicate the number of patients at each reading level and the number of pamphlets at each readability level: Patients’ reading levels < 3 3 4 5 6 7 8 9 10 11 12 > 12 Total Count (number of patients) 6 4 4 3 3 2 6 5 4 7 2 17 63 Pamphlets’ readability levels 6 7 8 9 10 11 12 13 14 15 16 Total Count (number of pamphlets) 3 3 8 4 1 1 4 2 1 2 1 30 Based on these data, conduct a statistical test/process to help the nursing researchers determine whether the pamphlets are written at an appropriate level for the patients to understand. Be sure to include a write-up that explains your process and clearly describes your results/conclusions.
- 2. Reading Grade Pamphlet Count Patient Count Pamphlet Fraction Patient Fraction Patients Without Pamphlets < 3 0 6 0 0.0952381 0.0952381 3 0 4 0 0.0634921 0.06349206 4 0 4 0 0.0634921 0.06349206 5 0 3 0 0.047619 0.04761905 6 3 3 0.1 0.047619 0 7 3 2 0.1 0.031746 0 8 8 6 0.2666667 0.0952381 0 9 4 5 0.1333333 0.0793651 0 10 1 4 0.0333333 0.0634921 0.03015873 11 1 7 0.0333333 0.1111111 0.07777778 12 4 2 0.1333333 0.031746 0 >12 6 17 0.2 0.2698413 0.06984127 Total 30 63 1 1 0.44761905 Let the pamphlet count be the number of pamphlets at the specified reading grade. Let the patient count be the number of patients at the specified reading grade. Let the pamphlet fraction be the fraction of pamphlets at the specified reading grade. Let the patient fraction be the fraction of patients at the specified reading grade. Let the patients without pamphlets be the fraction of patients without pamphlets. Fraction Patients with a reading grade above the lowest pamphet reading grade 0.73015873 Fraction of Patients with a reading level grade greater than 12 0.26984127 Fraction of Pamphlets unread assuming Better Readers Read Easier Pamphlets At grade 12 At grade 9 At grade 8 At grade 7 At grade 6 Total 0.03174603 -0.053968 0.2253968 0.068254 0.052381 0.37777778
- 3. 0 2 4 6 8 10 12 14 16 18 < 3 3 4 5 6 7 8 9 10 11 12 >12 Amount of Patients or Pamphlets at the Reading Level Readability Level by Grade Readability Levels of the Pamphlets and Cancer Patients Pamphlet Count Patient Count
- 4. 0 0.05 0.1 0.15 0.2 0.25 0.3 < 3 3 4 5 6 7 8 9 10 11 12 >12 Fraction of Sample of Pamphlets and Patients Reading Grade Fraction of the Sample of Patients and Pamphlets at Reading Grades Pamphlet Fraction Patient Fraction
- 5. 0 0.01 0.02 0.03 0.04 0.05 0.06 0.07 0.08 0.09 0.1 < 3 3 4 5 6 7 8 9 10 11 12 >12 Fraction of Patients without Pamphlets Readability Grade Patients Without Pamphlets Using Fractions
- 6. Pamphlet Reading Grade Patient Reading Grades Patient Reading Grades Patient Reading Grades 6 2 9 13 6 2 9 13 6 2 9 13 7 2 10 13 7 2 10 13 7 2 10 13 8 3 10 13 8 3 11 13 8 3 11 13 8 3 11 13 8 4 11 8 4 11 8 4 11 8 4 13 9 5 13 9 5 13 9 5 13 9 6 13 10 6 13 11 6 13 12 7 11 12 7 12 12 8 12 12 8 13 13 8 13 13 8 13 13 8 13 13 8 13 13 9 13 13 9 13 Pamphlet Reading Grades is the sample of reading grades of the pamphlets. Patient Reading Grades is the sample of reading grades of the patients.
- 7. Two-Sample T-Test and CI: C5, C6 Two-sample T for C5 vs C6 N Mean StDev SE Mean C5 30 9.53 2.46 0.45 C6 63 8.60 3.89 0.49 Difference = μ (C5) - μ (C6) Estimate for difference: 0.930 95% CI for difference: (-0.392, 2.253) T-Test of difference = 0 (vs ≠): T-Value = 1.40 P-Value = 0.166 Patient Reading Grades Pamphlet Reading Grade 14 12 10 8 6 4 2 Data Pamphlet and Patient Reading Grade Box Plot
- 8. Interpretation of Graphs Notes -On the pamphlet and patient reading grade samples, the reading level of 2 indicates all reading grades less than 3 (not just 2) and the reading level of 13 indicates all reading grades above twelve (not just 13). The justification for that is Minitab will not allow any text that is not a number into a cell that is not a text cell and cannot do calculations with text. -The pamphlet and patient reading grades on Minitab are the samples of reading grades. That is to say, since there are 3 pamphlets with a reading grade of 6, the number “6” is entered into 3 cells of the pamphlet reading level column. This is done because Minitab makes distributions and boxplots based on the number of times a number has been entered in a column. -The reading grade of the pamphlets greater than 12 was not specified. To compare the two samples, all the patients with a reading level greater than 12 were grouped together to create comparable samples without losing data. -The patient sample was significantly larger than the pamphlet sample. It did not specify in the problem why this is. The situation may be that only a few people could be in the waiting room at a time. In that case it makes most sense to look at distributions. -The N on the two sample T-Test is the number of points from each sample and µ(x) is the mean of x.
- 9. Boxplot -The lack of an upper whisker on the patient reading level indicates that the amount of patients above the reading grade of 12 (as previously symbolized by the number “13”) accounts for more than 25% of the data, and as calculated in Excel it accounts for 26.9842% of the data. -The two boxes and lack of an upper whisker on the patient reading level boxplot spanning the entire spread of the pamphlet reading grade’s boxplot means that a little less than 75% of the patients are above the lowest reading grade of the pamphlet. In Excel this is calculated to be 73.0159%. -The two plots share the same midpoint of the reading grade 9. With the fraction of patients with reading levels above thirteen to be about a quarter, the two graphs also share the same upper 25% quartile range. This means that the upper 50% of the separate samples of patients and pamphlets are distributed similarly. However, all of the lowest 25% of the patients reading grades are below the reading grade of 6, the lowest reading grade of a pamphlet. The lower middle 25% of the patients are at a reading grade of the lower 50% of the pamphlets. Therefore, the lower 50% of the separate samples of pamphlets and patients are not similarly distributed. -The pamphlets are moderately readable from this analysis. Bar Graph -I initially graphed the number of people and pamphlets at each reading grade, but I was not sure what to make of it at first. After making a boxplot, I wondered if it would make more sense
- 10. to graph the fraction of pamphlets and patients at each reading grade, seeing as both samples are of different sizes. -I decided to see if the reading grades of the pamphlets were appropriate by comparing the distributions at each grading level. A person can read at a reading grade lower than them but not higher than them, so I decided to determine the fraction of people who would be unable to read a pamphlet if the samples were equal. So I assigned the extra people from the higher reading grades to the lower reading grades and found the amount of unread pamphlets by this formula: U(x) = P(x)- (C(x) + ∑(y) i = x + 1(C(i) – P(i))) if U(x) is the amount of unread pamphlets at a reading grade of x, P(x) is the amount of pamphlets at a reading grade of x, C(x) is the amount of patients at a reading grade of x, and y is highest reading grade below the last reading grade with unread pamphlets. U(x) was a negative number for grade nine, which means there extra patients assigned to grade 9 and they were assigned to grade 8. After all the amounts of unread pamphlets of each grade were added together, 37.77778% of the pamphlets were unread and 37.77778% of the patients lacked pamphlets. The pamphlets are inappropriately readable here. -If instead it were decided that pamphlets of a reading grade lower the than the patients’ were where too trivial for them, the formula for the amount of unread pamphlets is instead U(x) = ∑(13) i = <3 Max{0, P(i) – C(i)}. With this formula it is determined that 44.7619% of patients will not have a pamphlet. By restricting the patients to one reading grade of pamphlets I increased the amount of unread pamphlets, and it is certain that the pamphlets are at an inappropriate reading grade.
- 11. The 2 Sample T-Test and Confidence Interval -This method is probably the way the people who created this problem wanted to approach it. -During the t-test, I decided not to round to whole numbers (although it would technically be incorrect to say “The average reading grade was 9.53”) because the domain of reading grades was small enough that rounding to whole numbers would create too much error in Minitab. -The 95% confidence interval means that, if we could take multiple samples, 95% of the time the pamphlet reading grade mean less the patient reading grade mean will be between -0.392 and 2.253 (with -0.392 meaning that the patient reading grades are greater than the pamphlet reading grades). Also, because 0 is within the interval, the null hypothesis cannot be rejected. -The null hypothesis is that the mean of the pamphlets’ reading grades is the same as the patients’ reading grades. The alternative hypothesis is that the two means are not the same. With the p-value of 0.166 > 0.100, there is little evidence against the null hypothesis, so we fail to reject the null hypothesis. (The p-value is the odds that the null hypothesis is accepted.) This means the pamphlets are of an appropriate reading for the patient. Conclusion Though there may be a degree of subjectivity in determining whether a number indicates that the pamphlets are readable, it is certain that the appropriateness of the pamphlets would be greatly improved by producing pamphlets of a reading grade of 5 and lower.